Abstract
The most basic level of eukaryotic gene regulation is the presence or absence of nucleosomes on DNA regulatory elements. In an effort to elucidate in vivo nucleosome patterns, in vitro studies are frequently used. In vitro, short DNA fragments are more favorable for nucleosome formation, increasing the likelihood of nucleosome occupancy. This may in part result from the fact that nucleosomes prefer to form on the terminal ends of linear DNA. This phenomenon has the potential to bias in vitro reconstituted nucleosomes and skew results. If the ends of DNA fragments are known, the reads falling close to the ends are typically discarded. In this study we confirm the phenomenon of end bias of in vitro nucleosomes. We describe a method in which nearly identical libraries, with different known ends, are used to recover nucleosomes which form towards the terminal ends of fragmented DNA. Finally, we illustrate that although nucleosomes prefer to form on DNA ends, it does not appear to skew results or the interpretation thereof.
Introduction
Chromatin is the combination of DNA and DNA-associated proteins. A histone octamer, made up of eight histone proteins, serves as the first means of DNA compaction and organization [1]. DNA wraps around a histone octamer ~1.7 times to form a nucleosome [2, 3]. In a nucleosome, there are two types of DNA positioning: rotational and translational [4, 5]. Rotational positioning is the way the DNA double helix interacts with the histone proteins as it turns; translational positioning is where the nucleosome forms laterally along the piece of DNA. In most contexts, the phrase “position” refers to the nucleosome translational position.
As the first means of DNA compaction and organization, where nucleosomes form has a significant role in basic cell processes such as transcription, DNA replication, and DNA repair; and by extension has a role in more elaborate cell states such as differentiation and cancer. With such far-reaching consequences, understanding what positions nucleosomes becomes paramount. Thus, reconstituting nucleosomes in vitro becomes a powerful tool in understanding the patterns and changes of nucleosome positioning.
A commonly used method for determining high-nucleosome-affinity DNA sequences is through the use of in vitro nucleosome reconstitutions. Whole-genome applications of this method begin with isolation of protein free genomic DNA followed by generation of smaller DNA fragments primarily through sonic shearing or restriction enzyme digestion. Recombinant or isolated histone octamers and DNA fragments are then added together in high-salt solution in a stoichiometric ratio such that on average a single nucleosome will form on each individual DNA fragment. The salts in the solution are then dialyzed away, allowing the formation of nucleosomes [6, 7]. Nucleosome positions from the in vitro reconstituted assemblies can be compared to their in vivo genomic equivalents, allowing for the identification of not only high-nucleosome-affinity sequences determined exclusively by intrinsic DNA sequences, but also the amount of in vivo remodeling that occurs within individual cell or tissue types. Such an approach was used by Locke et al. to demonstrate the extent of nucleosome remodeling that occurs in vivo on the Caenorhabditis elegans (C. elegans) genome [8].
While in vitro nucleosome reconstitutions provide valuable information, the technique contains at least one inherent bias that must be overcome to fully use the derived data. It has been demonstrated that DNA-fragment ends can influence nucleosome formation, encouraging end-proximal nucleosome formation relative to the remainder of the DNA fragment [9, 10]. This preference, given names such as proximal end-bias, fragment end-bias, terminal end-bias, end effect, and end bias, can introduce a major hurdle when attempting to identify high-nucleosome-affinity DNA sequences. Because of this major bias, in any in vitro nucleosome reconstitution experiment, it becomes impossible to determine if in vitro nucleosome (hereafter referred to as invitrosome) [11] formation is due to end bias or an actual affinity for the underlying nucleotide sequence.
When reconstituting nucleosomes in vitro, there are four major methods of reconstitution that have been used in recent years. First, reconstituting on whole chromosomes [12]. Second, reconstituting on large (5kb and larger) linear or circular fragments of DNA [13–15]. Third, reconstituting on genomic DNA that has been sheared [8]. Fourth, reconstituting on short artificially synthesized DNA sequences [16, 17]. Each approach has advantages and limitations. Reconstituting on whole chromosomes or large DNA fragments requires low levels of protein, otherwise precipitation occurs; therefore, what few nucleosomes do form will be highly attracted to the sequence upon which they form. Using shorter, sheared DNA can utilize higher protein levels and thus results in more extensive levels of nucleosome formation; however, as discussed above, the nucleosomes that form have an unusual propensity to form near the ends of the DNA fragments. While shearing DNA via sonication or ultra-sonication may have appeal due to the appearance of randomness (i.e., the acoustic energy being indiscriminate in the breaking of the phosphodiester bonds of the DNA), evidence suggests that it may not be as random as initially thought [18–24]. DNA sheared, or rather cut, by enzymatic digestion of specific DNA sequences may not be as popular as other methods, but the DNA ends can be determined with relative ease and accounted for in the downstream analyses if type II restriction enzymes are used. Finally, DNA that has been artificially synthesized is limited to the number of different molecules that are synthesized and may not adequately represent a genome that utilizes nucleosomes for chromatin formation. This last method is typically used for chromatin remodeling assays and frequently incorporates a nucleosome positioning sequence such as the Widom 601 sequence [25].
Nucleosome positioning is not random. The extent to which nucleosomes positioned in vivo due to ATP-dependent chromatin remodelers vs. positioning by DNA sequence is still debated. Positioning by DNA sequence can be measured by free energy, which is determined by intrinsic DNA features that form more stable nucleosomes based on the energy required to form a particular nucleosome. Chromatin remodelers, alternatively, can force or move nucleosomes onto DNA sequences that are much less favorable. Invitrosomes, in contrast, are positioned primarily by DNA sequence when chromatin remodelers are absent from the reaction.
Much research has been conducted to investigate how, and to what extent, nucleosome positioning occurs due to DNA sequence by examining trends in the underlying nucleosome DNA sequences. It has been found, both in vivo and in vitro, that the DNA surrounding the dyad (or midpoint of the nucleosome DNA) is rich in G/C nucleotides [26, 27], and G/C dinucleotides are overrepresented with a ~10 bp periodicity where the major groove of the DNA contacts the globular domain of the histone octamer [8, 27–32]. In contrast, the ends of nucleosomal DNA and regions flanking a nucleosome (linker DNA) are over represented in A/T nucleotides [8, 26, 33, 34], with a depletion of A/T nucleotides at the dyad [8, 27, 33], as well as an over representation of ~10 bp periodicity of A/T dinucleotides within the nucleosomal DNA [13, 25, 27, 28, 30–36] where the minor groove of the DNA contacts the globular domain of the histone octamer. Nucleosome depletion has been observed at promoters [13, 31, 34, 36–40], transcription termination regions [13, 34] (although this might be caused by proximity of termination sites to the promoter of downstream genes, as demonstrated in yeast [41]), certain short DNA tandem repeats and motifs [40, 42, 43], DNA replication origins [34, 44, 45], and Z-form DNA [46, 47]. Nucleosome enrichment has been observed at certain short DNA tandem repeats and motifs [40, 48–50].
It has been observed in vivo that nucleosome depletion occurs at homopolymeric stretches of A/T nucleotides [34, 40, 51, 52], transcription factor sites [36–38, 40], intergenic regions [34, 37, 52], 5’ UTRs [37], pseudoexons [53], strong mRNA splice sites [53], telomeres [34], and CpG islands [26, 54]. Nucleosome enrichment has been observed at exons [53, 55] and weak mRNA splice sites [53]. When comparing the underlying DNA sequences associated with nucleosomes, it has been shown that both enrichments and depletions between in vivo and in vitro datasets have a degree of positive correlation [8, 12, 13, 27]. However, some observed preferences may be species specific as demonstrated by differences between S. pombe and S. cerevisiae, such as enrichment of A/T nucleotides around the dyad and a depletion in A/T nucleotides near linker DNA in S. pombe compared to S. cerevisiae [56].
With these preferences/biases of nucleosomes known, two conclusions can be made. One, that there are rotational positioning biases (rotational biases), and two, that there are translational positioning biases (translational biases), with both types based on the underlying DNA sequence. The periodicity of G/C or A/T dinucleotides in nucleosomal sequences would be considered rotational biases [13]. Nucleosome depletion at Z-form DNA would be considered a translational bias, especially considering certain sequences are more prone to form Z-form DNA in vivo and in vitro [46, 47]. An additional type of translational bias that is not based on the underlying DNA sequence, the focus of this work, is end bias. And while other types of biases occur naturally in vivo, end bias is purely an experimental artifact. One research group observed that invitrosomes preferentially moved to the ends of linear DNA when exposed to elevated temperatures but tended to stay where they initially formed when kept on ice [10, 57]. Another group noticed a markedly higher percentage of invitrosomes that formed within 200 bp of known ends on linear DNA even when kept at cooler temperatures [8]. Finally, others saw that over 75% of invitrosomes were formed on the ends of their DNA fragments [9].
Here using previously published invitrosome data sets as well as our own invitrosome libraries, we answer the question of how extensive end bias is in in vitro nucleosome experiments. We use a high-throughput data analysis metric for evaluating end bias, followed by a computational method to identify and reassess potentially end biased invitrosomes. We also demonstrate that the effect of end bias on subsequent data analysis appears to be minimal, thus reassuring that conclusions from previous studies using in vitro nucleosome reconstitution to elucidate nucleosome DNA preferences were not skewed by end biases.
Materials and methods
Genome and libraries used for analysis
The C. elegans genome build WS190 was modified to replace the repetitive regions with “N” bases using the program RepeatMasker [58]. The WS190 version was chosen to be consistent with the build that was used for the Locke et al. analysis [8]. The four nucleosome sequence libraries used in this study were the 9.5 million read RsaI and 5.3 million read HincII libraries used in the Locke [8] analysis. These raw 36-bp single-end read libraries were trimmed to 25 bp before use to be the same read length as our other two libraries. A 25-bp single-end library of 8.0 million reads was generated in silico [59] (hereafter referred to as ART after the name of the program used to generate it) from the C. elegans genome. The ART program allowed us to simulate Illumina reads with the appropriate amount of sequencing errors an Illumina platform would have. The fourth and final library was a 25-bp single-end library of 20.3 million reads from invitrosomes assembled on ultra-sonicated C. elegans genomic DNA hereafter referred to US.
Ultra-sonicated invitrosome library prep
Ultra-sonicated C. elegans genomic DNA was prepared as previously described [8], except that whole genomic DNA was ultra-sonicated (Covaris M220) to an average size of 700 bp, run on an agarose gel, size selected for fragments between 600–800 bp, excised and extracted. Recombinant histone proteins were purified as described [7], and invitrosomes were reconstituted by salt dialysis at a 1:1 molar ratio of DNA and histone octamer as previously described [8]. Isolation of invitrosome core DNA fragments was as described [8], followed by Illumina library prep (Illumina TruSeq DNA Library Prep Kit) and 25-bp paired-end sequencing on an Illumina HiSeq 2500. For end bias analysis only the forward reads fastq file was used.
Library mapping and dyad calling
All libraries were mapped to the modified WS190 reference genome using Bowtie2 [60] on the Galaxy platform [61], with 7.8 million, 4.7 million, 8.5 million, and 18.7 million reads mapping from the ART, HincII, RsaI, and US libraries, respectively. Parameters for all programs used were set to default except as described in S1 Table. A bespoke Java program was used to calculate the location of all invitrosomes by computing the center or dyad of each invitrosome based on the end-sequence alignment and orientation. Invitrosome dyad positions were used to recover 147nt invitrosome sequences for k-mer analyses, whereas end-sequence alignment positions were used in end bias calculations.
Invitrosome positions and end bias calculations
We wanted to measure end bias in two different ways: first, by measuring the ratio of the raw reads on the end of DNA fragments compared to all aligned reads, and second, by calculating the invitrosome coverage on the ends of DNA fragments. For the first approach we wanted to be precisely specific and only measure when invitrosomes started (i.e., the first base of a read). Aligned BAM files were modified [62] so each read in the library retained only the genomic position of the first base of the mapped read. Thus, each read now represented only the start position of an invitrosome when we used these modified alignments. To measure the ratio of the raw reads on DNA fragment ends, a custom Python 3.6 program (see availability section) was used to determine if invitrosome start positions, as listed in the modified BAM files, were located on the fragment ends at position 1 up through position 73. These numbers were divided by total aligned start positions, and subsequently graphed. End bias could only be analyzed for the RsaI and HincII invitrosome libraries, as they are the only invitrosome libraries where the DNA fragments used in the reconstitution had defined ends.
For the second analysis, we used the bamCoverage tool in the deepTools2 [63] suite. In this analysis, occupancy and coverage are synonymous. Using the modified BAM files, bamCoverage calculated invitrosome start coverage by first normalizing to reads per kilobase million (RPKM) to help compensate for the differing sequencing depths of the different libraries. Then the program calculated coverage. A custom Python 3.6 program was used to retrieve start coverage values from bamCoverage output at fragment ends at position 1 up through position 73. Then a mean start coverage value was calculated across the entire 73 bp region. The start coverage value for each position was divided by the mean start coverage value, and then graphed.
Two of the libraries used were also used in Locke et al. [8]. The two libraries not from the Locke analysis used for this comparison were: the ART library, generated in silico [59] to represent a purely random non-nucleosome sample of reads from a complex genome, and the sonicated US library, an invitrosome library generated by nucleosome reconstitution using ultra-sonicated DNA to represent a “pseudo-random” DNA nucleosome library as described above. Additionally, the genomic locations of RsaI and HincII cutsites (i.e., fragment ends) had been previously generated by Locke et al. and then filtered to exclude any RsaI or HincII restriction fragments smaller than 147 bp long for these respective analyses.
Recovery method
The first step in our recovery approach was to use an additional custom Java program to extrapolate the location of each invitrosome by computing the center or dyad of each invitrosome based on the Bowtie2 alignment, calculate the invitrosome ends, and then separate invitrosomes into the categories of “suspect”, “passed”, and “innercut”. Suspect invitrosomes fall within the user-defined distance of cutsite (end) locations. Passed invitrosomes fall outside the user-defined distance of cutsite locations. Innercut reads represent invitrosomes that contain a cutsite within the nucleosomal DNA itself, which if the DNA were fully digested by the given restriction enzyme, would not be able to form invitrosomes.
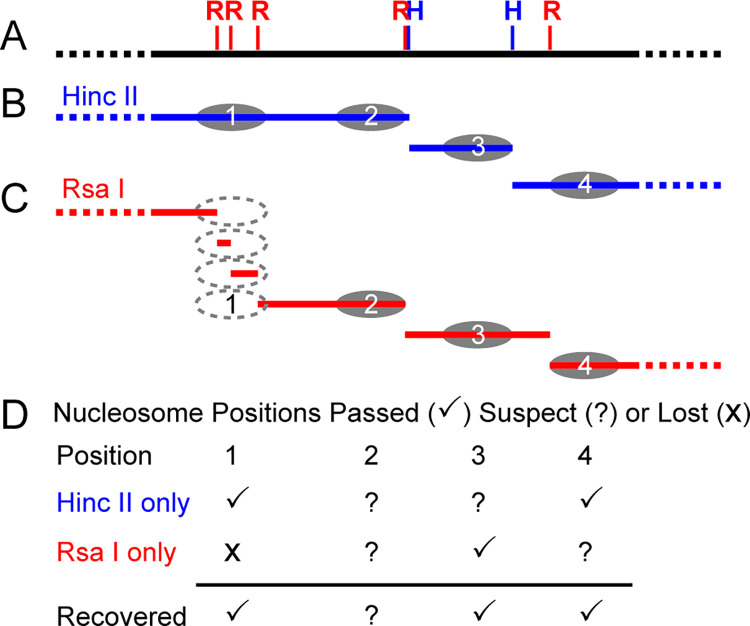
Next, suspect invitrosomes were recovered by comparison to the alternate experiment’s set of passed invitrosomes. Suspect RsaI invitrosomes were compared to passed HincII invitrosomes and innercut HincII invitrosomes. Reciprocally, suspect HincII invitrosomes were compared to passed RsaI invitrosomes and innercut RsaI invitrosomes. Suspect invitrosomes that sit at the same position as passed invitrosomes or innercut invitrosomes in the alternate library were re-classified as “recovered” or saved. A visual depiction of the initial classification and re-classification process can be seen in Fig 1. Invitrosomes that do not receive this new classification were considered biased invitrosomes. This resulted in a set of passed, recovered, biased, and innercut invitrosomes for each restriction enzyme library. Based on their classification, all invitrosomes were sorted into sub-libraries: Raw Library (passed + recovered + biased + innercut), Pre-Recovery (passed), and Post-Recovery (passed + recovered + innercut).
Fig 1. Visual depiction of the initial classification and re-classification method.
A) Represents a section of genomic DNA with RsaI and HincII cutsites. B) Representation of the initial fragments of genomic DNA (blue), digested with HincII and subsequent reconstituted nucleosomes. C) Representation of the initial fragments of genomic DNA (red), digested with RsaI and subsequent reconstituted nucleosomes. D) Invitrosome initial classification and subsequent re-classification when compared to the alternate library. A passed or non-suspect invitrosome from one dataset (such as HincII) can recover or save all suspect or lost invitrosomes in the same location in the other dataset (such as RsaI) as demonstrated by position 1 and position 4 nucleosomes.
Invitrosome nucleotide composition comparison
The DNA sequences from the four categories of invitrosomes (passed + recovered + biased + innercut) were used to calculate the nucleotide frequency of the underlying DNA sequences associated with each type of invitrosome. The same custom Java program used to find the invitrosome dyad, was used to pull out the invitrosome DNA sequence for each invitrosome in each category, and then calculate the rate of the various 4-mer combinations in the invitrosome DNA for each category in a position-based manner. Pearson and Spearman’s correlation coefficients were calculated for each 4-mer ratio in the RsaI or HincII libraries compared to the 4-mer ratios of the ART and US libraries at each position along the 147 base pairs of the invitrosome DNA.
Results and discussion
End bias occurs near the ends of DNA fragments
The propensity for in vitro reconstituted nucleosomes (invitrosomes) to favor formation on the end of DNA fragments has been observed by previous studies [9, 10]. These studies looking at end bias occurring in vitro, were based on low throughput data, did not quantify the amount of end biased nucleosome positioning, and did not analyze if this end bias affects down-stream analyses.
To confirm and quantify the end bias phenomenon we developed a novel method to calculate invitrosome occupancy at and around known DNA fragment ends. Using experimentally and in silico derived invitrosome libraries from the C. elegans genome, we quantified the number of invitrosomes that sit at the end of defined DNA fragments at base-pair resolution. We used four invitrosome libraries: two previously published [8] invitrosome libraries derived from C. elegans genomic DNA fragmented via enzymatic digestion (RsaI library, and HincII library), one invitrosome library derived from C. elegans genomic DNA fragmented via ultra-sonication (US library), and one library generated in silico [59] from the C. elegans genome (ART library). We aligned all four libraries to the C. elegans WS190 reference genome in which all repetitive elements had been masked with N’s.
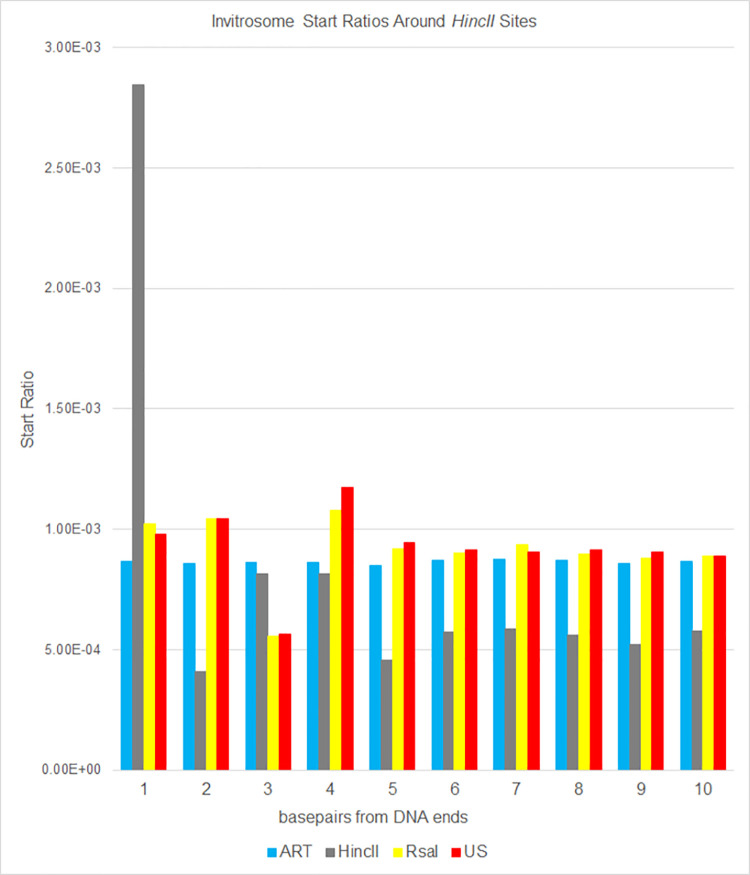
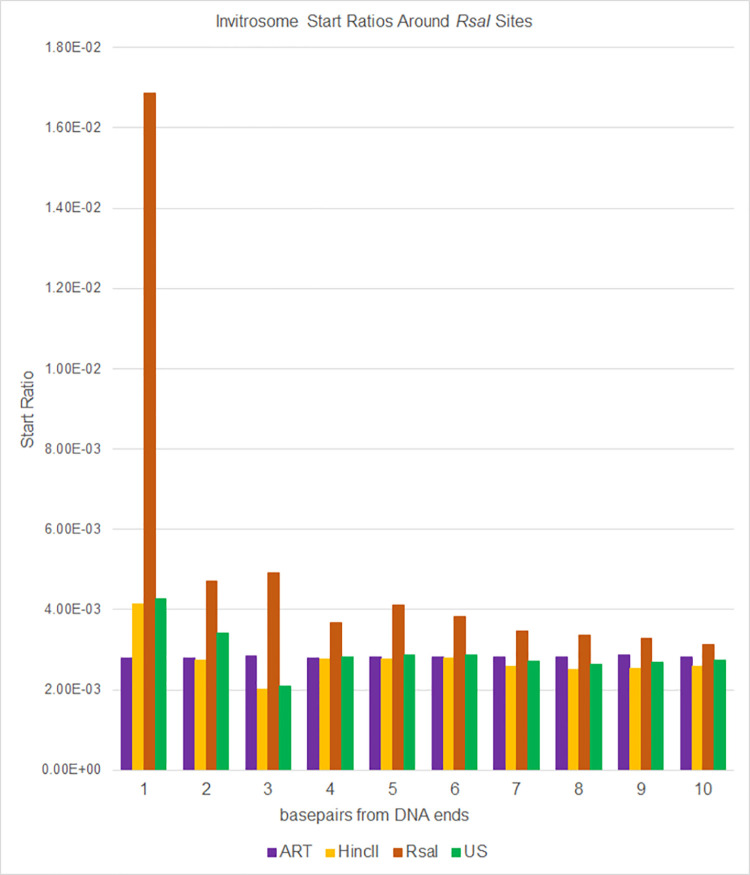
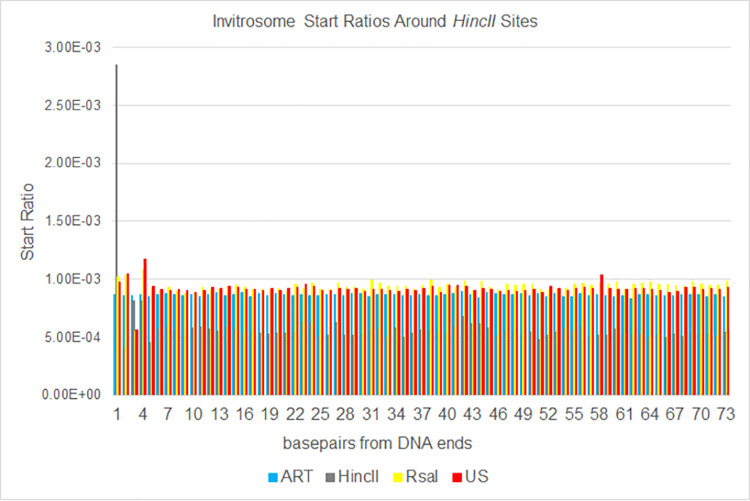
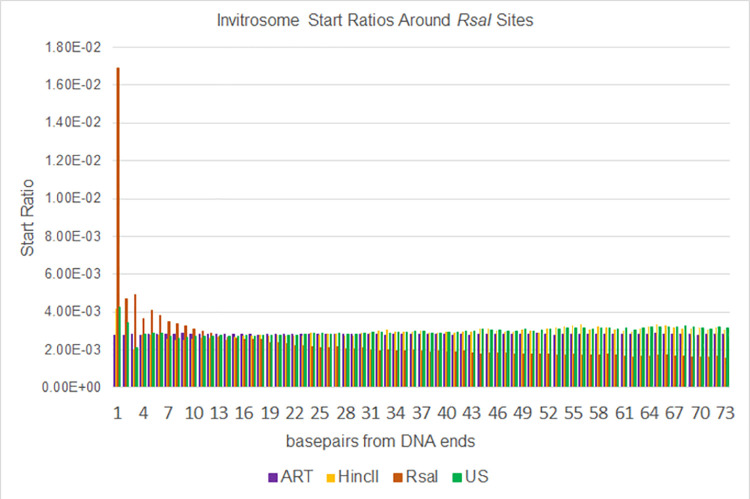
Next, we calculated invitrosome start ratios at each base pair from position 1 (the precise end of the DNA fragments) out to position 73 (half a nucleosome length) by taking the number of invitrosome starts at a given position divided by the total number of invitrosome starts across the whole genome. We then graphed these ratios out to 10 bp and out to 73 bp from the DNA fragment ends. The data show that there is an unusually high start ratio right on the end of the DNA (i.e., position 1), that quickly approaches a baseline value within a handful of base pairs in from the end (Figs 2 and 3). Aside from a handful of bases past position 1, the ratio typically fluctuates around a baseline for the entire distance out to 73 bp (Figs 4 and 5). Interestingly, there is a divergence when comparing HincII and RsaI data around their own respective cutsites. The HincII data have a pronounced dip at position 2, rises for positions 3 & 4, dips at position 5, and then appears to fluctuate around a baseline ratio. The RsaI has a dip at position 2, rises at position 3, dips at position 4, rises at position 5, and then appears to approach an asymptote ratio. These differences could be explained by either the different sequencing depths of the libraries, or by the different cutsite sequences and restriction site lengths, or both. However, the very high ratio values at position 1 and the higher-than-average ratio values near the ends suggest that invitrosomes tend to form on or near fragment ends. This is further supported by analysis of the RsaI dataset using HincII cutsites and the HincII dataset using RsaI cutsites (reciprocal enzyme control), which both showed no such increased ratio at position 1. It is important to note that the ART values did not fluctuate much. Also, US values did not fluctuate much unless there was also a similar pattern in the HincII and/or RsaI reciprocal enzyme control values, possibly indicating that these positions contain very moderate invitrosome positioning or repelling sequence motifs in the DNA.
Fig 2. Ratios of invitrosome starts around HincII restriction sites in the genome.
Ratios were calculated by taking all invitrosome starts at a given position and dividing that number by all invitrosome starts across the genome for each of the four invitrosome data sets (ART, HincII, RsaI and US) individually. Positions 1 through 10 on the x-axis are relative to HincII cut sites across the genome.
Fig 3. Ratios of invitrosome starts around RsaI restriction sites in the genome.
Ratios were calculated by taking all invitrosome starts at a given position and dividing that number by all invitrosome starts across the genome for each of the four invitrosome data sets (ART, HincII, RsaI and US) individually. Positions 1 through 10 on the x-axis are relative to RsaI cut sites across the genome.
Fig 4. Expanded Fig 2.
The same data as shown in Fig 2 expanded out to 73 bases from genomic HincII cut sites.
Fig 5. Expanded Fig 3.
The same data as shown in Fig 3 expanded out to 73 bases from genomic RsaI cut sites.
Seguin-Orlando et al. [24] investigated whether or not the methodology of Illumina sequencing introduced biases into high throughput sequencing data. They observed that the ends of fragmented DNA that was Illumina sequenced showed a depletion of thymine bases by ~11% and a parallel enrichment of adenine and guanine bases. Of note, the aforementioned enriched bases are present on the ends of RsaI and HincII digested DNA; however, we conclude that this sequencing bias is not the major contributor to the nucleosome enrichment we see on the very ends of DNA fragments. This is due mainly to the magnitude off the enrichment we observe. HincII digested DNA ends could begin with adenine or guanine on the 5’ end; and we observe an invitrosome enrichment of 278% at HincII DNA sites in our HincII data when compared to the next highest library value at position 1 in Figs 2 and 4. RsaI digested DNA 5’ ends begin with adenine; and we observe an enrichment of 396% when compared to the next highest library at position 1 in Figs 3 and 5. Thus our observed invitrosome enrichment on the ends of RsaI-and HincII- digested DNA is more than an order of magnitude greater than what could be explained by Illumina sequencing bias. Additionally, the much larger percent enrichment of invitrosomes for the RsaI library at position 1 compared to HincII library is likely due to the different recognition sites of the two enzymes. RsaI recognition sites are 4 bp, whereas HincII recognition sites are 6 bp. As such, RsaI sites occur more frequently in the genome, and digestion generates more DNA ends; thus, the availability of DNA ends is greater and provides more opportunity for preferential nucleosome formation on DNA ends with RsaI digested DNA when compared to HincII.
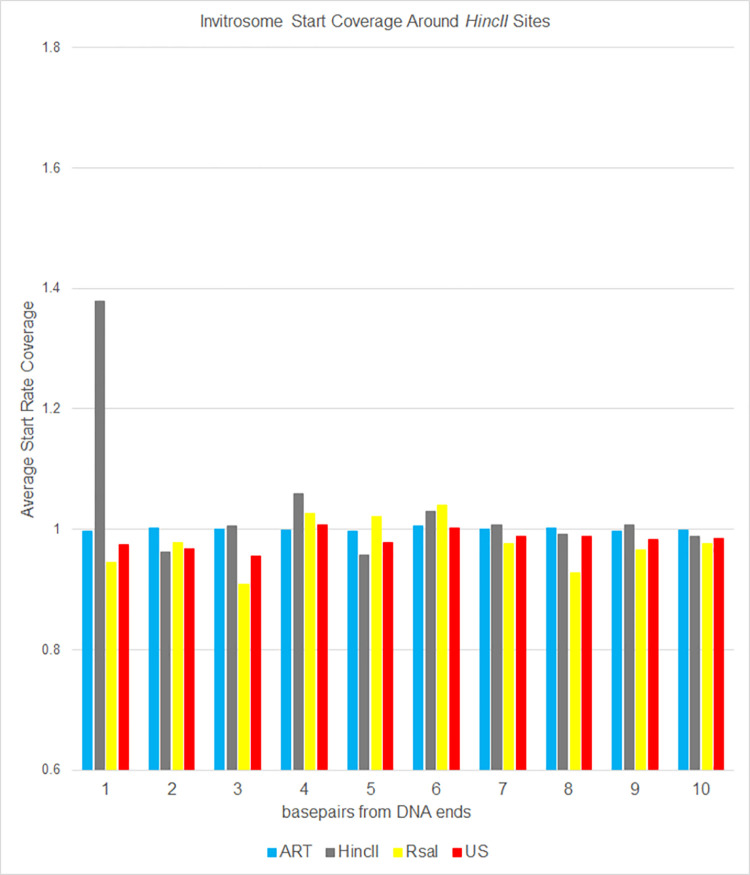
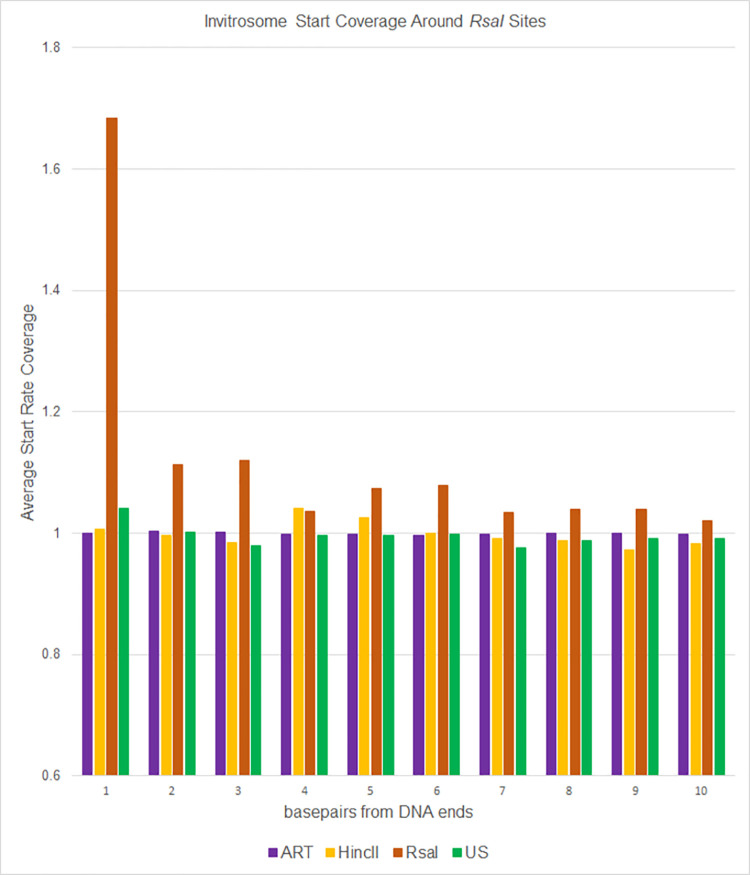
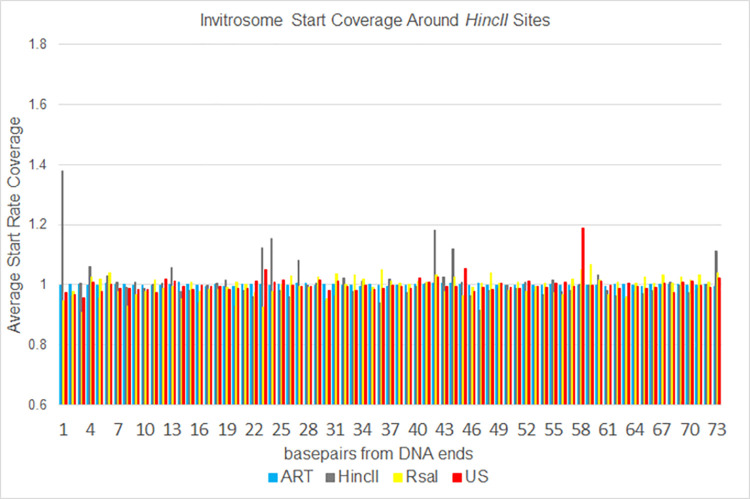
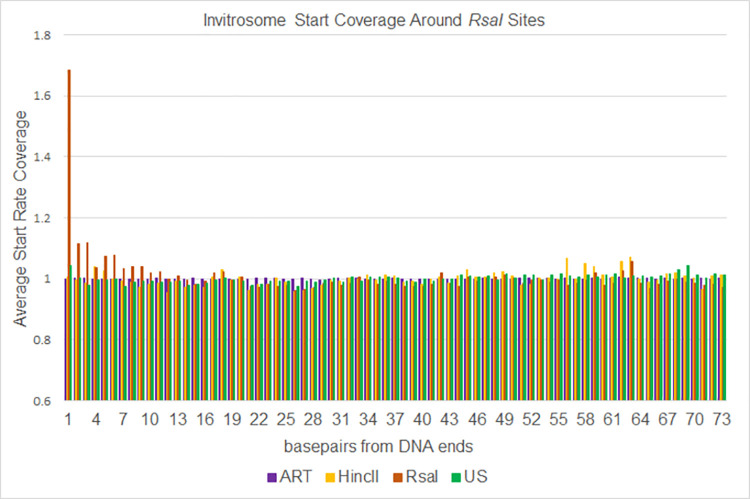
To analyze the data a different way, we calculated invitrosome start coverage values for the same libraries, starting at position 1 out to position 73 using bamCoverage from the deepTools2 [63] suite. We calculated a mean coverage, and then took the coverage of each position divided by the mean coverage and graphed them out to 10 bp and out to 73 bp. We saw in the RsaI and HincII datasets an unusually high occupancy value at the first position around their own respective cutsites, that quickly approached a value of 1 within a few positions of moving in from the end (Figs 6 and 7). The values fluctuated around 1 for the remaining length of the 73 bp (Figs 8 and 9). It is important to note that the other libraries, such as ART and US, had values around 1 beginning at the first position regardless of which cut site was used for the analysis, demonstrating that end bias is indeed due to the physical ends of DNA fragments and not due to positioning signals in the C. elegans genome around those cutsites. Also, analysis of the RsaI dataset using HincII cutsites and the HincII dataset using RsaI cutsites both resulted in values around 1 at position 1, further confirming this conclusion. From both sets of analyses, we found that end bias accounts for anywhere from, at the low end, a 40% increase, to at the high end, up to a 300% increase in invitrosome formation at the end of DNA fragments.
Fig 6. HincII occupancy of positions.
Average occupancy (or coverage) of invitrosome starts around HincII restriction sites in the genome for each of the four invitrosome data sets (ART, HincII, RsaI and US). Positions 1 through 10 on the x-axis are relative to HincII cut sites across the genome. A value of 1 indicates occupancy at an average rate across the genome. Higher than 1 indicates above average occupancy.
Fig 7. RsaI occupancy of positions.
Average occupancy (or coverage) of invitrosome starts around RsaI restriction sites in the genome for each of the four invitrosome data sets (ART, HincII, RsaI and US). Positions 1 through 10 on the x-axis are relative to RsaI cut sites across the genome. A value of 1 indicates occupancy at an average rate across the genome. Higher than 1 indicates above average occupancy.
Fig 8. Expanded Fig 6.
The same data as shown in Fig 6 expanded out to 73 bases from genomic HincII cut sites.
Fig 9. Expanded Fig 7.
The same data as shown in Fig 7 expanded out to 73 bases from genomic RsaI cut sites.
We were curious as to what might explain this end bias phenomenon. Based on the simulations of Sakaue et al. [9] nucleosomes would form on the end due to steric hindrance of two DNA helices at both DNA entry/exit sites. Forming exactly on the end of DNA would only produce one DNA helix at the DNA entry/exit sites, thereby reducing steric hindrance. They followed their simulations with their own invitrosome experiments and visualized the invitrosomes on the ends of their DNA at a rate of near 100 percent. However, we think their hypothesis of the cause of end bias unlikely. Firstly, the researchers never mention what sort of DNA they use for their reconstitutions. It is unknown whether it was PCR amplified DNAs, fragmented genomic DNA, or linearized plasmid. Research has demonstrated that the specific DNA sequence is extremely important, especially in vitro. Their results could have been substantially influenced by their choice of DNA. Secondly, when assembling invitrosomes, the H3/H4 tetramer binds the DNA first, followed by the first H2A/H2B dimer, followed by the second dimer [64]. The tetramer would have to “sense” in some way when interacting with the DNA that the fully formed invitrosome would not have the steric hindrance of two helices. Finally, their simulations used tailless histones, which do not represent the majority of invitrosomes. While steric hindrance may be a problem for tailless nucleosomes, histone tails interact with linker DNA and “pull” it in to form a tighter nucleosome [65], potentially eliminating or reducing such hindrance.
There are a few other alternatives. First, there could be some slight invitrosome shifting laterally along the DNA once it is formed. Potentially that could eliminate the steric hindrance of two DNA helices. Secondly, there might be some torsional strain forced onto the DNA as the invitrosome forms that is quickly relieved when the invitrosome happens to be near the end of the DNA, thus lowering the free energy of formation. Analysis of the crystal structure of nucleosomes has revealed unique perturbations in the DNA’s path around the nucleosome not seen in other DNA binding proteins [66]. It is plausible that perturbations, such as excessive DNA curvature and alternating DNA forms, could induce torsional strain. Since there are not areas of reduced invitrosome occupancy across the DNA that we could detect in this study, we think that if torsional strain is the cause, the torsional strain is minimal and that there is only slightly more favorable free energy at the end of the DNA fragment that quickly reaches a baseline free energy level moving towards the DNA fragment center. Lastly, end bias could be a result of the experimental procedure. Invitrosome formation requires high salt levels at the beginning to balance out the negative charge of the DNA and positive charge of the protein. Ions are slowly reduced, and the DNA and histone proteins come together. Perhaps the DNA ends allow tetramer or dimer binding at a slightly higher ion concentration than the center of the DNA does.
Comparative analysis allows the recovery of suspect invitrosome reads
Having demonstrated that invitrosomes form on DNA fragment ends up to four times as frequently as they would normally form due to simply DNA sequence favorability, we wanted to be able to distinguish between invitrosomes formed due to end bias versus invitrosomes formed on the ends of DNA fragments due to DNA sequence preference. To this end we devised a method to accomplish this based on the use of the two defined-end invitrosome libraries used above (RsaI and HincII).
Currently using conventional approaches, two classes of DNA loci are typically excluded from invitrosome analyses or have invitrosomes discarded in order to eliminate potential end bias. When DNA fragment ends are defined, 1) any invitrosome found to map within a defined number of nucleotides from a DNA fragment end is classified as suspect of end bias and is discarded. 2) DNA fragments digested to sizes too small for reconstitution (<147 bp) are lost from invitrosome analyses (Fig 1).
We hypothesized that both of these classes of excluded loci can potentially be recovered and analyzed by performing nucleosome reconstitutions on two DNA samples digested by two different restriction endonucleases. Each individually-digested DNA sample is used for separate nucleosome reconstitutions and then invitrosome positions from the two libraries are identified by mapping sequenced mononucleosome core DNAs back to the original source of DNA. For each individual library, invitrosomes that may suffer from end bias can be identified by defining a specific number of bases from cutsites (DNA fragment ends) as “too close” to the end of the DNA fragment (the suspect range). Invitrosomes that map and start within suspect-range regions are considered theoretically subject to end bias and so are defined as “suspect” invitrosomes. Invitrosomes that do not fall within the suspect-range regions are assumed to not be affected by end bias and are classified as “passed” nucleosomes.
The restriction sites of the two restriction endonucleases used will usually not be near one another on the DNA. Therefore, invitrosomes from one library that are defined as suspect and normally would be discarded (due to proximity to a DNA fragment end) can be recovered if the same locus is found to be occupied by a “passed” invitrosome in the second library. This is demonstrated in Fig 1 with the example invitrosomes in position 3 and position 4. In contrast, in Fig 1, invitrosomes in position 2 remain in doubt as this position is near a DNA fragment end in both experiments and both invitrosomes are “suspect”.
Additionally, the positions where DNA fragments were generated that were too small to participate in reconstitution can be recovered; as the likelihood of this happening with both endonuclease digestions is small; a position lost in one experiment can be recovered if in the second experiment the fragment is of sufficient size to form a “passed” invitrosome (e.g., Fig 1 position 1).
We applied this recovery method to the invitrosome libraries generated using the C. elegans genome described in Locke et al. which were reconstituted on DNA that was digested with the RsaI or the HincII restriction enzymes. Our recovery approach is composed of three steps. 1) a suspect range is generated based on a user-defined variable, 2) invitrosomes are mapped and declared either passed or suspect, and 3) suspect invitrosomes are recovered by comparison to the alternate experiment’s set of passed invitrosomes. In applying the first step, generation of suspect-range regions is dependent on knowing precise fragment ends produced by restriction enzyme digestion. Because two different restriction endonucleases are used, the loci that fall into the suspect-range regions will be different for the two experiments and will depend on the restriction endonuclease used to prepare the template DNA for reconstitution. We used the fragment-end list generated by Locke et al. to define the beginning and end of DNA fragments based on the presence of either a RsaI or a HincII cut site. This list contains the start, end and fragment size of all hypothetical fragments generated across all chromosomes by digestion with these enzymes [8]. In the Locke analysis the suspect range was defined as 200 bp from a DNA fragment start and 200 bp from the fragment end, a total range of 400 bp per DNA fragment. We used the same 200-bp suspect range to be consistent with the results of the Locke analysis. To generate each suspect-range region, the genomic position of each DNA-fragment start or DNA-fragment end (excluding the palindromic restriction enzyme cut site) had the suspect range-defined number of base pairs added to or subtracted from it respectively, producing suspect-range-defined starts or ends. This resulted in unique sets of suspect-range regions across the genome for each restriction enzyme.
We applied the second step of our approach by mapping all the invitrosome sequence reads from both experiments to the WS190 version of the C. elegans genome. After mapping the sequence reads, each read was extended out to 147 bp to represent the entire footprint of the invitrosome from which it was derived, and the direct center, or dyad position, was recorded to produce sets of both HincII-invitrosome dyads and RsaI-invitrosome dyads. During analysis, 73 bp was added and subtracted from the dyad to produce start and end positions for both sets. Start and end positions were then compared to their respective suspect-range regions. Depending on where each invitrosome end fell relative to the suspect-range regions (within the suspect range or outside of the suspect range), it was defined as either “suspect” or “passed” respectively. Any invitrosome with a start that fell into suspect-range start region or any invitrosome with an end that fell into a suspect-range end region was defined as “suspect.” Passed invitrosomes were separated from suspect invitrosomes and kept as unbiased data for each experiment. Putative underdigested DNA fragments which had invitrosome reads that tiled over cut sites were also considered passed but kept separate for statistical purposes (InnerCutSite). For each experiment the suspect-range size was kept the same between the RsaI and the HincII datasets. This resulted in six invitrosome sets from the two experiments: passed-RsaI invitrosomes, suspect-RsaI invitrosomes, InnerCutSite-RsaI invitrosomes, passed-HincII invitrosomes, suspect-HincII invitrosomes, and InnerCutSite-HincII invitrosomes.
The final step was to recover suspect invitrosomes from one experiment and reclassify them as free of end bias through comparison with passed invitrosome reads from the alternate experiment. Suspect-RsaI invitrosomes were compared to passed-HincII invitrosomes and InnerCutSite-HincII invitrosomes, while suspect-HincII invitrosomes were compared to passed-RsaI invitrosomes and InnerCutSite-RsaI invitrosomes. Suspect invitrosomes that start at the same position as passed invitrosomes from the alternative fragment set were now reclassified as “recovered” invitrosomes. Those that did not receive this new classification are considered to be potentially affected by end bias and were reclassified as “biased” invitrosomes. The final result is a set of recovered and biased invitrosomes for each library. The results generated by the entire workflow were eight unique output files: passed-RsaI invitrosomes, InnerCutSite-RsaI invitrosomes, recovered-RsaI invitrosomes, biased-RsaI invitrosomes, passed-HincII invitrosomes, InnerCutSite-HincII invitrosomes, recovered-HincII invitrosomes, and biased-HincII invitrosomes. The complete workflow is shown in Fig 10.
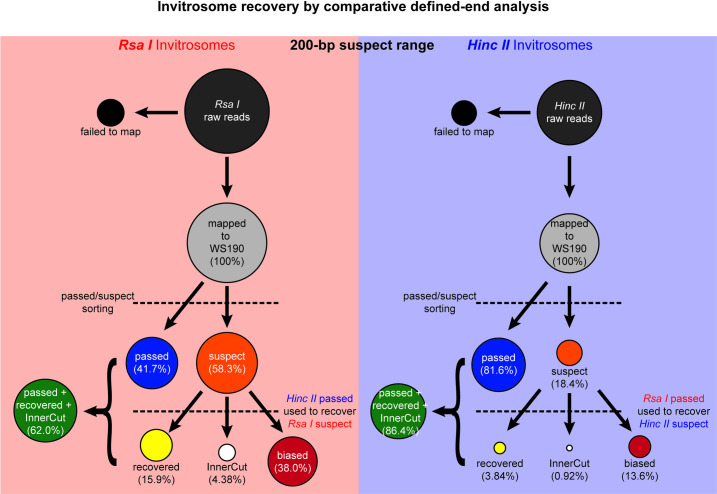
Fig 10. Reads suspected, recovered, and tossed at 200 bp.
Overview of the recovery method to “rescue” invitrosomes suspected of end bias. Depiction of the percentages of reads, and by extension invitrosomes, during the classification and re-classification method. Invitrosomes too close to DNA fragment ends (in this case within 200 base pairs) were deemed suspect to formation on fragment ends due to end bias. Invitrosomes outside of 200 base pairs from DNA ends were deemed as passed; while invitrosomes containing a cutsite for the respective restriction enzyme within the nucleosomal DNA would normally be discarded are recovered. Using the alternate library’s passed invitrosomes, suspect invitrosomes were re-classified as recovered if a passed invitrosome from the other library could be found at the same position as the suspect invitrosome. The comparative analysis increases the sequencing data available for downstream analysis.
Recovery of RsaI and HincII invitrosomes
The mapped RsaI dataset contained a total of 8,463,490 invitrosomes. Using our 200-bp suspect range; 4,933,904 or 58.3% of the mapped RsaI invitrosomes were declared suspect (Table 1 and Fig 10). Without our recovery method these suspect invitrosomes would be lost to further analysis.
Table 1. Reads before and after recovery.
| HincII | RsaI | |||||
| Total Reads | 5,537,994 | 9,489,038 | ||||
| Mapped Reads | 4,653,842 | 8,463,490 | ||||
| 84%* | 89.2%* | |||||
| 200 bp | 11 bp | 1 bp | ||||
| HincII | RsaI | HincII | RsaI | HincII | RsaI | |
| Passed | 3,799,051 | 3,529,586 | 4,531,053 | 7,227,702 | 4,582,097 | 7,725,507 |
| 81.6% | 41.7% | 97.4% | 85.4% | 98.5% | 91.3% | |
| All Suspect | 854,791 | 4,933,904 | 122,789 | 1,235,770 | 71,745 | 737,983 |
| 18.4% | 58.3% | 2.6% | 14.6% | 1.5% | 8.7% | |
| Inner Cut Site | 43,111 | 370,753 | 43,111 | 370,753 | 43,111 | 370,753 |
| 0.9% | 4.4% | 0.9% | 4.4% | 0.9% | 4.4% | |
| Recovered | 178,865 | 1,348,245 | 38,484 | 291,526 | 14,757 | 120,562 |
| 3.8% | 15.9% | 0.8% | 3.4% | 0.3% | 1.4% | |
| Total Recovered | 221,976 | 1,718,998 | 81,595 | 662,279 | 57,868 | 491,315 |
| 4.8% | 20.3% | 1.8% | 7.8% | 1.2% | 5.8% | |
| Remaining suspect | 632,815 | 3,214,906 | 41,194 | 573,491 | 13,877 | 246,668 |
| 13.6% | 38.0% | 0.9% | 6.8% | 0.3% | 2.9% | |
| Post Recovery | 4,021,027 | 5,248,584 | 4,612,648 | 7,889,981 | 4,639,965 | 8,216,822 |
| 86.4% | 62.0% | 99.1% | 93.2% | 99.7% | 97.1% | |
Absolute counts and percentages of reads before and after the recovery program.
* Represent percentages taken from Total Reads. All other percentages are taken from Mapped Reads.
In order to recover suspect-RsaI invitrosomes we compared these invitrosomes to the passed-HincII invitrosomes that were analyzed at the HincII 200-bp suspect range. As described above, any suspect-RsaI invitrosome that shared the same position with a passed-HincII invitrosome was assumed to be an invitrosome that formed at that particular locus due to preferable DNA sequence rather than end-position bias and was declared recovered. This comparison resulted in 1,348,245 (15.9%) of the suspect-RsaI invitrosomes being reclassified as recovered through comparison, and 370,753 (4.4%) invitrosomes being reclassified as formed on underdigested DNA and recovered (InnerCutSite). Thus using our recovery method we recovered 20.3% of the suspect-RsaI invitrosomes resulting in a total of 5,248,584 passed- or recovered-RsaI invitrosomes, or 62.0% of the original mapped invitrosome set. This left 3,214,906 suspect invitrosomes that were reclassified as biased and unusable, which is 38.0% of the original RsaI mapped invitrosome set after processing, instead of the 58.3% that would be unusable without our recovery procedure (Fig 10).
The same analysis was performed on the 4,653,842 mapped HincII invitrosomes, with recovery analysis being performed with the passed-RsaI invitrosomes that were analyzed at the RsaI 200-bp suspect range. At the suspect range of 200 bp; 854,791 (18.4%) of the HincII invitrosomes were declared suspect (Fig 10). Using the passed-RsaI invitrosomes, 178,865 (3.8%) suspect-HincII invitrosomes were recovered through comparison and 43,111 (0.9%) suspect-HincII invitrosomes were recovered through underdigested recovery. The remaining 632,815 (13.6%) suspect-HincII invitrosomes were labeled as biased. Thus using our recovery method we recouped 20.9% of the suspect-HincII invitrosomes through comparison and 5.0% of the suspect-HincII invitrosomes through underdigested recovery, for a total of 26.0% of the biased reads recovered. A total of 4,021,027 (86.4%) passed- or recovered-HincII invitrosomes, of the original invitrosome set (Fig 10) were usable after our recovery approach. The remaining 632,815 biased invitrosomes represent 13.6% of the original mapped HincII invitrosome set that was still unusable (Fig 10). Despite the more modest size of this recovery, it still represents a substantial improvement over the 18.4% that would be unusable without our recovery procedure.
Varying the suspect range length
We wanted to test the effect of varying lengths of suspect ranges on the number of invitrosomes declared suspect and recovered by our approach. To this end, we applied two more suspect ranges: 1 bp and 11 bp (one helical turn of DNA). We compared the results of applying these additional two suspect ranges to the results from our 200-bp suspect range. As expected, with decreased suspect range size we see a decrease in the number of suspect invitrosomes. Specifically, we see the number of suspect invitrosomes decrease in relation to the length of the suspect range, with the lowest suspect range of a single base pair resulting in a low of only 737,983 (8.7%) of the RsaI and 71,745 (1.5%) of the HincII invitrosomes being declared suspect (S1 and S2 Figs and Table 1). It is interesting to note that for RsaI invitrosomes, at the larger suspect range of 200 bp, the number of suspect invitrosomes is actually greater than the number of passed invitrosomes. This is not the case for the HincII invitrosomes. This is due to the frequency of the restriction sites occurring in the genome. On average, RsaI sites occur every 490 base pairs and HincII sites would occur every 2109 base pairs [8]. Using a 200-bp suspect range would render an alarming 81.6% and 19.0% of the genome suspect for RsaI and HincII, respectively.
The 11-bp suspect range is of particular interest as it represents one full turn of the DNA helix. If invitrosomes were to be affected by end bias, but still try and retain a preferential rotational setting, it might be predicted that they would form between 1–11 bp from the end of the DNA fragment as this would cover all potential rotational settings. Interestingly, previous studies have demonstrated that virtually all end-effect nucleosome positioning results in invitrosomes within about ±10 bp of the fragment end [10]. At the 11-bp suspect range 1,235,770 (14.6%) of mapped RsaI invitrosomes are suspect and 122,789 (2.6%) of mapped HincII invitrosomes are suspect (S1 Fig). At this same level, 662,279 (53.6%) of the suspect-RsaI are recovered, with 291,526 saved through comparison and 370,753 saved through underdigested comparison (S1 Fig). 81,595 (66.5%) of suspect-HincII invitrosomes are recovered, with 38,484 through comparison and 43,111 through underdigested comparison (S1 Fig and Table 1).
Having applied our approach, we find that a substantial number of suspect invitrosomes can be recovered within the RsaI invitrosome set no matter what size the suspect range is. Within the maximum 200-bp suspect range we find that our approach is able to recover 34.8% or 1,718,998 of the suspect-RsaI invitrosomes. However, with the smaller 11-bp suspect range, we are able to recover 53.6% or 662,279 of the suspect-RsaI invitrosomes.
End bias does not significantly skew 4-mer results
Often one of the major goals of invitrosome experiments is to identify and analyze the DNA sequence preferences that guide nucleosome positioning in vitro and compare that with such DNA signals in vivo. Having demonstrated substantial end bias in invitrosome experiments, we wanted to see what effect end bias has on the DNA sequences that are seen in invitrosomes. With our recovery method, we were able to compare invitrosome DNA sequences (specifically k-mer usage) from total data sets, non-suspect data sets and post recovery data sets.
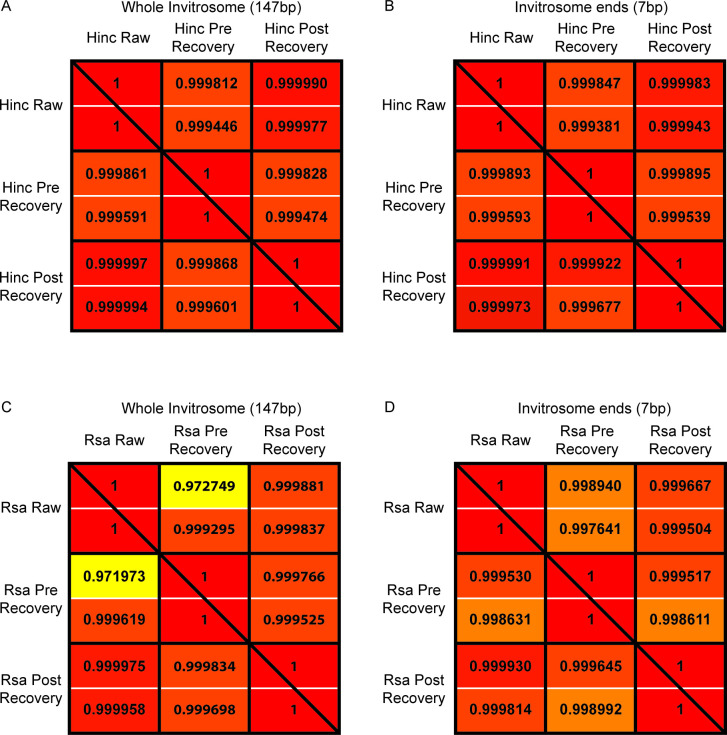
With our libraries mapped to the reference genome, we extrapolated out the DNA sequences of the invitrosomes and calculated the frequency of 4-mers for each library in a position dependent manner across the invitrosome DNA cores. We then took the rate of the various 4-mer usages and measured the differences between the libraries using two different correlation methods. Correlation values were calculated between the enzyme libraries (RsaI and HincII) and the non-enzyme libraries (ART and US), utilizing both the Pearson and Spearman correlation methods. We first asked if 4-mer frequency was different across the entire 147 base pairs of nucleosomal DNA, comparing the data from the raw libraries to that of the libraries at each recovery step. We did this for both suspect regions of 1 bp or 11 bp from the end (Table 2). Our previous analyses demonstrated that end bias is only seen within the first few bases of DNA fragment ends, thus we did not do similar correlations with the 200-bp suspect region data. Regardless of which correlation method was used, correlation values between each enzyme library compared to the non-enzyme libraries at each step of the recovery process (i.e., each sub-library) differed by a trivial amount. Wondering if differences were being hidden based on the amount of data in the correlation calculations due to using all 147 base pairs of the invitrosome cores, we narrowed our analysis to the 7 positions on either end of the invitrosome DNA (where we would expect to find end biased invitrosomes), functionally reducing the amount of data down an order of magnitude. Again, regardless of which correlation method was used, the differences were trivial (Table 3). Additionally, we calculated the correlations between the individual sub-libraries within the RsaI or HincII libraries at each step of the recovery process. As expected, both correlation methods showed even less difference between the various sub-libraries with all correlations being above 0.97 (Fig 11). Considering there is little relevant change in the correlation values between the various classifications of invitrosomes, regardless of the correlation method used, we conclude that any changes in the 4-mer composition from invitrosome end bias is negligible.
Table 2. Correlations of known ends to unknown end libraries.
| 1 bp Suspect Ends | Pearson | Spearman | ||||
| ART | US | ART | US | |||
| Hinc Raw Reads | 0.8647 | 0.9386 | Hinc Raw Reads | 0.7861 | 0.8900 | |
| Hinc Passed | 0.8640 | 0.9381 | Hinc Passed | 0.7845 | 0.8891 | |
| Hinc Post Recovery | 0.8647 | 0.9385 | Hinc Post Recovery | 0.7859 | 0.8898 | |
| Rsa Raw Reads | 0.9017 | 0.9672 | Rsa Raw Reads | 0.8902 | 0.9527 | |
| Rsa Passed | 0.9000 | 0.9657 | Rsa Passed | 0.8878 | 0.9506 | |
| Rsa Post Recovery | 0.9013 | 0.9668 | Rsa Post Recovery | 0.8895 | 0.9522 | |
| 11 bp Suspect Ends | Pearson | Spearman | ||||
| ART | US | ART | US | |||
| Hinc Raw Reads | 0.8647 | 0.9386 | Hinc Raw Reads | 0.7861 | 0.8900 | |
| Hinc Passed | 0.8645 | 0.9382 | Hinc Passed | 0.7841 | 0.8887 | |
| Hinc Post Recovery | 0.8645 | 0.9382 | Hinc Post Recovery | 0.7852 | 0.8893 | |
| Rsa Raw Reads | 0.9017 | 0.9672 | Rsa Raw Reads | 0.8902 | 0.9527 | |
| Rsa Passed | 0.9012 | 0.9664 | Rsa Passed | 0.8882 | 0.9512 | |
| Rsa Post Recovery | 0.9001 | 0.9666 | Rsa Post Recovery | 0.8872 | 0.9516 | |
Correlation values for 4-mer frequencies across all positions of nucleosomal DNA for two different suspect region lengths. There are very small differences between the Raw aligned, Non-suspect or passed, and Post Recovery reads when compared to the ART dataset and US dataset.
Table 3. Correlations of known ends to unknown end libraries.
| 1 bp Suspect Ends | Pearson | Spearman | ||||
| ART | US | ART | US | |||
| Hinc Raw Reads | 0.8450 | 0.8651 | Hinc Raw Reads | 0.6787 | 0.7550 | |
| Hinc Passed | 0.8449 | 0.8647 | Hinc Passed | 0.6778 | 0.7541 | |
| Hinc Post Recovery | 0.8449 | 0.8648 | Hinc Post Recovery | 0.6785 | 0.7544 | |
| Rsa Raw Reads | 0.9106 | 0.8981 | Rsa Raw Reads | 0.8227 | 0.8168 | |
| Rsa Passed | 0.9093 | 0.8965 | Rsa Passed | 0.8174 | 0.8131 | |
| Rsa Post Recovery | 0.9097 | 0.8973 | Rsa Post Recovery | 0.8214 | 0.8155 | |
| 11 bp Suspect Ends | Pearson | Spearman | ||||
| ART | US | ART | US | |||
| Hinc Raw Reads | 0.8450 | 0.8651 | Hinc Raw Reads | 0.6613 | 0.7395 | |
| Hinc Passed | 0.8443 | 0.8643 | Hinc Passed | 0.6592 | 0.7380 | |
| Hinc Post Recovery | 0.8444 | 0.8646 | Hinc Post Recovery | 0.6602 | 0.7386 | |
| Rsa Raw Reads | 0.9106 | 0.8981 | Rsa Raw Reads | 0.8118 | 0.8034 | |
| Rsa Passed | 0.9116 | 0.9000 | Rsa Passed | 0.8097 | 0.8069 | |
| Rsa Post Recovery | 0.9100 | 0.8998 | Rsa Post Recovery | 0.8095 | 0.8066 | |
Correlation values of 4-mer frequencies for the 7 positions from both ends of nucleosomal DNA for two different suspect regions lengths. There are very small differences between the Raw aligned, Non-suspect or passed, and Post Recovery reads when compared to the ART dataset and US dataset.
Fig 11. Correlations within sub-libraries.
Correlation between k-mers at each step of recovery. Correlation values for k-mer usage from the HincII data are shown in panels A) and B). Correlation values for k-mer usage from the RsaI data are shown in panels C) and D). In all panels, within each black box, the Pearson correlation value is listed above, and the Spearman correlation value is listed below the white line. Correlation values in the bottom-left-triangle half of the entire panel are between sub-libraries with a 1-bp suspect range, and values in the top-right-triangle half are between sub-libraries with a 11-bp suspect range. Panels A) and C) are k-mer usage correlation values calculated across the entire 147-bp invitrosome DNA, while panels B) and D) are k-mer correlation values looking at k-mer usage only at the ends of invitrosome DNA.
End bias does not affect further down-stream analysis
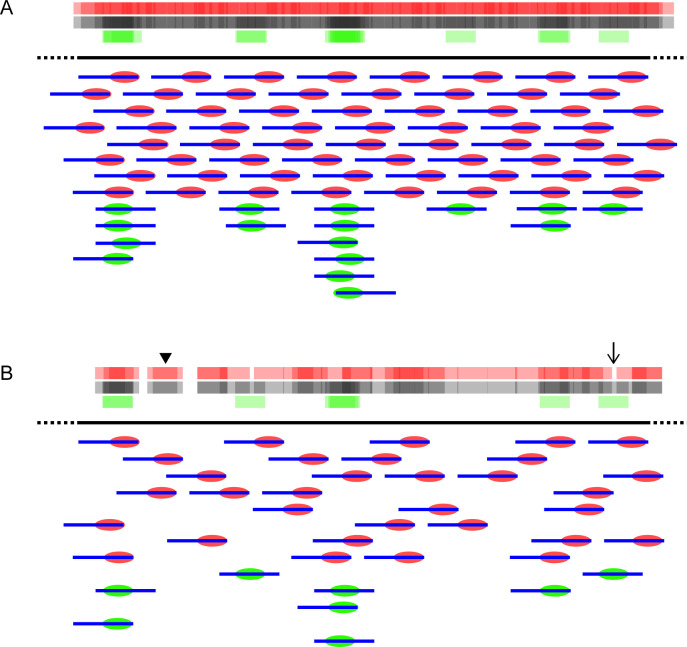
Three things are important to note in addition to the conclusions from our analyses. First, that in the Locke et al. analysis, they failed to see a significant difference in invitrosome occupancy on gene elements, such as exons and introns, when they discarded potentially biased data. This adds further to the claim that while end bias exists, it does not alter data interpretation. Second, sequencing depth could also play a role in any observed bias (Fig 12). With adequate sequencing depth, any bias could be “drowned out”. With insufficient depth, the bias could become substantial. One possibility is that bias was not observed due to the sequencing depth. Within a single genome where k-mer usage is present throughout the genome, the required depth of coverage to compensate for end bias need not be across the entire genome but rather simply represented in the random reads sequenced. However, with today’s high throughput sequencing, many more reads are typically obtained compared to the number used in this study; we therefore assume that few if any researchers in the future will have a problem with end bias skewing data interpretation. Lastly, invitrosome methods are not as universal as some may think. A lot of variables can differ between labs and even experiments, such as the speed at which the ion concentrations are reduced, linear vs stepwise ion reduction, ratio of DNA to protein, and so on. Differences in these variables between labs could change end bias outcomes. For example, higher concentrations of histone octamer relative to DNA would skew invitrosome formation towards the center of DNA fragments. For such a scenario, in theory the DNA ends would all be occupied with invitrosomes, forcing formation much further from the DNA ends. For the sonicated DNA invitrosome reconstitution used in this study, we followed the exact same procedure and ratios that Locke et al. used in their experiments, which generated the RsaI and HincII datasets. Perhaps in our analysis the consistency in methodology used does not skew the underlying data, but other methods might.
Fig 12. Role of sequencing depth and end bias.
A) Regardless of proximal-end bias taking place, with adequate sequencing depth, the number of in vitro reconstituted nucleosomes (invitrosomes) formed and their proximity to each other prevent underlying sequence bias from obfuscating invitrosomes positioned by DNA sequence. B) With inadequate sequencing depth, the sparse invitrosome coverage in conjunction with proximal-end bias would produce erroneous invitrosome positioning data (black arrowhead) while missing real invitrosome positioning DNA sequences (arrow). In both panels red ovals represent invitrosomes affected by end bias and green ovals represent invitrosomes formed due to DNA sequence preference. Blue lines represent the DNA fragments upon which the invitrosomes have formed. The red bars, green bars and black bars at the top of each panel represent invitrosome occupancy density from end-biased, DNA-sequence positioned, and the combined invitrosome data respectively.
Supporting information
Visual depiction of the percentages of reads, and by extension invitrosomes, during the classification and re-classification method. Invitrosomes too close to DNA fragment ends (in this case within 11 base pairs) were deemed suspect to formation on fragment ends due to end bias. Invitrosomes outside of 11 base pairs from DNA ends were deemed as passed, while invitrosomes containing a cutsite for the respective restriction enzyme within the nucleosomal DNA would normally be discarded are recovered. Using the alternate library’s passed invitrosomes, suspect invitrosomes were re-classified as recovered if a passed invitrosome from the other library could be found at the same position as the suspect invitrosome. The comparative analysis increases the sequencing data available for downstream analysis.
(TIF)
Visual depiction of the percentages of reads, and by extension invitrosomes, during the classification and re-classification method. Invitrosomes too close to DNA fragment ends (in this case within 1 base pair) were deemed suspect to formation on fragment ends due to end bias. Invitrosomes outside of 1 base pair from DNA ends were deemed as passed, while invitrosomes containing a cutsite for the respective restriction enzyme within the nucleosomal DNA would normally be discarded are recovered. Using the alternate library’s passed invitrosomes, suspect invitrosomes were re-classified as recovered if a passed invitrosome from the other library could be found at the same position as the suspect invitrosome. The comparative analysis increases the sequencing data available for downstream analysis.
(TIF)
Table of publicly available programs used in the analysis. All parameters for programs were set to default except as noted.
(TIF)
Acknowledgments
We would like to thank Julianne Grose and the Grose lab for the use of their AKTA P900 and P920 FPLC system, the BYU Office of Research Computing for the use of the supercomputer MaryLou, and current and former members of the Johnson lab for ideas and input.
Data Availability
The data are currently available via SRA number SUB9878583. The codes are available on GitHub (https://github.com/Johnson-Lab-BYU/End-Bias).
Funding Statement
Portions of this research were funded by NIH NIGMS award 1R15GM110646-01 awarded to SMJ, and through a grant from the Kenneth E., and Becky H. Johnson Foundation. One author, CEB, owns and operates the software consulting company, Qubit Software LLC. The contributions of Qubit Software LLC were pro bono in writing custom code under the direction of SMJ. Qubit Software LLC did not fund nor play a role in the study design, data collection, decision to publish, or preparation of the manuscript. The funders provided support in the form of salaries for author SMJ, but did not have any additional role in the study design, data collection and analysis, decision to publish, or preparation of the manuscript. The specific roles of these authors are articulated in the ‘author contributions’ section.”
References
- 1.Khorasanizadeh S. The nucleosome: from genomic organization to genomic regulation. Cell 2004;116(2):259–272. doi: 10.1016/s0092-8674(04)00044-3 [DOI] [PubMed] [Google Scholar]
- 2.Davey CA, Sargent DF, Luger K, Maeder AW, Richmond TJ. Solvent mediated interactions in the structure of the nucleosome core particle at 1.9 Å resolution. J Mol Biol 2002;319(5):1097–1113. doi: 10.1016/S0022-2836(02)00386-8 [DOI] [PubMed] [Google Scholar]
- 3.Luger K, Mäder AW, Richmond RK, Sargent DF, Richmond TJ. Crystal structure of the nucleosome core particle at 2.8 Å resolution. Nature 1997;389(6648):251. doi: 10.1038/38444 [DOI] [PubMed] [Google Scholar]
- 4.Drew HR, Travers AA. DNA bending and its relation to nucleosome positioning. J Mol Biol 1985;186(4):773–790. doi: 10.1016/0022-2836(85)90396-1 [DOI] [PubMed] [Google Scholar]
- 5.Negri R, Buttinelli M, Panetta G, De Arcangelis V, Di Mauro E, Travers A. Sequence dependence of translational positioning of core nucleosomes. J Mol Biol 2001;307(4):987–999. doi: 10.1006/jmbi.2001.4546 [DOI] [PubMed] [Google Scholar]
- 6.Dyer PN, Edayathumangalam RS, White CL, Bao Y, Chakravarthy S, Muthurajan UM, et al. Reconstitution of nucleosome core particles from recombinant histones and DNA. Methods in enzymology: Elsevier; 2003. p. 23–44. [DOI] [PubMed] [Google Scholar]
- 7.Luger K, Rechsteiner TJ, Richmond TJ. Preparation of nucleosome core particle from recombinant histones. Methods in enzymology: Elsevier; 1999. p. 3–19. doi: 10.1016/s0076-6879(99)04003-3 [DOI] [PubMed] [Google Scholar]
- 8.Locke G, Haberman D, Johnson SM, Morozov AV. Global remodeling of nucleosome positions in C. elegans. BMC Genomics 2013;14(1):284. doi: 10.1186/1471-2164-14-284 [DOI] [PMC free article] [PubMed] [Google Scholar]
- 9.Sakaue T, Yoshikawa K, Yoshimura SH, Takeyasu K. Histone core slips along DNA and prefers positioning at the chain end. Phys Rev Lett 2001;87(7):078105. doi: 10.1103/PhysRevLett.87.078105 [DOI] [PubMed] [Google Scholar]
- 10.Flaus A, Richmond TJ. Positioning and stability of nucleosomes on MMTV 3′ LTR sequences1. J Mol Biol 1998;275(3):427–441. doi: 10.1006/jmbi.1997.1464 [DOI] [PubMed] [Google Scholar]
- 11.Johnson SM. Painting a perspective on the landscape of nucleosome positioning. Journal of Biomolecular Structure and Dynamics 2010;27(6):795–802. doi: 10.1080/073911010010524946 [DOI] [PubMed] [Google Scholar]
- 12.Kaplan N, Moore IK, Fondufe-Mittendorf Y, Gossett AJ, Tillo D, Field Y, et al. The DNA-encoded nucleosome organization of a eukaryotic genome. Nature 2009;458(7236):362. doi: 10.1038/nature07667 [DOI] [PMC free article] [PubMed] [Google Scholar]
- 13.Zhang Y, Moqtaderi Z, Rattner BP, Euskirchen G, Snyder M, Kadonaga JT, et al. Intrinsic histone-DNA interactions are not the major determinant of nucleosome positions in vivo. Nat Struct Mol Biol 2009. AUG;16(8):847–U70. doi: 10.1038/nsmb.1636 [DOI] [PMC free article] [PubMed] [Google Scholar]
- 14.Krietenstein N, Wal M, Watanabe S, Park B, Peterson CL, Pugh BF, et al. Genomic nucleosome organization reconstituted with pure proteins. Cell 2016;167(3):709–721. e12. doi: 10.1016/j.cell.2016.09.045 [DOI] [PMC free article] [PubMed] [Google Scholar]
- 15.Torigoe SE, Urwin DL, Ishii H, Smith DE, Kadonaga JT. Identification of a rapidly formed nonnucleosomal histone-DNA intermediate that is converted into chromatin by ACF. Mol Cell 2011;43(4):638–648. doi: 10.1016/j.molcel.2011.07.017 [DOI] [PMC free article] [PubMed] [Google Scholar]
- 16.Böhm V, Hieb AR, Andrews AJ, Gansen A, Rocker A, Tóth K, et al. Nucleosome accessibility governed by the dimer/tetramer interface. Nucleic Acids Res 2011;39(8):3093–3102. doi: 10.1093/nar/gkq1279 [DOI] [PMC free article] [PubMed] [Google Scholar]
- 17.Gamarra N, Johnson SL, Trnka MJ, Burlingame AL, Narlikar GJ. The nucleosomal acidic patch relieves auto-inhibition by the ISWI remodeler SNF2h. Elife 2018;7:e35322. doi: 10.7554/eLife.35322 [DOI] [PMC free article] [PubMed] [Google Scholar]
- 18.Grokhovsky S. Specificity of DNA cleavage by ultrasound. Mol Biol (N Y) 2006;40(2):276–283. [Google Scholar]
- 19.Grokhovsky SL, Il’Icheva IA, Nechipurenko DY, Golovkin MV, Panchenko LA, Polozov RV, et al. Sequence-specific ultrasonic cleavage of DNA. Biophys J 2011;100(1):117–125. doi: 10.1016/j.bpj.2010.10.052 [DOI] [PMC free article] [PubMed] [Google Scholar]
- 20.Garafutdinov RR, Galimova AA, Sakhabutdinova AR. The influence of CpG (5â€2-d (CpG)-3â€2 dinucleotides) methylation on ultrasonic DNA fragmentation. Journal of Biomolecular Structure and Dynamics 2018. [DOI] [PubMed] [Google Scholar]
- 21.Poptsova MS, Il’Icheva IA, Nechipurenko DY, Panchenko LA, Khodikov MV, Oparina NY, et al. Non-random DNA fragmentation in next-generation sequencing. Scientific reports 2014;4:4532. doi: 10.1038/srep04532 [DOI] [PMC free article] [PubMed] [Google Scholar]
- 22.Nechipurenko DY, Il’icheva I, Khodikov M, Poptsova M, Nechipurenko YD, Grokhovsky S. Modeling of mechanochemical DNA cleavage by the action of ultrasound. Biophysics 2014;59(6):861–868. [PubMed] [Google Scholar]
- 23.Il’icheva I, Nechipurenko DY, Grokhovsky S. Ultrasonic cleavage of nicked DNA. Journal of Biomolecular Structure and Dynamics 2009;27(3):391–397. doi: 10.1080/07391102.2009.10507325 [DOI] [PubMed] [Google Scholar]
- 24.Seguin-Orlando A, Schubert M, Clary J, Stagegaard J, Alberdi MT, Prado JL, et al. Ligation bias in illumina next-generation DNA libraries: implications for sequencing ancient genomes. PloS one 2013;8(10):e78575. doi: 10.1371/journal.pone.0078575 [DOI] [PMC free article] [PubMed] [Google Scholar]
- 25.Lowary P, Widom J. New DNA sequence rules for high affinity binding to histone octamer and sequence-directed nucleosome positioning1. J Mol Biol 1998;276(1):19–42. doi: 10.1006/jmbi.1997.1494 [DOI] [PubMed] [Google Scholar]
- 26.Valouev A, Johnson SM, Boyd SD, Smith CL, Fire AZ, Sidow A. Determinants of nucleosome organization in primary human cells. Nature 2011;474(7352):516. doi: 10.1038/nature10002 [DOI] [PMC free article] [PubMed] [Google Scholar]
- 27.Locke G, Tolkunov D, Moqtaderi Z, Struhl K, Morozov AV. High-throughput sequencing reveals a simple model of nucleosome energetics. Proc Natl Acad Sci U S A 2010. DEC 7;107(49):20998–21003. doi: 10.1073/pnas.1003838107 [DOI] [PMC free article] [PubMed] [Google Scholar]
- 28.Johnson SM, Tan FJ, McCullough HL, Riordan DP, Fire AZ. Flexibility and constraint in the nucleosome core landscape of Caenorhabditis elegans chromatin. Genome Res 2006;16(12):000–000. doi: 10.1101/gr.5560806 [DOI] [PMC free article] [PubMed] [Google Scholar]
- 29.Segal E, Fondufe-Mittendorf Y, Chen L, Thåström A, Field Y, Moore IK, et al. A genomic code for nucleosome positioning. Nature 2006;442(7104):772. doi: 10.1038/nature04979 [DOI] [PMC free article] [PubMed] [Google Scholar]
- 30.Chung H, Vingron M. Sequence-dependent nucleosome positioning. J Mol Biol 2009;386(5):1411–1422. doi: 10.1016/j.jmb.2008.11.049 [DOI] [PubMed] [Google Scholar]
- 31.Valouev A, Ichikawa J, Tonthat T, Stuart J, Ranade S, Peckham H, et al. A high-resolution, nucleosome position map of C. elegans reveals a lack of universal sequence-dictated positioning. Genome Res 2008:gr. 076463.108. doi: 10.1101/gr.076463.108 [DOI] [PMC free article] [PubMed] [Google Scholar]
- 32.Albert I, Mavrich TN, Tomsho LP, Qi J, Zanton SJ, Schuster SC, et al. Translational and rotational settings of H2A.Z nucleosomes across the Saccharomyces cerevisiae genome. Nature 2007. MAR 29;446(7135):572–576. doi: 10.1038/nature05632 [DOI] [PubMed] [Google Scholar]
- 33.Satchwell SC, Drew HR, Travers AA. Sequence periodicities in chicken nucleosome core DNA. J Mol Biol 1986;191(4):659–675. doi: 10.1016/0022-2836(86)90452-3 [DOI] [PubMed] [Google Scholar]
- 34.Mavrich TN, Ioshikhes IP, Venters BJ, Jiang C, Tomsho LP, Qi J, et al. A barrier nucleosome model for statistical positioning of nucleosomes throughout the yeast genome. Genome Res 2008. JUL;18(7):1073–1083. doi: 10.1101/gr.078261.108 [DOI] [PMC free article] [PubMed] [Google Scholar]
- 35.Salih B, Tripathi V, Trifonov EN. Visible periodicity of strong nucleosome DNA sequences. Journal of Biomolecular Structure and Dynamics 2015;33(1):1–9. doi: 10.1080/07391102.2013.855143 [DOI] [PubMed] [Google Scholar]
- 36.Shivaswamy S, Bhinge A, Zhao Y, Jones S, Hirst M, Iyer VR. Dynamic remodeling of individual nucleosomes across a eukaryotic genome in response to transcriptional perturbation. PLoS Biol 2008. MAR;6(3):618–630. doi: 10.1371/journal.pbio.0060065 [DOI] [PMC free article] [PubMed] [Google Scholar]
- 37.Yuan GC, Liu YJ, Dion MF, Slack MD, Wu LF, Altschuler SJ, et al. Genome-scale identification of nucleosome positions in S. cerevisiae. Science 2005. Jul 22;309(5734):626–630. doi: 10.1126/science.1112178 [DOI] [PubMed] [Google Scholar]
- 38.Lee W, Tillo D, Bray N, Morse RH, Davis RW, Hughes TR, et al. A high-resolution atlas of nucleosome occupancy in yeast. Nat Genet 2007;39(10):1235. doi: 10.1038/ng2117 [DOI] [PubMed] [Google Scholar]
- 39.Sekinger EA, Moqtaderi Z, Struhl K. Intrinsic histone-DNA interactions and low nucleosome density are important for preferential accessibility of promoter regions in yeast. Mol Cell 2005;18(6):735–748. doi: 10.1016/j.molcel.2005.05.003 [DOI] [PubMed] [Google Scholar]
- 40.Ozsolak F, Song JS, Liu XS, Fisher DE. High-throughput mapping of the chromatin structure of human promoters. Nat Biotechnol 2007. FEB;25(2):244–248. doi: 10.1038/nbt1279 [DOI] [PubMed] [Google Scholar]
- 41.Chereji RV, Clark DJ. Major determinants of nucleosome positioning. Biophys J 2018;114(10):2279–2289. doi: 10.1016/j.bpj.2018.03.015 [DOI] [PMC free article] [PubMed] [Google Scholar]
- 42.Wang Y, Gellibolian R, Shimizu M, Wells R, Griffith J. Long CCG triplet repeat blocks exclude nucleosomes: A possible mechanism for the nature of fragile sites in chromosomes. J Mol Biol 1996. NOV 8;263(4):511–516. doi: 10.1006/jmbi.1996.0593 [DOI] [PubMed] [Google Scholar]
- 43.Cao H, Widlund H, Simonsson T, Kubista M. TGGA repeats impair nucleosome formation. J Mol Biol 1998. AUG 14;281(2):253–260. doi: 10.1006/jmbi.1998.1925 [DOI] [PubMed] [Google Scholar]
- 44.Field Y, Kaplan N, Fondufe-Mittendorf Y, Moore IK, Sharon E, Lubling Y, et al. Distinct modes of regulation by chromatin encoded through nucleosome positioning signals. PLoS computational biology 2008;4(11):e1000216. doi: 10.1371/journal.pcbi.1000216 [DOI] [PMC free article] [PubMed] [Google Scholar]
- 45.Eaton ML, Galani K, Kang S, Bell SP, MacAlpine DM. Conserved nucleosome positioning defines replication origins. Genes Dev 2010. Apr 15;24(8):748–753. doi: 10.1101/gad.1913210 [DOI] [PMC free article] [PubMed] [Google Scholar]
- 46.Wong B, Chen S, Kwon J, Rich A. Characterization of Z-DNA as a nucleosome-boundary element in yeast Saccharomyces cerevisiae. Proc Natl Acad Sci U S A 2007. FEB 13;104(7):2229–2234. doi: 10.1073/pnas.0611447104 [DOI] [PMC free article] [PubMed] [Google Scholar]
- 47.Garner MM, Felsenfeld G. Effect of Z-DNA on nucleosome placement. J Mol Biol 1987;196(3):581–590. doi: 10.1016/0022-2836(87)90034-9 [DOI] [PubMed] [Google Scholar]
- 48.WANG Y AMIRHAERI S, KANG S, WELLS R, GRIFFITH J. Preferential Nucleosome Assembly at Dna Triplet Repeats from the Myotonic-Dystrophy Gene. Science 1994. JUL 29;265(5172):669–671. doi: 10.1126/science.8036515 [DOI] [PubMed] [Google Scholar]
- 49.Thastrom A, Bingham L, Widom J. Nucleosomal locations of dominant DNA sequence motifs for histone—DNA interactions and nucleosome positioning. J Mol Biol 2004. MAY 7;338(4):695–709. doi: 10.1016/j.jmb.2004.03.032 [DOI] [PubMed] [Google Scholar]
- 50.Widlund H, Kuduvalli P, Bengtsson M, Cao H, Tullius T, Kubista M. Nucleosome structural features and intrinsic properties of the TATAAACGCC repeat sequence. J Biol Chem 1999. NOV 5;274(45):31847–31852. doi: 10.1074/jbc.274.45.31847 [DOI] [PubMed] [Google Scholar]
- 51.Bernstein BE, Liu CL, Humphrey EL, Perlstein EO, Schreiber SL. Global nucleosome occupancy in yeast. Genome Biol 2004;5(9):R62. doi: 10.1186/gb-2004-5-9-r62 [DOI] [PMC free article] [PubMed] [Google Scholar]
- 52.Cohanim AB, Haran TE. The coexistence of the nucleosome positioning code with the genetic code on eukaryotic genomes. Nucleic Acids Res 2009;37(19):6466–6476. doi: 10.1093/nar/gkp689 [DOI] [PMC free article] [PubMed] [Google Scholar]
- 53.Tilgner H, Nikolaou C, Althammer S, Sammeth M, Beato M, Valcarcel J, et al. Nucleosome positioning as a determinant of exon recognition. Nat Struct Mol Biol 2009. SEP;16(9):996–U124. doi: 10.1038/nsmb.1658 [DOI] [PubMed] [Google Scholar]
- 54.Ramirez-Carrozzi VR, Braas D, Bhatt DM, Cheng CS, Hong C, Doty KR, et al. A unifying model for the selective regulation of inducible transcription by CpG islands and nucleosome remodeling. Cell 2009;138(1):114–128. doi: 10.1016/j.cell.2009.04.020 [DOI] [PMC free article] [PubMed] [Google Scholar]
- 55.Schwartz S, Meshorer E, Ast G. Chromatin organization marks exon-intron structure. Nat Struct Mol Biol 2009. SEP;16(9):990–U117. doi: 10.1038/nsmb.1659 [DOI] [PubMed] [Google Scholar]
- 56.Moyle-Heyrman G, Zaichuk T, Xi L, Zhang Q, Uhlenbeck OC, Holmgren R, et al. Chemical map of Schizosaccharomyces pombe reveals species-specific features in nucleosome positioning. Proc Natl Acad Sci U S A 2013. Dec 10;110(50):20158–20163. doi: 10.1073/pnas.1315809110 [DOI] [PMC free article] [PubMed] [Google Scholar]
- 57.Meersseman G, Pennings S, Bradbury EM. Mobile nucleosomes‐‐a general behavior. EMBO J 1992;11(8):2951–2959. [DOI] [PMC free article] [PubMed] [Google Scholar]
- 58.Smit A, Hubley R, Green P. RepeatMasker Open-4.0. 2013–2015; Available at: <http://www.repeatmasker.org>. Accessed July/20, 2020.
- 59.Huang W, Li L, Myers JR, Marth GT. ART: a next-generation sequencing read simulator. Bioinformatics 2012;28(4):593–594. doi: 10.1093/bioinformatics/btr708 [DOI] [PMC free article] [PubMed] [Google Scholar]
- 60.Langmead B, Salzberg SL. Fast gapped-read alignment with Bowtie 2. Nature methods 2012;9(4):357. doi: 10.1038/nmeth.1923 [DOI] [PMC free article] [PubMed] [Google Scholar]
- 61.Afgan E, Baker D, Batut B, Van Den Beek M, Bouvier D, Čech M, et al. The Galaxy platform for accessible, reproducible and collaborative biomedical analyses: 2018 update. Nucleic Acids Res 2018;46(W1):W537–W544. doi: 10.1093/nar/gky379 [DOI] [PMC free article] [PubMed] [Google Scholar]
- 62.Li H, Handsaker B, Wysoker A, Fennell T, Ruan J, Homer N, et al. The sequence alignment/map format and SAMtools. Bioinformatics 2009;25(16):2078–2079. doi: 10.1093/bioinformatics/btp352 [DOI] [PMC free article] [PubMed] [Google Scholar]
- 63.Ramírez F, Ryan DP, Grüning B, Bhardwaj V, Kilpert F, Richter AS, et al. deepTools2: a next generation web server for deep-sequencing data analysis. Nucleic Acids Res 2016;44(W1):W160–W165. doi: 10.1093/nar/gkw257 [DOI] [PMC free article] [PubMed] [Google Scholar]
- 64.Wilhelm F, Wilhelm M, Erard M, Daune M. Reconstitution of chromatin: assembly of the nucleosome. Nucleic Acids Res 1978;5(2):505–521. doi: 10.1093/nar/5.2.505 [DOI] [PMC free article] [PubMed] [Google Scholar]
- 65.Hao F, Murphy KJ, Kujirai T, Kamo N, Kato J, Koyama M, et al. Acetylation-modulated communication between the H3 N-terminal tail domain and the intrinsically disordered H1 C-terminal domain. Nucleic Acids Res 2020;48(20):11510–11520. doi: 10.1093/nar/gkaa949 [DOI] [PMC free article] [PubMed] [Google Scholar]
- 66.Richmond TJ, Davey CA. The structure of DNA in the nucleosome core. Nature 2003;423(6936):145. doi: 10.1038/nature01595 [DOI] [PubMed] [Google Scholar]
Associated Data
This section collects any data citations, data availability statements, or supplementary materials included in this article.
Supplementary Materials
Visual depiction of the percentages of reads, and by extension invitrosomes, during the classification and re-classification method. Invitrosomes too close to DNA fragment ends (in this case within 11 base pairs) were deemed suspect to formation on fragment ends due to end bias. Invitrosomes outside of 11 base pairs from DNA ends were deemed as passed, while invitrosomes containing a cutsite for the respective restriction enzyme within the nucleosomal DNA would normally be discarded are recovered. Using the alternate library’s passed invitrosomes, suspect invitrosomes were re-classified as recovered if a passed invitrosome from the other library could be found at the same position as the suspect invitrosome. The comparative analysis increases the sequencing data available for downstream analysis.
(TIF)
Visual depiction of the percentages of reads, and by extension invitrosomes, during the classification and re-classification method. Invitrosomes too close to DNA fragment ends (in this case within 1 base pair) were deemed suspect to formation on fragment ends due to end bias. Invitrosomes outside of 1 base pair from DNA ends were deemed as passed, while invitrosomes containing a cutsite for the respective restriction enzyme within the nucleosomal DNA would normally be discarded are recovered. Using the alternate library’s passed invitrosomes, suspect invitrosomes were re-classified as recovered if a passed invitrosome from the other library could be found at the same position as the suspect invitrosome. The comparative analysis increases the sequencing data available for downstream analysis.
(TIF)
Table of publicly available programs used in the analysis. All parameters for programs were set to default except as noted.
(TIF)
Data Availability Statement
The data are currently available via SRA number SUB9878583. The codes are available on GitHub (https://github.com/Johnson-Lab-BYU/End-Bias).


