

Abstract
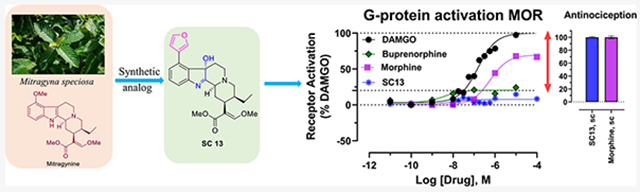
Mitragynine and 7-hydroxymitragynine (7OH) are the major alkaloids mediating the biological actions of the psychoactive plant kratom. To investigate the structure–activity relationships of mitragynine/7OH templates, we diversified the aromatic ring of the indole at the C9, C10, and C12 positions and investigated their G-protein and arrestin signaling mediated by mu opioid receptors (MOR). Three synthesized lead C9 analogs replacing the 9-OCH3 group with phenyl (4), methyl (5), or 3′-furanyl [6 (SC13)] substituents demonstrated partial agonism with a lower efficacy than DAMGO or morphine in heterologous G-protein assays and synaptic physiology. In assays limiting MOR reserve, the G-protein efficacy of all three was comparable to buprenorphine. 6 (SC13) showed MOR-dependent analgesia with potency similar to morphine without respiratory depression, hyperlocomotion, constipation, or place conditioning in mice. These results suggest the possibility of activating MOR minimally (G-protein Emax ≈ 10%) in cell lines while yet attaining maximal antinociception in vivo with reduced opioid liabilities.
Graphical Abstract
INTRODUCTION
Opioids targeting the mu opioid receptor (MOR) are used for the treatment of moderate to severe pain.1 However, MOR activation is also associated with serious side effects such as tolerance, physical dependence, and risk of abuse;1-3 opioid-induced respiratory depression can be lethal at high doses, and constipation can be debilitating as well. Opioid abuse and overdose are one of the leading causes of accidental death in the United States, responsible for more than 47,000 deaths in 2019 alone.4 Therefore, the discovery of a new class of MOR agonist molecular scaffold that retains potent analgesic actions but displays reduced side effects and abuse potential is an urgent challenge for the scientific community.
Applying molecular modeling based on active state MOR structures and synthesis of novel ligands and using newer assays with limited receptor reserve, the opioid field is revisiting the strategy of developing low-efficacy partial agonists as novel safer analgesics.5-7 Numerous MOR partial agonists with multifunctional activity at other opioid receptor subtypes have been described in the literature, such as buprenorphine, nalbuphine, and pentazocine, validating the feasibility of this strategy. The identification of novel partial agonists may have been hindered by modern screening assays that assess G-protein activity, yet have large receptor reserve (so-called “spare” receptors), which prevents a simple delineation of lower-efficacy compounds.8,9 In order to develop candidate pain relievers based on mitragynine and 7-hydroxymitragynine (7OH) scaffolds with a particular goal of assessing G-protein efficacy and its impact on opioid function in vivo, we aimed at the diversification of the mitragynine template and evaluated the resulting compounds in systems capable of detecting their true efficacy.
The psychoactive plant kratom [Mitragyna speciosa, (Korth.) Havil. Rubiaceae], has traditionally been used for the treatment of opioid dependence.10 The dry leaves of kratom are used in traditional medicine as an analgesic treatment and are typically consumed directly or brewed as tea. The major active alkaloid found in kratom is mitragynine, along with more than 53 other minor alkaloids.11-17 In recent years, we have become interested in the chemistry and pharmacology of kratom alkaloids as probes to understand opioid receptor function.18-25 Previous reports from our group reported that mitragynine (1, possessing an indole core), its oxidation product 7OH (2, possessing an indolenine core), and mitragynine pseudoindoxyl (3, MP, a skeletal rearrangement product of 7OH with a spiro-pseudoindoxyl core) (Figure 1A), are all opioid antinociceptive agents19,20 and G-protein-biased MOR agonists.18,19,21,23 We also reported oxidative metabolism of mitragynine to 7OH using a CYP3A-mediated pathway following oral administration of mitragynine in mice.20 Metabolism of mitragynine to 7OH in vitro26 and in dogs27 has been reported by other groups too. More recently, we also reported an atomic-level description of how kratom alkaloids may bind and allosterically modulate MOR.22 In vivo studies in mice revealed that kratom and a number of its alkaloids are analgesic16,19,20,28-30 have ameliorate opioid physical dependence,24,28 decrease alcohol intake,23 and inhibit self-administration of heroin in rats.31 While 7OH retains its abuse potential after both intravenous and parental administration,23 intravenous mitragynine is not self-administered,31,32 suggesting that it may be possible to design a safer analgesic based on this template by further optimization of the mitragynine template.
Figure 1.

(A) Structure of selected natural and semi-synthetic analogs. (B) Semi-synthesis of C9 mitragynine and 7OH derivatives. (C) Semi-synthesis of C10 mitragynine and 7OH derivatives. (D) Semi-synthesis of C12 mitragynine and 7OH derivatives. Reagents and conditions: (a) AlCl3, EtSH, DCM, 0 °C, 5 h; (b) PhNTf2, Et3N, DCM, rt, 12 h; (c, yielding 9) phenylboronic acid, Pd(PPh3)4, K2CO3, MeOH, toluene, 80 °C, 8 h; (d, yielding 8) 3-furanylboronic acid, Pd(PPh3)4, K2CO3, MeOH, toluene, 80 °C, 8 h; (e, yielding 10) DABAL-Me3, Pd2(dba)3, XPhos, THF, 60 °C, 8 h; (f) yielding 4, 5, and 6 (SC13) oxone, NaHCO3, H2O, acetone, 0 °C, 1 h. (g) ethylene glycol, PIFA, CH3CN, 0 °C, 1 h; (h) NBS, DMF, 5 h, rt; (i) NaBH3CN, AcOH, MeOH, reflux, 12 h; (j, yielding 13) phenylboronic acid, Pd(dppf)Cl2, KOAc, THF, 70 °C, 6 h; (k, yielding 14) 3-furanylboronic acid, Pd(dppf)Cl2, KOAc, THF, 70 °C, 6 h; (l, yielding 15) DABAL-Me3, Pd2(dba)3, XPhos, THF, 60 °C, 8 h; (m, yielding 16, 17, and 18) oxone, NaHCO3, H2O, acetone, 0 °C, 1 h. (n) NBS, AcOH, 4 h, rt; (o, yielding 20) phenylboronic acid, Pd(PPh3)4, K2CO3, MeOH, toluene, 80 °C, 8 h; (p, yielding 21) 3-furanylboronic acid, Pd(PPh3)4, K2CO3, MeOH, toluene, 80 °C, 8 h; (q, yielding 22) DABAL-Me3, Pd2(dba)3, XPhos, THF, 60 °C, 8 h; (r, yielding 23, 24, and 25) oxone, NaHCO3, H2O, acetone, 0 °C, 1 h.
Chemistry studies to date are limited in the structure–activity relationship (SAR) investigations of both mitragynine and 7OH scaffolds, prompting the present development of diversification strategies across these two indole-based templates. Here, we report the pharmacological characterization of mitragynine and 7OH analogs synthesized by introducing a phenyl, 3′-furanyl, and methyl group at the C9/10/12 positions of the aromatic ring in the two templates. The lead compounds 4, 5, and 6 (SC13) (Figure 1A) showed lower G-protein efficacy at MOR than DAMGO and morphine in in vitro assays with limited receptor reserve and ex vivo measures as well. The most potent and selective Gi-1 MOR agonist among the three leads, 6 (SC13), displayed antinociceptive activity comparable to morphine but exhibited greatly attenuated constipation, respiratory depression, and locomotor activity. Furthermore, 6 (SC13) displayed no reinforcement behavior in a conditioned-place preference assay. Taken together, the reported in vitro assays in cells, ex vivo electrophysiological assessment in rat brain slices, and in vivo experiments in mouse suggest that the partial agonist 6 (SC13) exerts effective MOR-mediated analgesia with a side effect profile far superior to clinically used MOR-based antinociceptive agents.
RESULTS
Chemistry.
To assess the pharmacological profile of mitragynine and 7OH templates, structure activity relationships (SAR) studies were carried out by modifying three different regions of the aromatic indole ring on both scaffolds, namely, the C9, C10, and C12 positions, with phenyl, 3′-furanyl and methyl group substitutions. (Figure 1). The unsaturated acrylate segment of both templates is thought to be an essential component for the efficient binding of any mitragynine- or 7OH-related analog into the orthosteric MOR binding pocket.18 Therefore, this feature of both scaffolds was kept constant throughout our studies. We synthesized a total of 18 analogs and investigated their pharmacology with in vitro assays.
Semi-synthesis of analogs was initiated from mitragynine (1) extracted from dry kratom powder following a modified protocol reported by Váradi et al.19 To gain access to the C9 position on the mitragynine scaffold, 1 was converted to triflate (7, Figure 1B). This intermediate triflate was converted to 8, 9, and 10 using palladium-catalyzed coupling reactions. Then 8, 9, and 10 were transformed to their corresponding 7OH derivatives 6 (SC13), 4, and 5, respectively, using oxone and aqueous NaHCO3. Functionalization of the C10 position on the mitragynine scaffold was achieved by selectively incorporating bromine at the C10 position using a protocol developed by Takayama et al.33 Mitragynine (1) was first converted to 10-bromo mitragynine 12 using a three-step reaction sequence (Figure 1C). 10-Bromo mitragynine 12 was then subjected to different coupling reactions to obtain C10 mitragynine analogs, namely, 13, 14, and 15. 13, 14, and 15 were then treated with oxone and aqueous NaHCO3 to obtain the corresponding 7OH derivatives 16, 17, and 18, respectively. For the C12 derivatives, as shown in Figure 1D, mitragynine (1) was brominated directly to afford mainly 12-bromo mitragynine (19). The same reaction sequence (as in C10) was followed to synthesize C12-substituted analogs 20, 21, and 22. Next, all were treated with oxone and aqueous NaHCO3 to yield C12 7OH derivatives 23, 24, and 25. Detailed synthetic procedures are described in the Experimental Section.
SAR and In Vitro Functional Screening of Synthesized Analogs.
Each synthesized compound was first evaluated for G-protein activity using the high-throughput Glo-sensor cAMP inhibition assay and Tango β-arrestin2 recruitment assay. For cAMP assays, HEK-T cell lines transiently expressing human MOR, KOR, and DOR were used, while for Tango assays, HTLA cells transiently expressing TEV fused β-arrestin2 were used. The data were normalized to that of prototypic full agonists, DAMGO for MOR, U50,488H for KOR, and DPDPE for DOR, respectively. cAMP and β-arrestin2 data for MOR are presented in Table 1 with representative SAR of selected compounds shown in Figure S1A,B. Additionally, results for KOR and DOR are summarized in Tables S1 and S2 in the Supporting Information (SI).
Table 1.
Functional Studies at MOR Using cAMP Inhibition & Tango-Arrestin Assays
| functional data at MOR using cAMP inhibition &Tango-arrestin assaysa | ||||
|---|---|---|---|---|
| cAMP inhibition |
β-arrestin2 recruitment |
|||
| compound | EC50 nM (pEC50 ± SEM) | Emax% ± SEM | EC50 nM (pEC50 ± SEM) | Emax% ± SEM |
| 4 | 36.20 (7.44 ± 0.06) | 107.9 ± 2.76 | 19200 (4.72 ± 0.17) | 283 ± 34 |
| 5 | 5.25 (8.28 ± 0.06) | 108.0 ± 1.92 | 10400 (4.98 ± 0.15) | 110 ± 2 |
| 6 (SC13) | 7.25 (8.14 ± 0.05) | 105.61 ± 1.59 | 11000 (4.96 ± 0.22) | 45 ± 4 |
| 8 | 93.73 (7.03 ± 0.15) | 70.24 ± 4.56 | n.d. | <20 |
| 9 | 83.16 (7.08 ± 0.17) | 46.13 ± 3.81 | n.d. | <20 |
| 10 | 82.94 (7.08 ± 0.08) | 97.08 ± 3.52 | n.d. | <20 |
| 13 | 3763 (5.42 ± 0.15) | 73.88 ± 0.75 | n.d. | <20 |
| 14 | 85.92 (7.07 ± 0.07) | 90.82 ± 3.02 | n.d. | <20 |
| 15 | 369.7 (6.43 ± 0.09) | 96.51 ± 4.05 | n.d. | <20 |
| 16 | 104.3 (6.98 ± 0.07) | 88.73 ± 2.81 | n.d. | <20 |
| 17 | 534.7 (6.27 ± 0.07) | 100.34 ± 3.30 | 8039 (5.09 ± 0.45) | 31.34 ± 16.72 |
| 18 | 30.25 (7.52 ± 0.09) | 9.58 ± 2.75 | n.d. | <20 |
| 20 | 1113 (5.95 ± 0.19) | 50.35 ± 7.27 | n.d. | <20 |
| 21 | 186.2 (6.73 ± 0.08) | 78.22 ± 3.39 | n.d. | <20 |
| 22 | 71.44 (7.15 ± 0.06) | 83.86 ± 2.76 | n.d. | <20 |
| 23 | 17510 (4.76 ± 0.78) | <20 | n.d. | <20 |
| 24 | 1560 (5.81 ± 0.14) | 61.81 ± 6.52 | n.d. | <20 |
| 25 | 11.24 (7.95 ± 0.06) | 69.34 ± 1.63 | n.d. | <20 |
| mitragynine | 241.2 (6.62 ± 0.10) | 84.68 ± 3.44 | n.d. | <20 |
| 7OH | 5.93 (8.23 ± 0.06) | 95.55 ± 1.79 | n.d. | <20 |
| DAMGO | 0.49 (9.31 ± 0.05) | 100 | 182.04 (6.74 ± 0.09) | 100 |
The functional data of each compound in cAMP and Tango β-arrestin2 in human mu-opioid receptor (hMOR) were determined and normalized to Emax of the corresponding standard DAMGO. Results were analyzed using a three-parameter logistic equation in GraphPad Prism, and the data are presented as mean EC50(pEC50 ± SEM) with Emax% ± SEM for assays run in triplicate. nd; results could not be determined because the efficacy of β-arrestin2 recruitment was less than 20%.
We initiated our investigations with modification at the C9 position of mitragynine with the syntheses of 8 (9-3′-furanyl mitragynine), 9 (9-phenyl mitragynine), and 10 (9-methyl mitragynine), each of which revealed moderate activity and potency (EC50 > 50 nM) in cAMP assays and poor β-arrestin2 recruitment (Emax < 20%) at MOR. We then investigated three other C9 analogs on the 7OH template, 9-phenyl-7OH (4), 9-methyl-7OH (5), and 9–3′-furanyl 7OH (6; SC13). We specifically picked these moieties in order to explore the effect of an aryl-(phenyl), a heteroaryl-(3′-furanyl), and an aliphatic group such as methyl on this template. The incorporation of a phenyl ring at the C9 end of the 7OH scaffold led to an increased cAMP potency at MOR (EC50 = 36.2 nM, compound 4, Table 1 and Figure S1A) in comparison with the same substituent on the mitragynine template (EC50 = 83.2 nM, compound 9, Table 1). The introduction of an aliphatic methyl group at C9 of the 7OH scaffold in 5 improved potency in the cAMP assay with MOR (EC50 = 5.3 nM) compared to the 9-methyl mitragynine 10 (EC50 = 82.9 nM). Furthermore, grafting of a 3′-furanyl group at C9 of 7OH 6 (SC13) showed similar potency (EC50 = 7.3 nM) in the cAMP assay to that of 5 as well as the parent 7OH (EC50 = 5.9 nM). Interestingly, while the corresponding analogs on the mitragynine template (8, 9, and 10) showed poor β-arrestin2 recruitment, the analogs on the 7OH template (4 and 5) showed robust arrestin recruitment in Tango assays at MOR relative to DAMGO: compound 6 (SC13) showed 45% β-arrestin2 efficacy relative to DAMGO but higher than the parent template 7OH (Table 1 and Figure S1B). The potencies of 4, 5, and 6 (SC13) for recruiting arrestin however remained poor (with EC50 > 10 μM for each). 4, 5, and 6 (SC13) showed no β-arrestin2 recruitment at KOR, but β-arrestin2 recruitment was seen at DOR (Emax > 100%) with all three analogs (Tables S1 and S2 in the SI). In cAMP assays, compound 6 (SC13) was most selective for MOR over DOR and KOR, showing 30-fold and 14-fold selectivity compared to 5 and 4, which were less MOR selective. (Table 1 and Tables S1 and S2).
The next set of analogs was designed at the C10 and C12 ends of both the mitragynine and 7OH templates. None of the synthesized analogs at C10 and C12 exhibited promising activities at MOR in the cAMP assay except for 12-methyl 7OH (compound 25), with an EC50 = 11.2 nM. Notably, these analogs also did not effectively recruit β-arrestin2 (Emax < 20%) in the Tango assay (Table 1).
Our mitragynine template diversification attempts did produce numerous partial agonists, but with the exception of compound 25, their potency was greater than 50 nM, in the cAMP assay. Therefore, 4, 5, and 6 (SC13) (all C9 substituted 7OH analogs) were chosen as leads from the series of compounds synthesized. 4, 5, and 6 (SC13) were evaluated in the PathHunter assay,19,23 which we and others12 have previously used to measure the β-arrestin2 activity of the parent natural products. In this assay, like morphine (Emax = 31%), 4, 5, and 6 (SC13) were found to recruit β-arrestin2 with greatly reduced efficacy (Emax < 20%) compared to DAMGO (Figure S1C in the SI). These observations suggest that the much higher β-arrestin2 recruitment seen in the Tango assay is likely a consequence of higher amplification of arrestin signaling compared to the PathHunter assay. In hMOR (human MOR) competition binding assays using 3H-DAMGO as the radioligand, DAMGO and morphine showed subnanomolar affinity for MOR; among the lead analogs, 6 (SC13) had the highest affinity (Ki = 6 nM) and 4 and 5 had high (15–17 nM) affinity at MOR as well (Figure S1D in the SI).
Analogs 4, 5, and 6 (SC13) Are MOR Partial Agonists in BRET-Based G-Protein Activation Assays.
We next assessed 4, 5, and 6 (SC13) and the controls DAMGO, morphine, buprenorphine, and fentanyl for G-protein activation (Gi-1) using TRUPATH assays and arrestin recruitment (β-arrestin1/2) using another BRET-based assay, which produce less signal amplification compared to the cAMP and Tango assays.34
4, 5, and 6 (SC13) showed MOR partial agonist activity with Emax = 60–70% of DAMGO at Gi-1. Fentanyl showed higher efficacy (Emax = 122%) and morphine showed an efficacy only slightly lower than DAMGO (Emax = 94%), whereas buprenorphine had an Emax = 44% in this assay (Figure 2A and Table S3 in the SI). Thus, the intrinsic efficacy of 4, 5, and 6 (SC13) appeared somewhat higher than for the prototypic MOR partial agonist buprenorphine but lower than DAMGO, fentanyl, and morphine under these conditions (Figure S1E and Table S3 in the SI).
Figure 2.

G-protein signaling, arrestin signaling, whole cell electrophysiology in rat VTA, and Gα-subtype screening of 4, 5, and 6 (SC13) and MOR controls in hMOR 4, 5, and 6 (SC13) are MOR partial agonists in cell-based assays, G-protein signaling assays, and in ephys assays. (A) Compounds 4, 5, and 6 (SC13) are MOR partial agonists with lower efficacy than morphine, fentanyl, and DAMGO in Gi-1 BRET assays. (B) 4, 5, and 6 (SC13) showed no measurable β-arrestin2 recruitment (<10%) in BRET arrestin recruitment assays compared to fentanyl and DAMGO in this assay. (C) In Nb33 recruitment assays measured using BRET assays in hMOR, 6 (SC13) had lower efficacy than DAMGO and morphine and similar efficacy to buprenorphine. (D) In Nb33 recruitment assays measured using BRET assays in mMOR, 6 (SC13) had lower efficacy than DAMGO and morphine and similar efficacy to buprenorphine. (E) Summary inhibition of electrically evoked IPSCs in VTA neurons in response to 5 μM DAMGO, 10 μM morphine, 10 μM 4, 10 μM 5, and 10 μM 6 (SC13), where each circle is one neuron. Horizontal bars indicate means. 4, 5, and 6 (SC13) show lower efficacy than DAMGO. (F) Mean time course of responses during bath application of 6 (SC13), n = 8 in whole cell electrophysiology in rat VTA. See Table S3 in the SI for values for panels (A–D). (G) TRUPATH heatmaps demonstrate how a panel of 7OH analogs, 4, 5, and 6 (SC13), and MOR agonists engage Gαi/o-class transducers with varying potency (G) and efficacy (H). Most ligands exhibit enhanced (GαZ) relative to other G-protein transducers. Heatmap colors represent mean log(EC50) and normalized efficacy values; NR, no response, presented as a white square. Mean values and standard error are reported in the Supporting Information, Table S4. Data for all functional assays that were carried out in hMOR were normalized to Emax of DAMGO. The dose response curves were fit using a three-parameter logistic equation in GraphPad Prism, and the data are presented as mean EC50(pEC50 ± SEM) for assays run in triplicate.
The novel compounds and MOR controls were also characterized using the TRUPATH assay34 for the activation of other Gα-i/o subtypes (Gi-2, Gi-3, GoA, GoB and Gz). 4, 5, and 6 (SC13) were found to be partial agonists at all these G-protein subtypes and showed an efficacy profile similar to buprenorphine at the same subtypes (Figure 2H and Table S4 in the SI). The highest potencies (Figure 2G and Table S4 in the SI) and efficacy (Figure 2H and Table S4 in the SI) were seen at Gz for 4, 5, and 6 (SC13) as well as the MOR reference compounds. Specifically, the Gz efficacy for 4, 5, and 6 (SC13) was similar to both buprenorphine and morphine but lower than DAMGO and fentanyl. Notably, the higher efficacy and equipotency at Gi-1 and Gz for buprenorphine relative to DAMGO and higher potency of morphine at Gz relative to Gi-1 are consistent with a recent work from the Bidlack group.35
In β-arrestin2 recruitment assays, DAMGO (Emax = 100%) and fentanyl (Emax = 98%) robustly recruited β-arrestin2 (Figure 2B and Table S3 in the SI), whereas morphine was moderately active (Emax = 32%) and buprenorphine was less active (Emax < 10%) (Figure S1F and Table S3 in the SI). β-Arrestin2 recruitment induced by incubation with buprenorphine and 4, 5, and 6 (SC13) was not measurable with this assay (Figure S1F and Table S3 in the SI). In this assay, 4, 5, 6 (SC13), morphine, and buprenorphine failed to show recruitment of β-arrestin1, whereas fentanyl displayed 83% efficacy in this assay compared to DAMGO. In summary, in the BRET-based assays, 4, 5, and 6 (SC13) acted as MOR partial agonists for G-protein activation but did not show arrestin recruitment.
We also evaluated an MOR selectivity of 6 (SC13) (our behavioral lead; see next section) versus KOR/DOR selectivity for Gi-1 activation. 6 (SC13) was found to have ~100-fold lower potency at DOR and KOR (Figure S1G,H) in this assay.
Recent works have shown that nanobodies (Nb33 and Nb39) can be used as receptor-activation sensors to accurately probe agonist activity.36,37 Canals and co-workers have recently used a conformationally selective Nb33-recruitment assay21 to more accurately determine the efficacy5 of MOR ligands in an unamplified manner more akin to the BRET-based direct arrestin recruitment assay. Since morphine was a partial agonist in this assay (Emax = 71%), compared to 94% in our Gi-1 assays, we used this assay to determine the efficacy of 4, 5, and 6 (SC13) and compared it to DAMGO, morphine, and buprenorphine in HEK293-T cells transiently transfected with the human and murine-MOR. In this assay, the efficacies of morphine and buprenorphine were 72 and 24%, respectively, compared to DAMGO, and 4, 5, and 6 (SC13) each showed efficacies of ~20% in this assay at hMOR (Figure 2C/Figure S1I and Table S3 in the SI). Similarly, at murine MOR (Figure 2D/Figure S1J and Table S3 in the SI), the efficacies of 4, 5, (Emax = 15–18%) and 6 (SC13) (8%) were more comparable to buprenorphine (20%) and lower than morphine (69%). Thus, the efficacies of our lead ligands are similar to buprenorphine and far lower than morphine in this assay, and the efficacies of our control drugs matched published reports.5 While it is difficult to accurately determine potencies of our leads with such limited dynamic range, the potency of 6 (SC13) (our behavioral lead) was in the same range as morphine as well as DAMGO (Figure 2C,D).
4, 5, and 6 (SC13) Showed Low Efficacies for Inhibition of Synaptic Transmission.
To gauge partial agonism in a physiologically natural, endogenous system, we utilized whole cell electrophysiological recordings from ventral tegmental area (VTA) neurons in acute rat brain slices. Full MOR agonists such as DAMGO strongly inhibit GABA receptor-mediated inhibitory postsynaptic currents (IPSCs) (Figure 2E).38 Thus, we tested the efficacy of 10 μM 4, 5, and 6 (SC13) at this synapse by measuring electrically evoked GABAA receptor-mediated IPSCs. As a control, in separate brain slices from the same rats, we also measured responses to a saturating concentration of DAMGO (5 μM) and 10 μM morphine. The mean inhibition of evoked IPSCs was smaller in response to 4, 5, and 6 (SC13) compared to DAMGO as well as morphine (Figure 2E). The mean time course of the response to 10 μM 6 (SC13) is shown in Figure 2F. Together, these effects are consistent with the 4, 5, and 6 (SC13) compounds acting as partial agonists, at this synapse.
Analogs 4, 5, and 6 (SC13) Form Different Interactions with MOR Compared to Morphine and Buprenorphine.
To provide a structural context to the observed differences in G-protein efficacy (exemplified by Emax values) between kratom alkaloids and classical opioid drugs, such as morphine and buprenorphine, we carried out a statistical analysis of the interactions formed between MOR residues and each of the compounds included in this manuscript, during molecular dynamics (MD) simulations of ligand–receptor complexes embedded in hydrated 1-palmitoyl-2-oleoyl phosphatidyl choline (POPC) bilayers. DAMGO and fentanyl were excluded from this analysis because of their different chemical composition and expected unique mode of binding with respect to the other molecules in the data set. The MD simulations of 8, 9, 10, 4, 5, 6 (SC13), 11F,39 morphine, and buprenorphine (see Table S5 for efficacy data), were carried out using the same simulation parameters and protocol used in our previous work on 7OH and mitragynine.40 A statistical analysis of structural interaction fingerprints (SIFts) derived from these simulations and whose average probabilities are listed in Table S6 for each ligand yielded eight statistical models that best recapitulate the negative logarithm of experimental G-protein Emax values obtained for each ligand (see Figure S3, Gi-1 Emax was used for ligands). These models correspond to the top quartile of R2 validation on the full training set and the lowest root-mean-square error (RMSE) on the leave-one-out (LOO) validation (red dots in Figure S2). According to this modeling and the calculated average positive coefficients reported in Table S7, the efficacy of 4, 5, and 6 (SC13) ligands and buprenorphine is reduced because of the specific apolar interactions these ligands form with Y75(1.39), N127(2.63), I144(3.29), C217(45.50), and W133(23.50). On the other hand, the efficacy of 4, 5, and 6 (SC13) is enhanced (negative coefficients) by the specific apolar and edge-to-face aromatic interactions these ligands form with H319 (7.36). The aforementioned residue numbers refer to the murine MOR sequence and the dot-separated numbers in parenthesis refer to the Ballesteros–Weinstein generic numbering scheme41 when located in transmembrane (TM) helices and Isberg et al.’s numbering scheme42 when in loops. The first number in these schemes refers either to a helix (e.g., 3 refers to TM3) or a loop (e.g., “45” refers to the loop between TM4 and TM5) to which that residue belongs, whereas the second number represents the residue position relative to the most conserved residue in the helix, which is always defined by the number 50.
Notably, as suggested by the coefficient values reported in Table S8, and illustrated in Figure 3 by comparing binding modes (Figure 3A) and average SIFts of 4, 5, and 6 (SC13) with SIFts calculated for morphine (Figure 3B), the 4, 5, and 6 (SC13) ligands show higher probability of interacting with Y75(1.39), N127(2.63), I144(3.29), H319(7.36), C217(45.50), and W133(23.50) but much lower probability of interacting with H297(6.52) compared to morphine.
Figure 3.

Binding modes and interactions of 4, 5, and 6 (SC13) compared to morphine. (A–C) Representative conformations of the most populated clusters from MD simulations of MOR bound to 4 (blue), 5 (teal), and 6 (SC13) (purple) (panels (A–C), respectively), compared to a representative conformation of MOR bound to morphine (orange). The crystal structure of active MOR corresponding to PDB ID: 5C1M was used as a starting point for all molecular docking and simulation studies. The protein is represented as a gray cartoon in the morphine–MOR complex. Residues identified in the best eight performing models on experimental data are indicated with sticks. Transmembrane helices 5 and 6 are not shown for clarity. (D) Differences (plot at the bottom) between average structural interaction fingerprints (SIFts) calculated for 4, 5, and 6 (SC13) (plot in the middle) and SIFts calculated for morphine (plot at the top).
6 (SC13) Shows MOR-Dependent Antinociception with Reduced Adverse Effects.
The lead MOR-selective agonist 6 (SC13) was characterized in C57BL/6J mice for antinociception, respiratory depression, locomotor effects, inhibition of gastrointestinal transit, and reward or dysphoria (measured using the conditioned place preference or aversion assay (CPP/CPA)).
When administered subcutaneously (sc), 6 (SC13) showed dose-dependent antinociception in mice in the radiant heat 55 °C tail withdrawal assay, with peak effect at 20 min and an ED50 (and 95% CI) value of 3.05 (1.75–5.27) mg/kg, sc (Figure 4A). Thus, 6 (SC13) potency was similar to that of morphine (ED50 = 2.48 (1.57–3.87) mg/kg, sc),24 consistent with its roughly comparable Gi-1 potency (EC50 = 145 nM compared to morphine (EC50 = 51 nM)) as well as in BRET-Nb33 assays (EC50 of morphine = 584 and 1644 nM and EC50 of 6 (SC13) = 12 and 730 nM at mMOR and hMOR, respectively) for both drugs. Opioid receptor selectivity of 6 (SC13)-mediated antinociception was assessed in transgenic knock-out (KO) mice lacking MOR, KOR or DOR. 6 (SC13) antinociception was significantly reduced in MOR KO mice (Figure 4B). DOR KO did not produce significant differences in effect from WT mice, and while KOR contributions were trending toward significance, they did not reach statistical threshold. Blockage of 6 (SC13) antinociception in MOR KO was significantly greater compared to DOR KO and KOR KO mice supporting the conclusion that 6 (SC13) antinociception was predominantly MOR-mediated. The results were also consistent with 6 (SC13) selectivity seen in Gi-1 BRET assays.
Figure 4.

Compound 6 (SC13) shows MOR-dependent antinociception and lacks abuse potential, constipation, respiratory depression, and hyperlocomotion at equianalgesic morphine doses. (A) Antinociception time course. Groups of C57BL/6 J mice were subcutaneously (sc) administered 6 (SC13) and antinociception measured using the 55 °C tail withdrawal assay. Data are shown as mean % antinociception ± SEM. (A) Effect of 6 (SC13) at doses of 1, 3, and 10 mg/kg (n = 8 each group) with repeated measures over time. 6 (SC13) showed potent dose-dependent antinociception. (B) 6 (SC13) antinociception in KO mice. Antinociception effect of 6 (SC13) (10 mg/kg, sc,) was evaluated in groups of (n = 8) in WT, MOR KO, KOR KO, and DOR KO mice. Antinociception of 6 (SC13) remained intact in DOR KO (p = 0.13) and KOR KO (p = 0.058) mice, while it was found attenuated in MOR KO. Results for 6 (SC13) were analyzed with one-way ANOVA followed by Tukey’s post-hoc test, F3,28 = 24.07, p < 0.0001, ****p < 0.0001 relative to WT, ns = p > 0.05 relative to WT. Attenuation of 6 (SC13) antinociception in MOR KO was also significantly greater compared to DOR KO and KOR KO mice (p < 0.0001 each; Tukey’s post hoc test). All values are expressed as the mean ± SEM. (C) Conditioned place preference or aversion (CPP/CPA). Place conditioning evaluation of 6 (SC13), morphine, and U50,488H, in C57BL/6 J mice after IP or sc administration. Following the determination of initial preconditioning preferences, mice were place-conditioned daily for 2 days with 6 (SC13) (15 mg/kg, sc; n = 23), U50,488H (30 mg/kg, IP; n = 28) or morphine (10 mg/kg, IP; n = 18). Mean differences in time spent on the drug-paired side ± SEM are presented. 6 (SC13) does not display significant CPP or CPA compared to the matching preconditioning preference (p < 0.05), as determined by unpaired t test with Welch’s correction. Morphine showed CPP (*p = 0.0140), and U50,488H showed CPA (****p < 0.0001) and were significantly different from matching preconditioning preference. (D) 6 (SC13) effects on gastrointestinal transit. Mice were administered morphine (10 mg/kg, sc) or 6 (SC13) (15 mg/kg, sc) or saline (0.9%, po) and then fed a charcoal meal. After 3 h, morphine significantly reduced the distance traveled by the charcoal through the intestines, consistent with the action of a MOR agonist 5.07 ± 0.57 cm, compared to 29.5 ± 1 cm for saline-treated mice; F2,21 = 81.88, p < 0.0001; one-way ANOVA with Dunnett’s multiple-comparison test. In contrast, compound 6 (SC13) was without significant effect (30.8 ± 2.52 cm). (E) Respiratory rate. Mice were administered either vehicle (n = 12), morphine (30 mg/kg, sc; n = 12), or 6 (SC13) (45 mg/kg, sc; n = 12), and the breath rates was measured every 20 min for 180 min. Morphine administered sc caused reduction in the breath rate with respect to saline at 20 min (**p = 0.0021), 40 min (***p = 0.0003) and 60 min (**p = 0.0010) post drug administration. 6 (SC13) (45 mg/kg, sc) was not significantly different from vehicle control except at 180 (****p < 0.0001) and 200 min (*p = 0.0410) where it showed an increase in breath rates as determined by 2-way ANOVA followed by Dunnett’s multiple-comparison test. (F) Locomotor effect. Mice were administered either saline (n = 20), vehicle (n = 24), morphine (10 and 30 mg/kg, sc; n = 12 each), and 6 (SC13) (45 mg/kg, sc; n = 12), and the distance traveled by each group of mice was measured. No significant locomotor effects were observed with 6 (SC13) as determined by two-way ANOVA followed by Dunnett’s multiple-comparison test in comparison to the vehicle, while morphine showed significant hyperlocomotion at every time point compared to saline (p < 0.0001).
(G) Oral antinociceptive time course. Groups of C57BL/6 J mice were orally (po) administered 6 (SC13) at 10 mg/kg and antinociception measured using the 55 °C tail withdrawal assay. 6 (SC13) showed antinociception with 87% MPE at peak time point. Data are shown as mean % antinociception ± SEM. Effect of 6 (SC13) at a dose of 10 mg/kg (n = 13) with repeated measures over time.
At doses 5-fold higher than their ED50 antinociceptive values, 6 (SC13) (15 mg/kg, sc) showed no signs of CPP or CPA, whereas morphine (10 mg/kg, IP) showed CPP and U50,488H showed CPA, as expected (Figure 4C). In GI transit assays tested at ED80 antinociceptive doses, morphine inhibited gastrointestinal passage, while the effects of 6 (SC13) and saline were indistinguishable from each other (Figure 4D).
Compounds were next evaluated for respiratory depression and hyperlocomotion in mice using the computer-controlled Comprehensive Lab Animal Monitoring System (CLAMS) assay.28 At a dose 15-fold higher than the antinociceptive ED50 value, 6 (SC13) showed no statistically significant respiratory effects, whereas morphine at an equivalent dosage (30 mg/kg, sc) showed significant respiratory depression for 60 min after administration (Figure 4E). Similarly, 6 (SC13) showed no hyperlocomotion at a dose 15-fold higher than the antinociceptive ED50 value, in contrast to the prototypic MOR agonist morphine, which showed hyperlocomotion effects at doses 5-fold and 15-fold higher than its antinociceptive ED50 value (Figure 4F).
Oral administration of 6 (SC13) (10 mg/kg, po) also showed an antinociceptive efficacy (Emax = 87% MPE at 30 min) nearly equivalent to the efficacy of subcutaneous 6 (SC13) at the same dose (Emax = 100% at 20 min), suggesting possibly good plasma exposure through the oral route. (Figure 4G). The antinociceptive time courses observed following administration by each route were also similar. The results are consistent with the good oral activity usually seen with the mitragynine template20,43 and reported metabolic stability of this template.20 Overall, the MOR partial agonist, 6 (SC13) with an efficacy of ~10% (BRET-Nb33 assays, Figure S1J) in murine MOR showed equi-efficacious antinociception compared to morphine with 70% efficacy (BRET-Nb33 assays, Figure S1J) while showing greatly attenuated opioid-induced adverse effects in mice.
DISCUSSION
Opioids and their activation of opioid receptors continue to be investigated as treatments of acute to moderate pain despite their numerous and often serious adverse effects. In recent years, biased agonism has been proposed as an avenue to dissociate respiratory depression from analgesia.44-46 However, recent studies have raised concerns about this hypothesis.45,47,48 Mice lacking β-arrestin2 were reported to retain respiratory depression mediated by morphine,49 and mice with MOR C-tail mutations that inhibit arrestin recruitment still show respiratory depression as well as tolerance50 in contrast to previous reports.51
Extending these concerns, we had previously reported the kratom alkaloids mitragynine, 7OH, and MP to be G-protein-biased agonists.18,19,23 However, recent reports with other putative G-protein-biased agonists such as SR17018, PZM21, and TRV130 have suggested that these ligands are in fact MOR partial agonists with low intrinsic efficacy compared to DAMGO when assessed in a less-amplified G-protein signaling system.5
Here, we used the mitragynine template to test this low-efficacy partial agonism hypothesis and whether such an approach can lead to MOR agonists with reduced side effect liability but maintained analgesia. We developed a SAR based on the aromatic ring of mitragynine and the 7OH template and identified three C9-diversified analogs 4, 5, and 6 (SC13).
In amplified cAMP assays, our analogs showed full agonism at MOR compared to DAMGO. Similar observations of cAMP measurements greatly overestimating efficacy in the presence of receptor reserve have been reported previously52 and are consistent with receptor theory.53 Using a less-amplified TRUPATH assay, we find that the three lead analogs have less efficacy relative to DAMGO, fentanyl, and morphine but higher efficacy than buprenorphine, a well characterized partial agonist at MOR.54
The lead analogs, 4, 5, and 6 (SC13) also showed arrestin recruitment with poor potency when assessed using TANGO (an assay with amplified signaling), but this β-arrestin2 recruitment activity was significantly reduced or altogether absent when quantified in the less-amplified DiscoverX Pathhunter or BRET-based assays.
Typical opioid receptor functional assays that utilize cAMP and [35S]GTPγS often fail to account for simultaneous signaling through various Gα subunits.55 It is difficult to recapitulate the complexity of in vivo signaling due to cell line limitations, namely, the differential expression of specific Gα subunits in various cell types. For example, CHO and HEK cell lines show differential expression of Gz and Gαo subtypes.35 The BRET-based TRUPATH assay enabled us to study the activity of each of the Gα-subtypes in isolation.34 We determined that 4, 5, and 6 (SC13) show lower efficacy than DAMGO, morphine, or fentanyl at each Gi/o subtype. At GoA and GoB, buprenorphine (Emax = 65–66%) and 4, 5, and 6 (SC13) (Emax = 63–75%) had comparable intrinsic efficacy, which is of interest since the most abundant Gα subunit in the brain is GoA.56 Similarly at Gz too, buprenorphine (Emax = 81%) and our synthetic analogs 4, 5, and 6 (SC13) (Emax = 79–86%) had similar efficacies.
In mice, 6 (SC13) was equipotent to morphine in antinociception assays. The role of Gz in opioid induced antinociception is poorly understood, although Gz knock-out (KO) mice have reduced opioid antinociception in a tail withdrawal test similar to the one used here,57 and DAMGO preferentially signals through Gz over Gi-2 in periaqueductal grey membranes.58 The role these Gα subtypes play in in vivo responses to 4, 5, and 6 (SC13) is uncertain at this point; however, the overall Gα-subtype efficacy profile does appear similar to the well-characterized MOR partial agonist buprenorphine.
The partial agonism of 4, 5, and 6 (SC13) was confirmed in a BRET-based Nb33 recruitment, an assay which has been shown to accurately reflect efficacy without signal amplification.5 In these assays, using either hMOR or mMOR, 4, 5, and 6 (SC13) was found to have similar efficacy to buprenorphine. While the putatively biased MOR ligands SR17018, TRV130, and PZM21 were not evaluated in our study, we infer that 4, 5, and 6 (SC13) may have efficacy similar to SR17018 (20%) but lower than either TRV130 (42%) or PZM21 (38%).5 Similarly, 4, 5, and 6 (SC13) were found to have lower intrinsic efficacy than DAMGO and morphine in VTA synaptic effects, corroborating our cell line-based findings in an endogenous system with physiologically relevant levels of receptor reserve. Behaviorally, 6 (SC13) showed MOR-dependent antinociception and potency similar to morphine while showing none of the adverse effects associated with morphine at equianalgesic equivalent doses. This pattern is reminiscent of that of buprenorphine, which is known to show a ceiling effect in respiratory depression59 and is generally considered a safer analgesic60 although it still shows hyperlocomotion,61 constipation,61 and reward-like behavior in rodents.62 Of note, it is not yet clear if the preferable properties of buprenorphine result solely from its partial agonism at MOR5,63 or because of its additional actions such as DOR61 and KOR61 antagonism or weak NOP agonism.64 Buprenorphine’s pharmacology is further complicated by its metabolism to norbuprenorphine65,66 (a lower potency but much higher efficacy metabolite) as well as other active metabolites such as buprenorphine 3-glucuronide.67 Furthermore, the oral activity of buprenorphine is limited due to its metabolism to norbuprenorphine,68 unlike 6 (SC13), which under tested conditions in mice is orally as active as when given subcutaneously. Together, the present results suggest additional benefits of 6 (SC13) over buprenorphine while also validating the further investigation of MOR-selective partial agonists as analgesics with fewer liabilities.
CONCLUSIONS
In summary, using the mitragynine template and unamplified signaling assays, we identified partial MOR agonists that appear to functionally dissociate MOR-dependent analgesia from locomotor activation and respiratory depression. While additional mechanisms extending beyond MOR and Gα signaling cannot be ruled out, our studies corroborate findings by Gillis and colleagues5 suggesting that low G-protein efficacy at MOR may lead to a favorable therapeutic window of new opioids.
EXPERIMENTAL SECTION
Drugs and Chemicals.
Opiates were provided by the Research Technology Branch of the National Institute on Drug Abuse (Rockville, MD). Selective opioid antagonists were purchased from Tocris Bioscience. Miscellaneous chemicals and buffers were purchased from Sigma-Aldrich. Kratom “Red Indonesian Micro Powder” was purchased from Moon Kratom (Austin, TX).
Chemistry.
All chemicals were purchased from Sigma-Aldrich Chemicals and used without further purification. Reactions were carried out in flame-dried reaction flasks under Ar. Reaction mixtures were purified by silica flash chromatography on E. Merck 230–400 mesh silica gel 60 using a Teledyne ISCO CombiFlash Rf instrument with UV detection at 280 and 254 nm. RediSep Rf silica gel normal phase columns were used. The yields reported are isolated yields. NMR spectra were recorded on a Varian 400/500 MHz NMR spectrometer. NMR spectra were processed with MestReNova software. The chemical shifts were reported as δ ppm relative to TMS using the residual solvent peak as the reference unless otherwise noted (CDCl3 1H: 7.26, 13C: 77.3). Peak multiplicity is reported as follows: s, singlet; d, doublet; t, triplet; q, quartet; m, multiplet. Coupling constants (J) are expressed in Hz. High-resolution mass spectra were obtained on a Bruker Daltonics 10 Tesla Apex Qe Fourier transform ion cyclotron resonance-mass spectrometer by electrospray ionization (ESI). Accurate masses are reported for the molecular ion [M + H]+. All compounds are >95% pure by HPLC. Purity (≥95%) was confirmed using high-pressure liquid chromatography (HPLC) Agilent 1200 Series HPLC with a quaternary pump, diode-array detector, and a Higgins Analytical CLIPEUS C18 column (5 μm, 150 × 4.6 mm), mobile phase: solvent A: water (0.1% trifluoroacetic acid) (95), solvent B: acetonitrile (5), flow rate: 0.65 mL/min, and gradient: 5–95% acetonitrile/water.
Semi-Synthesis of C9 Analogs.
Kratom “Red Indonesian Micro Powder” was purchased from Moon Kratom (Austin, TX). Mitragynine (1) was extracted from dry kratom powder using a modified protocol reported by Váradi et al.19 A total of 500 g of kratom powder was used to isolate 4.5 g of mitragynine along with other alkaloids. 1 was converted to 9-hydroxymitragynine using AlCl3 and ethanethiol in DCM using a literature-reported procedure.16 This hydroxy compound was converted to its triflate (7) using N-phenyl-bis(trifluoromethanesulfonimide) and Et3N in DCM, which was subsequently used as the precursor for further reactions.
As shown in Figure 1B, 9-phenyl mitragynine (9) was synthesized in 65% yield using palladium-catalyzed Suzuki coupling reaction of triflate 7 with phenylboronic acid. 9 was then converted to the corresponding 7OH derivative 4 in 33% yield using oxone and aqueous NaHCO3. The synthesis of 9-3′-furanyl mitragynine (8) was accomplished by a similar palladium-catalyzed reaction of triflate 7 with 3-furanylboronic acid. Alcohol 6 (SC13) was obtained via oxidation of 8 using oxone and aqueous NaHCO3. To install the methyl group at C9, we used DABAL-Me3 as the methyl donor. Palladium-catalyzed coupling reaction of triflate 7 with DABAL-Me3 in the presence of XPhos afforded 9-methyl mitragynine (10) in 68% isolated yield. Oxidation of compound 10 using oxone and aqueous NaHCO3 resulted in hydroxide 5.
Semi-Synthesis of C10 Analogs.
To have access to the C10 position of the mitragynine scaffold, we incorporated bromide selectively at the C10 position using Takayama’s protocol.3 Mitragynine (1) was converted to mitragynine–ethylene glycol adduct using PIFA and ethylene glycol (Figure 1C) followed by bromination with NBS in DMF and gave 10-bromo derivative 1133 in 74% yield along with 24% of 12-bromo derivative. In this adduct, the indole’s double bond is temporarily masked by an ethylene glycol group. The deprotection of 11 to 10-bromo mitragynine (12)33 was carried out by a mild reductive condition using NaBH3CN. 1H NMR of 12 was in good agreement with the literature-reported value.33 LH NMR (500 MHz, chloroform-d) δ 7.86 (s, 1H), 7.43 (s, 1H), 7.18 (d, J = 8.5 Hz, 1H), 6.94 (d, J = 8.5 Hz, 1H), 3.92 (s, 3H), 3.74 (s, 3H), 3.71 (s, 3H), 3.19–3.08 (m, 2H), 3.07–3.01 (m, 2H), 3.00–2.90 (m, 2H), 2.59–2.43 (m, 3H), 1.84–1.74 (m, 2H), 1.66–1.62 (m, 1H), 1.24–1.18 (m, 1H), 0.87 (t, J = 7.4 Hz, 3H).
10-Bromo mitragynine 12, was submitted to different coupling reactions to furnish analogs of C10 mitragynine. 10-Phenyl mitragynine (13) was synthesized in 71% yield using palladium-catalyzed coupling reaction of bromide 12 with phenylboronic acid. 13 was then treated with oxone and aqueous NaHCO3 to furnish the corresponding 7OH derivative 16 in 31% yield. The synthesis of 10-3′-furyl mitragynine (14) was accomplished by a similar palladium-catalyzed reaction of bromide 12 with 3-furanylboronic acid. Treatment of 14 with oxone and aqueous NaHCO3 produced alcohol 17. The methyl group at the C10 position was introduced by DABAL-Me3. Palladium-catalyzed coupling reaction of bromide 12 with DABAL-Me3 in the presence of XPhos afforded 10-methyl mitragynine (15) in 77% isolated yield. Oxidation of 15 using oxone and aqueous NaHCO3 resulted in alcohol 18.
Semi-Synthesis of C12 Analogs.
For the C12 derivatives, as shown in Figure 1D, mitragynine (1) was brominated directly in the presence of NBS and AcOH to afford mainly 12-bromo mitragynine (19) in 47% yield. Synthesis of 12-phenyl mitragynine (20) was achieved in 67% yield using palladium-catalyzed coupling reaction of bromide 19 with phenylboronic acid. Oxone- and aqueous NaHCO3-mediated hydroxylation of 20 furnished the corresponding 7OH derivative 23 in 41% yield. The synthesis of 12-3′-furanyl mitragynine (21) was done by a similar palladium-catalyzed reaction of bromide 19 with 3-furanylboronic acid. 21 on treatment with oxone and aqueous NaHCO3 furnished alcohol 24. The methyl group at the C12 position was installed by the coupling reaction of bromide 19 with DABAL-Me3 in the presence of XPhos to afford 12-methyl mitragynine (22) in 87% isolated yield. Oxidation of 22 using oxone and aqueous NaHCO3 yielded alcohol 25 in 55% yield.
Semi-Synthesis of Individual Embodiments.
Methyl(E)-2-((2S,3S,12bS)-3-ethyl-8-(((trifluoromethyl)sulfonyl)oxy)-1,2,3,4,6,7,12,12b-octahydroindolo[2,3-a]quinolizin-2-yl)-3-methoxyacrylate (7). N-Phenyl-bis(trifluoromethanesulfonimide) (66.4 mg, 0.18 mmol) was added to a solution of 9-hydroxymitragynine (65 mg, 0.16 mmol) dissolved in DCM (3 mL) under argon at RT. Et3N (0.07 mL, 0.50 mmol) was added to the mixture, and the reaction was continued overnight. MS indicated the completion of the reaction. Then, the solvent was evaporated and the reaction mixture was diluted in EtOAc (20 mL) and was washed with brine (5 × 20 mL), dried over anhydrous Na2SO4, and filtered. The solvent was removed, and the residue was purified by flash column chromatography using 20–60%EtOAc in hexane to get the desired triflate 7 as a white solid 53 mg; (yield, 61%). Since this is an intermediate compound, we recorded only proton NMR. 1H NMR (400 MHz, chloroform-d) δ (s, 1H), 7.44 (d, J = 0.8 Hz, 1H), 7.28 (dt, J = 8.0, 0.8 Hz, 1H), 7.07 (dd, J = 8.5, 7.6 Hz, 1H), 6.98 (d, J = 7.9 Hz, 1H), 3.74 (s, 3H), 3.71 (s, 3H), 3.23–3.10 (m, 2H), 3.02 (tt, J = 17.0, 4.9 Hz, 3H), 2.91 (dd, J = 15.4, 3.6 Hz, 1H), 2.62–2.51 (m, 2H), 2.47 (dd, J = 11.7, 3.1 Hz, 1H), 1.85–1.69 (m, 2H), 1.69–1.60 (m, 1H), 1.25–1.16 (m, 1H), 0.87 (t, J = 7.3 Hz, 3H). HRMS (ESI-TOF) m/z: [M + H]+ calcd for C23H28F3N2O6S 517.1620; found 517.1611.
Methyl(E)-2-((2S,3S,12bS)-3-ethyl-8-(furan-3-yl)-1,2,3,4,6,7,12,12b-octahydroindolo[2,3-a]quinolizin-2-yl)-3-methoxyacrylate (8).
7 (77.5 mg, 0.15 mmol) was dissolved in dry toluene (0.5 mL), and the solvent was removed under reduced pressure to ensure azeotropic removal of water residues. Dry methanol (1 mL) and dry toluene (1.5 mL) were added. To the resulting solution were added 3-furanylboronic acid (17.9 mg, 0.16 mmol, 1.1 equiv), K2CO3 (41.5 mg, 2 equiv), and Pd(PPh3)4 (8.7 mg, 0.05 equiv). The mixture was stirred at 80 °C for 8 h. The solvent was evaporated under reduced pressure and the residue was extracted with DCM (3 × 20 mL). The combined extracts were washed with brine (3 × 1/3 vol.), dried (Na2SO4), and concentrated to provide the crude product. The crude product was purified by flash column chromatography (gradient: 25–70% EtOAc in hexanes) to yield 47.6 mg (73%) of 8 as a yellow amorphous solid. 1H NMR (400 MHz, chloroform-d) δ 7.81 (s, 1H), 7.55–7.50 (m, 1H), 7.47 (d, J = 1.0 Hz, 1H), 7.44 (d, J = 0.9 Hz, 1H), 7.30–7.27 (m, 1H), 7.11 (dd, J = 8.1, 7.2 Hz, 1H), 7.00–6.96 (m, 1H), 6.62–6.58 (m, 1H), 3.74 (s, 3H), 3.71, (s, 3H), 3.17 (d, J = 11.3 Hz, 1H), 3.02 (ddd, J = 20.5, 11.0, 2.9 Hz, 2H), 2.91–2.80 (m, 2H), 2.55 (q, J = 12.5 Hz, 1H), 2.46–2.36 (m, 3H), 1.84 (d, J = 13.4 Hz, 1H), 1.78 (dt, J = 13.3, 5.8 Hz, 1H), 1.63 (d, J = 11.4 Hz, 1H), 1.25–1.19 (m, 1H), 0.86 (t, J = 7.3 Hz, 3H). 13C NMR (125 MHz, chloroform-d) δ 169.40, 160.75, 142.12, 140.18, 136.49, 136.30, 125.82, 125.76, 125.38, 121.33, 121.17, 113.22, 111.70, 110.25, 108.36, 61.77, 61.72, 58.00, 53.94, 51.57, 40.84, 40.17, 30.21, 24.92, 19.36, 13.03. HRMS (ESI-TOF) m/z: [M + H]+ calcd for C26H31N2O4 435.2278; found 435.2273.
Methyl(E)-2-((2S,3S,12bS)-3-ethyl-8-phenyl-1,2,3,4,6,7,12,12b-octahydroindolo[2,3-a]quinolizin-2-yl)-3-methoxyacrylate (9).
7 (77.5 mg, 0.15 mmol) was dissolved in dry toluene (0.5 mL), and the solvent was removed under reduced pressure to ensure azeotropic removal of water residues. Dry methanol (1 mL) and dry toluene (1.5 mL) were added. To the resulting solution were added phenylboronic acid (19.5 mg, 0.16 mmol, 1.1 equiv), K2CO3 (41.5 mg, 2 equiv), and Pd(PPh3)4 (8.7 mg, 0.05 equiv). The mixture was stirred at 80 °C for 8 h. The solvent was evaporated under reduced pressure, and the residue was extracted with DCM (3 × 20 mL). The combined extracts were washed with brine (3 × 1/3 vol), dried (Na2SO4), and concentrated to provide the crude product. The crude product was purified by flash column chromatography (gradient: 25–70% EtOAc in hexanes) to yield 43.3 mg (65%) of 9 as a light yellow amorphous solid. 1H NMR (400 MHz, chloroform-d) δ 7.83 (s, 1H), 7.50–7.33 (m, 6H), 7.30 (d, J = 8.0 Hz, 1H), 7.15 (t, J = 7.7 Hz, 1H), 6.98 (d, J = 7.2 Hz, 1H), 3.74 (s, 3H), 3.71 (s, 3H), 3.17 (d, J = 11.3 Hz, 1H), 3.04 (dt, J = 13.1, 3.7 Hz, 1H), 2.97 (dd, J = 11.7, 2.2 Hz, 1H), 2.78–2.73 (m, 1H), 2.71–2.64 (m, 1H), 2.55 (q, J = 12.6 Hz, 1H), 2.41 (dd, J = 11.3, 3.1 Hz, 1H), 2.33 (td, J = 10.7, 10.2, 4.1 Hz, 1H), 2.01–1.94 (m, 1H), 1.85 (d, J = 12.9 Hz, 1H), 1.81–1.71 (m, 2H), 1.22 (d, J = 8.0 Hz, 1H), 0.85 (t, J = 7.3 Hz, 3H). 13C NMR (100 MHz, chloroform-d) δ 169.18, 160.54, 141.67, 136.19, 136.06, 134.96, 129.77, 127.44, 126.59, 125.24, 121.00, 120.86, 111.46, 109.76, 108.17, 61.58, 61.52, 57.74, 53.69, 51.37, 40.60, 39.93, 30.00, 24.68, 19.15, 12.83. HRMS (ESI-TOF) m/z: [M + H]+ calcd for C28H33N2O3 445.2486; found 445.2484.
Methyl(E)-2-((2S,3S,12bS)-3-ethyl-8-methyl-1,2,3,4,6,7,12,12b-octahydroindolo[2,3-a]quinolizin-2-yl)-3-methoxyacrylate (10).
Starting material 7 (77.5 mg, 0.15 mmol), Pd2(dba)3 (13.7 mg, 0.1 equiv), Xphos (10.7 mg, 0.15 equiv), and DABAL-Me3 (153.8 mg, 4 equiv) were balanced into an oven-dried vial. The vial was purged with argon, and dry THF (3 mL) was added under argon. The vial was sealed with a Teflon-lined screw cap and heated to 60 °C. After stirring for 8 h, complete conversion was observed by LC–MS. The reaction mixture was cooled to RT and concentrated in vacuo. The product was purified by flash column chromatography (gradient: 25–75% EtOAc in hexanes) to yield 39 mg (68%) of 10 as a yellow solid. 1H NMR (400 MHz, chloroform-d) δ 7.73 (s, 1H), 7.43 (s, 1H), 7.10 (d, J = 8.1 Hz, 1H), 6.97 (t, J = 7.6 Hz, 1H), 6.78 (d, J = 6.6 Hz, 1H), 3.72 (s, 3H), 3.71 (s, 3H), 3.29–3.14 (m, 2H), 3.08–2.93 (m, 4H), 2.62 (s, 3H), 2.59–2.43 (m, 3H), 1.84–1.74 (m, 2H), 1.64 (dd, J = 8.7, 5.4 Hz, 1H), 1.27–1.17 (m, 1H), 0.87 (t, J = 7.3 Hz, 3H). 13C NMR (100 MHz, chloroform-d) δ 169.22, 160.57, 135.85, 134.92, 130.35, 126.50, 121.23, 120.38, 111.43, 108.44, 108.30, 61.55, 61.34, 57.70, 53.76, 51.37, 40.60, 39.85, 29.89, 24.43, 19.56, 19.10, 12.85. HRMS (ESI-TOF) m/z: [M + H]+ calcd for C23H31N2O3 383.2329; found 383.2327.
Methyl(E)-2-((2S,3S,7aS,12bS)-3-ethyl-7a-hydroxy-8-phenyl-1,2,3,4,6,7,7a,12b-octahydroindolo[2,3-a]quinolizin-2-yl)-3-methoxyacrylate (4).
A saturated aq NaHCO3 (3 mL) was added to a solution of 9 (44.4 mg, 0.10 mmol) in acetone (4 mL) at 0 °C, resulting in suspension formation. A solution of oxone (30.6 mg, 0.20 mmol) in distilled water (1 mL) was added dropwise over a 5 min period (this is crucial for the reaction! Slower addition is better). The reaction mixture was stirred for an additional 30 min at 0 °C. Then, the content was diluted with water (2–3 mL) and the product was extracted in ethyl acetate (3 × 10 mL). The EtOAc layer was washed with brine (15 mL), dried over anhydrous Na2SO4, and filtered. The solvent was removed under reduced pressure, and the content was purified by flash column chromatography (gradient: 25–65% EtOAc in hexanes) to yield 15.2 mg (33%) of 4 as a white solid. 1H NMR (500 MHz, chloroform-d) δ 7.59–7.51 (m, 3H), 7.46–7.41 (m, 3H), 7.41–7.35 (m, 2H), 7.13 (dd, J = 7.8, 0.9 Hz, 1H), 3.81 (s, 3H), 3.69 (s, 3H), 3.09 (dd, J = 11.1, 2.6 Hz, 1H), 3.04–2.95 (m, 2H), 2.81 (td, J = 13.6, 11.0 Hz, 1H), 2.64–2.56 (m, 1H), 2.46 (ddd, J = 11.9, 4.7, 2.3 Hz, 1H), 2.41 (dd, J = 11.4, 3.0 Hz, 1H), 2.05 (d, J = 1.5 Hz, 1H), 1.99–1.90 (m, 2H), 1.67 (ddd, J = 13.5, 11.2, 7.0 Hz, 1H), 1.57 (d, J = 11.2 Hz, 1H), 1.49 (td, J = 13.3, 4.1 Hz, 1H), 1.28–1.19 (m, 1H), 0.79 (t, J = 7.3 Hz, 3H). 13C NMR (100 MHz, chloroform-d) δ 183.99, 169.30, 160.76, 154.17, 139.44, 139.33, 137.29, 129.61, 129.33, 128.11, 127.61, 127.57, 120.36, 111.24, 80.98, 61.80, 61.48, 58.15, 51.32, 50.07, 40.47, 39.21, 34.85, 26.07, 18.93, 12.78. HRMS (ESI-TOF) m/z: [M + H]+ calcd for C28H33N2O4 461.2435; found 461.2431. HPLC Purity 99%.
Methyl(E)-2-((2S,3S,7aS,12bS)-3-ethyl-7a-hydroxy-8-methyl-1,2,3,4,6,7,7a,12b-octahydroindolo[2,3-a]quinolizin-2-yl)-3-methoxyacrylate (5).
A saturated aq NaHCO3 (3 mL) was added to a solution of 10 (38.2 mg, 0.10 mmol) in acetone (4 mL) at 0 °C, resulting in suspension formation. A solution of oxone (30.6 mg, 0.20 mmol) in distilled water (1 mL) was added dropwise over a 5 min period. The reaction mixture was stirred for additional 30 min at 0 °C. Then, the content was diluted with water (2–3 mL) and the product was extracted in ethyl acetate (3 × 10 mL). The EtOAc layer was washed with brine (15 mL), dried over anhydrous Na2SO4, and filtered. The solvent was removed under reduced pressure, and the content was purified by flash column chromatography (gradient: 25–65% EtOAc in hexanes) to yield 16.7 mg (42%) of 5 as a white solid. 1H NMR (400 MHz, chloroform-d) δ 7.44 (s, 1H), 7.38 (d, J = 7.6 Hz, 1H), 7.21 (t, J = 7.6 Hz, 1H), 6.95 (d, J = 7.7 Hz, 1H), 3.81 (s, 3H), 3.67 (s, 3H), 3.13 (dd, J = 10.7, 2.4 Hz, 1H), 3.08–2.97 (m, 2H), 2.86–2.75 (m, 2H), 2.68–2.59 (m, 2H), 2.48 (d, J = 11.6 Hz, 1H), 2.45 (s, 3H), 2.09–2.07(m, 1H), 1.86 (d, J = 13.2 Hz, 1H), 1.68–1.55 (m, 3H), 1.21 (dd, J = 7.2, 5.6 Hz, 1H), 0.82 (t, J = 7.3 Hz, 3H). 13C NMR (100 MHz, chloroform-d) δ 184.01, 169.32, 160.78, 153.58, 138.01, 134.44, 129.39, 127.89, 118.78, 111.20, 81.30, 61.81, 61.44, 58.16, 51.30, 50.11, 40.51, 39.32, 34.94, 26.06, 18.95, 17.11, 12.82. HRMS (ESI-TOF) m/z: [M + H]+ calcd for C23H31N2O4 399.2278; found 399.2277. HPLC purity 96%.
Methyl(E)-2-((2S,3S,7aS,12bS)-3-ethyl-8-(furan-3-yl)-7a-hydroxy-1,2,3,4,6,7,7a,12b-octahydroindolo[2,3-a]quinolizin-2-yl)-3-methoxyacrylate 6 (SC13).
A saturated aq NaHCO3 (3 mL) was added to a solution of 8 (43.4 mg, 0.10 mmol) in acetone (4 mL) at 0 °C, resulting in suspension formation. A solution of oxone (30.6 mg, 0.20 mmol) in distilled water (1 mL) was added dropwise over a 5 min period. The reaction mixture was stirred for an additional 30 min at 0 °C. Then, the content was diluted with water (2–3 mL) and the product was extracted in ethyl acetate (3 × 10 mL). The EtOAc layer was washed with brine (15 mL), dried over anhydrous Na2SO4, and filtered. The solvent was removed under reduced pressure, and the content was purified by flash column chromatography (gradient: 25–65% EtOAc in hexanes) to yield 17.1 mg (38%) of 6 (SC13) as a white solid. 1H NMR (500 MHz, chloroform-d) δ 8.05 (dd, J = 1.6, 0.9 Hz, 1H), 7.50–7.48 (m, 2H), 7.44 (s, 1H), 7.34 (t, J = 7.7 Hz, 1H), 7.24 (dd, J = 7.8, 1.0 Hz, 1H), 6.87 (dd, J = 1.9, 0.9 Hz, 1H), 3.82 (s, 3H), 3.68 (s, 3H), 3.14 (dd, J = 11.0, 2.5 Hz, 1H), 3.06–2.99 (m, 2H), 2.88–2.71 (m, 2H), 2.62–2.55 (m, 2H), 2.46 (dd, J = 11.4, 3.1 Hz, 1H), 2.22 (s, 1H), 1.90 (dd, J = 13.6, 3.2 Hz, 1H), 1.68 (ddt, J = 14.1, 11.8, 7.1 Hz, 2H), 1.45 (td, J = 13.5, 12.8, 4.7 Hz, 1H), 1.26–1.19 (m, 1H), 0.81 (t, J = 7.3 Hz, 3H). 13C NMR (100 MHz, chloroform-d) δ 184.10, 169.31, 160.80, 154.40, 142.99, 141.72, 136.55, 129.85, 129.63, 126.11, 123.43, 120.12, 111.19, 111.12, 81.19, 61.81, 61.40, 58.14, 51.31, 50.05, 40.48, 39.30, 32.67, 26.09, 18.95, 12.81. HRMS (ESI-TOF) m/z: [M + H]+ calcd for C26H31N2O5 451.2227; found 451.2224. HPLC purity 99%.
Methyl(E)-2-((2S,3S,12bS)-3-ethyl-8-methoxy-9-phenyl-1,2,3,4,6,7,12,12b-octahydroindolo[2,3-a]quinolizin-2-yl)-3-methoxyacrylate (13).
Starting material 12 (71.6 mg, 0.15 mmol), phenylboronic acid (40.2 mg, 2.2 equiv), KOAc (33.8 mg, 2.3 equiv), and Pd(dppf)Cl2·CH2Cl2 (6.1 mg, 0.05 equiv) were balanced into an oven-dried vial. The vial was purged with argon, and dry THF (3 mL) was added under a stream of argon. The vial was closed with a Teflon-lined solid screw cap and heated to 70 °C. After 6 h, LC–MS and TLC indicated full consumption of the starting material. The solvent was evaporated under reduced pressure, and the residue was extracted with DCM (3 × 20 mL). The combined extracts were washed with brine (3 × 1/3 vol), dried (Na2SO4), and concentrated to provide the crude product. The crude product was purified by flash column chromatography (gradient: 25–70% EtOAc in hexanes) to yield 50.5 mg (71%) of 13 as a yellow amorphous solid. 1H NMR (400 MHz, chloroform-d) δ 7.77 (s, 1H), 7.65–7.58 (m, 2H), 7.44–7.38 (m, 3H), 7.30 (d, J = 7.5 Hz, 1H), 7.14–7.06 (m, 2H), 3.74 (s, 3H), 3.72 (s, 3H), 3.51 (s, 3H), 3.19 (d, J = 11.9 Hz, 2H), 3.09–2.93 (m, 4H), 2.63–2.45 (m, 3H), 1.87–1.75 (m, 2H), 1.64 (d, J = 11.4 Hz, 1H), 1.25–1.17 (m, 1H), 0.88 (t, J = 7.3 Hz, 3H). 13C NMR (100 MHz, chloroform-d) δ 169.18, 160.53, 151.01, 139.65, 137.39, 135.53, 129.55, 128.05, 126.13, 125.13, 124.33, 121.50, 111.49, 107.48, 107.06, 61.65, 61.57, 61.32, 57.81, 53.75, 51.37, 40.67, 39.92, 29.92, 23.57, 19.14, 12.88. HRMS (ESI-TOF) m/z: [M + H]+ calcd for C29H35N2O4 475.2591; found 475.2586.
Methyl(E)-2-((2S,3S, 12bS)-3-ethyl-9-(furan-3-yl)-8-methoxy-1,2,3,4,6,7,12,12b-octahydroindolo[2,3-a]quinolizin-2-yl)-3-methoxyacrylate (14).
Starting material 12 (71.6 mg, 0.15 mmol), 3-furanylboronic acid (36.9 mg, 2.2 equiv), KOAc (33.8 mg, 2.3 equiv), and Pd(dppf)Cl2·CH2Cl2 (6.1 mg, 0.05 equiv) were balanced into an oven-dried vial. The vial was purged with argon, and dry THF (3 mL) was added under a stream of argon. The vial was closed with a Teflon-lined solid screw cap and heated to 70 °C. After 6 h, LC–MS and TLC indicated full consumption of the starting material. The solvent was evaporated under reduced pressure, and the residue was extracted with DCM (3 × 20 mL). The combined extracts were washed with brine (3 × 1/3 vol.), dried (Na2SO4), and concentrated to provide the crude product. The crude product was purified by flash column chromatography (gradient: 25–70% EtOAc in hexanes) to yield 41.1 mg (59%) of 14 as a light yellow solid. 1H NMR (400 MHz, chloroform-d) δ 7.76 (s, 1H), 7.68 (s, 1H), 7.56–7.51 (m, 1H), 7.43 (s, 1H), 7.03 (d, J = 7.9 Hz, 1H), 6.71–6.67 (m, 1H), 6.50 (d, J = 8.4 Hz, 1H), 3.89 (s, 3H), 3.73 (s, 3H), 3.70 (s, 3H), 3.19–2.90 (m, 6H), 2.58–2.43 (m, 3H), 1.82–1.74 (m, 2H), 1.63 (br s, 1H), 1.23–1.16 (m, 1H), 0.87 (t, J = 7.3 Hz, 3H). 13C NMR (100 MHz, chloroform-d) δ 169.18, 160.56, 154.05, 143.49, 138.21, 134.97, 133.97, 123.82, 121.18, 117.80, 111.44, 110.33, 109.48, 108.79, 100.22, 61.57, 61.36, 57.79, 55.43, 53.70, 51.35, 40.75, 39.84, 29.97, 23.87, 19.15, 12.88. HRMS (ESI-TOF) m/z: [M + H]+ calcd for C27H33N2O5 465.2384; found 465.2381.
Methyl(E)-2-((2S,3S,12bS)-3-ethyl-8-methoxy-9-methyl-1,2,3,4,6,7,12,12b-octahydroindolo[2,3-a]quinolizin-2-yl)-3-methoxyacrylate (15).
Starting material 12 (71.6 mg, 0.15 mmol), Pd2(dba)3 (13.7 mg, 0.1 equiv), Xphos (10.7 mg, 0.15 equiv), and DABAL- Me3 (153.8 mg, 4 equiv) were balanced into an oven-dried vial. The vial was purged with argon, and dry THF (3 mL) was added under argon. The vial was sealed with a Teflon-lined screw cap and heated to 60 °C. After stirring for 8 h, complete conversion was observed by LC–MS. The reaction mixture was cooled to RT and concentrated in vacuo. The product was purified by flash column chromatography (gradient: 25–75% EtOAc in hexanes) to yield 31.8 mg (77%) of 15 as a yellow solid. 1H NMR (400 MHz, chloroform-d) δ 7.68 (s, 1H), 7.43 (s, 1H), 6.97 (d, J = 10.3 Hz, 1H), 6.88 (d, J = 8.1 Hz, 1H), 3.84 (s, 3H), 3.73 (s, 3H), 3.71 (s, 3H), 3.16 (d, J = 10.8 Hz, 2H), 3.08–3.00 (m, 2H), 2.95 (d, J = 12.5 Hz, 2H), 2.58–2.43 (m, 3H), 2.34 (s, 3H), 1.82–1.75 (m, 2H), 1.63 (d, J = 11.8 Hz, 1H), 1.23–1,19 (m, 1H), 0.88 (t, J = 7.2 Hz, 3H). 13C NMR (100 MHz, chloroform-d) δ 169.21, 160.54, 151.43, 136.58, 135.03, 124.29, 119.95, 111.46, 106.80, 106.47, 61.74, 61.57, 61.40, 57.82, 51.36, 40.64, 39.94, 29.85, 23.46, 19.14, 15.10, 12.88. HRMS (ESI-TOF) m/z: [M + H]+ calcd for C24H33N2O4 413.2435; found 413.2433.
Methyl(E)-2-((2S,3S,7aS,12bS)-3-ethyl-7a-hydroxy-8-methoxy-9-phenyl-1,2,3,4,6,7,7a, 12b-octahydroindolo[2,3-a]quinolizin-2-yl)-3-methoxyacrylate (16).
A saturated aq NaHCO3 (3 mL) was added to a solution of 13 (47.4 mg, 0.10 mmol) in acetone (4 mL) at 0 °C, resulting in suspension formation. A solution of oxone (30.6 mg, 0.20 mmol) in distilled water (1 mL) was added dropwise over a 5 min period. The reaction mixture was stirred for an additional 30 min at 0 °C. Then, the content was diluted with water (2–3 mL) and the product was extracted in ethyl acetate (3 × 10 mL). The EtOAc layer was washed with brine (15 mL), dried over anhydrous Na2SO4, and filtered. The solvent was removed under reduced pressure, and the content was purified by flash column chromatography (gradient: 25–65% EtOAc in hexanes) to yield 15.1 mg (31%) of 16 as a white solid. 1H NMR (400 MHz, chloroform-d) δ 7.60–7.54 (m, 2H), 7.47–7.30 (m, 6H), 3.82 (s, 3H), 3.70 (s, 3H), 3.47 (s, 3H), 3.18–3.12 (m, 1H), 3.05 (t, J = 13.0 Hz, 2H), 2.89–2.78 (m, 2H), 2.66 (t, J = 14.2 Hz, 2H), 2.53–2.47 (m, 1H), 2.30 (s, 1H), 1.91 (d, J = 13.6 Hz, 1H), 1.86–1.67 (m, 3H), 1.25 (d, J = 5.5 Hz, 1H), 0.83 (t, J = 7.3 Hz, 3H). 13C NMR (100 MHz, chloroform-d) δ 184.21, 169.30, 160.75, 154.66, 154.25, 138.06, 132.92, 132.81, 132.36, 128.93, 128.42, 127.23, 117.27, 111.28, 81.10, 61.81, 61.60, 61.43, 58.21, 51.31, 50.13, 40.55, 39.28, 36.35, 26.10, 18.97, 12.83. HRMS (ESI-TOF) m/z: [M + H]+ calcd for C29H35N2O5 491.2540; found 491.2542.
Methyl(E)-2-((2S,3S,7aS,12bS)-3-ethyl-9-(furan-3-yl)-7a-hydroxy-8-methoxy-1,2,3,4,6,7,7a,12b-octahydroindolo[2,3-a]quinolizin-2-yl)-3-methoxyacrylate (17).
A saturated aq NaHCO3 (3 mL) was added to a solution of 14 (46.4 mg, 0.10 mmol) in acetone (4 mL) at 0 °C, resulting in suspension formation. A solution of oxone (30.6 mg, 0.20 mmol) in distilled water (1 mL) was added dropwise over a 5 min period. The reaction mixture was stirred for an additional 30 min at 0 °C. Then, the content was diluted with water (2–3 mL) and the product was extracted in ethyl acetate (3 × 10 mL). The EtOAc layer was washed with brine (15 mL), dried over anhydrous Na2SO4, and filtered. The solvent was removed under reduced pressure, and the content was purified by flash column chromatography (gradient: 25–65% EtOAc in hexanes) to yield 16.8 mg (35%) of 17 as a white solid. 1H NMR (400 MHz, chloroform-d) δ 8.36 (s, 1H), 7.50–7.38 (m, 3H), 6.92 (s, 1H), 6.76 (d, J = 8.5 Hz, 1H), 3.89 (s, 3H), 3.84 (s, 3H), 3.72 (s, 3H), 3.11 (d, J = 10.7 Hz, 1H), 3.07–2.98 (m, 2H), 2.96–2.89 (m, 1H), 2.80 (t, J = 12.1 Hz, 1H), 2.64 (d, J = 12.2 Hz, 2H), 2.49 (d, J = 11.4 Hz, 1H), 1.95 (d, J = 13.6 Hz, 1H), 1.76–1.61 (m, 4H), 1.21 (t, J = 6.7 Hz, 1H), 0.82 (t, J = 7.2 Hz, 3H). 13C NMR (100 MHz, chloroform-d) δ 183.61, 169.56, 160.82, 154.70, 151.65, 142.60, 141.92, 128.39, 127.51, 122.41, 118.88, 111.85, 109.50, 81.28, 61.69, 61.64, 58.19, 55.79, 51.49, 50.21, 40.62, 39.71, 36.54, 26.49, 19.17, 13.05. HRMS (ESI-TOF) m/z: [M + H]+ calcd for C27H33N2O6 481.2333; found 481.2328.
Methyl(E)-2-((2S,3S,7aS,12bS)-3-ethyl-7a-hydroxy-8-methoxy-9-methyl-1,2,3,4,6,7,7a,12b-octahydroindolo[2,3-a]quinolizin-2-yl)-3-methoxyacrylate (18).
A saturated aq NaHCO3 (3 mL) was added to a solution of 15 (41.2 mg, 0.10 mmol) in acetone (4 mL) at 0 °C, resulting in suspension formation. A solution of oxone (30.6 mg, 0.20 mmol) in distilled water (1 mL) was added dropwise over a 5 min period. The reaction mixture was stirred for an additional 30 min at 0 °C. Then, the content was diluted with water (2–3 mL) and the product was extracted in ethyl acetate (3 × 10 mL). The EtOAc layer was washed with brine (15 mL), dried over anhydrous Na2SO4, and filtered. The solvent was removed under reduced pressure, and the content was purified by flash column chromatography (gradient: 25–65% EtOAc in hexanes) to yield 18.8 mg (44%) of 18 as a white solid. 1H NMR (400 MHz, chloroform-d) δ 7.44 (s, 1H), 7.23 (d, J = 7.7 Hz, 1H), 7.14 (d, J = 7.7 Hz, 1H), 3.89 (s, 3H), 3.81 (s, 3H), 3.68 (s, 3H), 3.14–2.96 (m, 3H), 2.86–2.74 (m, 2H), 2.70–2.59 (m, 2H), 2.47 (dd, J = 11.5, 3.1 Hz, 1H), 2.29 (s, 3H), 1.87 (d, J = 13.6 Hz, 1H), 1.77–1.64 (m, 3H), 1.59 (d, J = 11.7 Hz, 1H), 1.24–1.18 (m, 1H), 0.82 (t, J = 7.3 Hz, 3H). 13C NMR (100 MHz, chloroform-d) δ 183.05, 169.32, 160.76, 155.27, 153.54, 132.35, 131.68, 129.29, 116.99, 111.24, 80.92, 61.79, 61.73, 61.50, 58.19, 51.30, 50.19, 40.52, 39.30, 36.06, 26.10, 18.95, 15.77, 12.81. HRMS (ESI-TOF) m/z: [M + H]+ calcd for C24H33N2O5 429.2384; found 429.2380.
Methyl(E)-2-((2S,3S,12bS)-11-bromo-3-ethyl-8-methoxy-1,2,3,4,6,7,12,12b-octahydroindolo[2,3-a]quinolizin-2-yl)-3-methoxyacrylate (19).
Mitragynine (800 mg, 2.007 mmol) was dissolved in glacial acetic acid (8 mL). Then, NBS (535.78 mg, 3.01 mmol, 1.5 eq) was added to the mixture under argon. The mixture was stirred for 4 h at RT. MS indicated the formation of bromomitragynine. The reaction mixture was basified with sat. aq NaHCO3 solution, and the product was extracted with DCM (3 × 20 mL). The DCM layer was washed with brine (15 mL), dried over anhydrous Na2SO4, and filtered. The solvent was removed under reduced pressure, and the crude product was purified by flash column chromatography using 10–25% EtOAc in hexanes. Fractions 3–18 gave 450 mg (47%) of 12-bromomitragynine (19), while fractions 23–38 contained 10-bromomitragynine (~5%; with minor impurities). Since compound 7 is an intermediate compound, we recorded only proton NMR. 1H NMR (400 MHz, chloroform-d) δ 7.84–7.73 (m, 1H), 7.44 (s, 1H), 7.10 (d, J = 8.3 Hz, 1H), 6.36 (d, J = 8.3 Hz, 1H), 3.85 (s, 3H), 3.75 (s, 3H), 3.71 (s, 3H), 3.17 (d, J = 11.6 Hz, 1H), 3.12–2.99 (m, 3H), 2.97–2.87 (m, 2H), 2.57–2.42 (m, 3H), 1.85 (dt, J = 12.8, 3.1 Hz, 1H), 1.81–1.73 (m, 1H), 1.66–1.64 (m, 1H), 1.25–1.19 (m, 1H), 0.87 (t, J = 7.3 Hz, 3H). HRMS (ESI-TOF) m/z: [M + H]+ calcd for C23H30BrN2O6 477.1383; found 477.1380.
Methyl(E)-2-((2S,3S,12bS)-3-ethyl-8-methoxy-11-phenyl-2,3,4,6,7,12,12b-octahydroindolo[2,3-a]quinolizin-2-yl)-3-methoxyacrylate (20).
19 (71.6 mg, 0.15 mmol) was dissolved in dry toluene (0.5 mL), and the solvent was removed under reduced pressure to ensure azeotropic removal of water residues. Dry methanol (1 mL) and dry toluene (1.5 mL) were added. To the resulting solution were added phenylboronic acid (19.5 mg, 0.16 mmol, 1.1 equiv), K2CO3 (41.5 mg, 2 equiv), and Pd(PPh3)4 (8.7 mg, 0.05 equiv). The mixture was stirred at 80 °C for 8 h. The solvent was evaporated under reduced pressure, and the residue was extracted with DCM (3 × 20 mL). The combined extracts were washed with brine (3 × 1/3 vol), dried (Na2SO4), and concentrated to provide the crude product. The crude product was purified by flash column chromatography (gradient: 25–70% EtOAc in hexanes) to yield 47.7 mg (67%) of 20 as a light yellow solid. 1H NMR (400 MHz, chloroform-d) δ 7.87 (s, 1H), 7.59 (dd, J = 8.0, 1.4 Hz, 2H), 7.47 (t, J = 7.6 Hz, 2H), 7.40 (d, J = 0.8 Hz, 1H), 7.37–7.32 (m, 1h), 7.02 (d, J = 7.9 Hz, 1H), 6.55 (d, J = 8.0 Hz, 1H), 3.91 (s, 3H), 3.70 (s, 3H), 3.68 (s, 3H), 3.20–3.11 (m, 2H), 3.06–2.98 (m, 3H), 2.93 (dd, J = 11.3, 5.5 Hz, 1H), 2.59–2.51 (m, 1H), 2.46 (dd, J = 11.3, 2.7 Hz, 2H), 1.82–1.69 (m, 2H), 1.61 (s, 1H), 1.28–1.16 (m, 1H), 0.86 (t, J = 7.4 Hz, 3H). 13C NMR (100 MHz, chloroform-d) δ 169.15, 160.47, 154.16, 139.68, 134.72, 133.93, 127.99, 127.99, 126.63, 122.03, 118.82, 117.75, 111.42, 108.55, 100.35, 61.47, 61.39, 57.80, 55.35, 53.70, 51.25, 40.75, 39.81, 29.93, 23.90, 19.13, 12.85. HRMS (ESI-TOF) m/z: [M + H]+ calcd for C29H35N2O4 475.2591; found 475.2590.
Methyl(E)-2-((2S,3S,12bS)-3-ethyl-11-(furan-3-yl)-8-methoxy-1,2,3,4,6,7,12,12b-octahydroindolo[2,3-a]quinolizin-2-yl)-3-methoxyacrylate (21).
19 (71.6 mg, 0.15 mmol) was dissolved in dry toluene (0.5 mL), and the solvent was removed under reduced pressure to ensure azeotropic removal of water residues. Dry methanol (1 mL) and dry toluene (1.5 mL) were added. To the resulting solution were added 3-furanylboronic acid (17.9 mg, 0.16 mmol, 1.1 equiv), K2CO3 (41.5 mg, 2 equiv), and Pd(PPh3)4 (8.7 mg, 0.05 equiv). The mixture was stirred at 80 °C for 8 h. The solvent was evaporated under reduced pressure, and the residue was extracted with DCM (3 × 20 mL). The combined extracts were washed with brine (3 × 1/3 vol), dried (Na2SO4), and concentrated to provide the crude product. The crude product was purified by flash column chromatography (gradient: 25–70% EtOAc in hexanes) to yield 48 mg (69%) of 21 as a yellow amorphous solid. 1H NMR (500 MHz, chloroform-d) δ 7.75 (s, 1H), 7.68 (dd, J = 1.5, 0.9 Hz, 1H), 7.54 (t, J = 1.7 Hz, 1H), 7.43 (s, 1H), 7.03 (d, J = 8.0 Hz, 1H), 6.70 (dd, J = 1.8, 0.9 Hz, 1H), 6.50 (d, J = 8.0 Hz, 1H), 3.90 (s, 3H), 3.73 (s, 3H), 3.70 (s, 3H), 3.21–3.09 (m, 2H), 3.09–2.96 (m, 3H), 2.93 (dd, J = 11.3, 5.6 Hz, 1H), 2.58–2.44 (m, 3H), 1.84–1.74 (m, 2H), 1.62 (s, 1H), 1.21 (dddd, J = 13.5, 7.4, 3.3, 1.0 Hz, 1H), 0.87 (t, J = 7.4 Hz, 3H). 13C NMR (100 MHz, chloroform-d) δ 169.18, 160.59, 154.07, 143.53, 138.19, 135.00, 134.01, 123.84, 121.19, 117.83, 111.48, 110.31, 109.51, 108.81, 100.22, 61.53, 61.38, 57.81, 55.48, 53.71, 51.31, 40.78, 39.87, 30.00, 23.90, 19.17, 12.89. HRMS (ESI-TOF) m/z: [M + H]+ calcd for C27H33N2O5 465.2384; found 465.2383.
Methyl(E)-2-((2S,3S,12bS)-3-ethyl-8-methoxy-11-methyl-2,3,4,6,7,12,12b-octahydroindolo[2,3-a]quinolizin-2-yl)-3-methoxyacrylate (22).
Starting material 19 (71.6 mg, 0.15 mmol), Pd2(dba)3 (13.7 mg, 0.1 equiv), Xphos (10.7 mg, 0.15 equiv), and DABAL-Me3 (153.8 mg, 4 equiv) were balanced into an oven-dried vial. The vial was purged with argon, and dry THF (3 mL) was added under argon. The vial was sealed with a Teflon-lined screw cap and heated to 60 °C. After stirring for 8 h, complete conversion was observed by LC–MS. The reaction mixture was cooled to RT and concentrated in vacuo. The product was purified by flash column chromatography (gradient: 25–75% EtOAc in hexanes) to yield 35.9 mg (87%) of 22 as a yellow solid. 1H NMR (500 MHz, chloroform-d) δ 7.52 (s, 1H), 7.44 (s, 1H), 6.78 (dd, J = 7.8, 1.0 Hz, 1H), 6.38 (d, J = 7.8 Hz, 1H), 3.85 (s, 3H), 3.74 (s, 3H), 3.71 (s, 3H), 3.18 (dd, J = 11.4, 2.3 Hz, 1H), 3.15–3.00 (m, 3H), 2.99–2.88 (m, 2H), 2.57–2.43 (m, 3H), 2.37 (s, 3H), 1.87–1.75 (m, 2H), 1.62 (d, J = 10.6 Hz, 1H), 1.21 (dddd, J = 12.3, 11.2, 5.0, 2.8 Hz, 1H), 0.88 (d, J = 7.3 Hz, 3H). 13C NMR (100 MHz, chloroform-d) δ 169.20, 160.48, 152.93, 136.41, 133.48, 121.86, 117.11, 112.85, 111.57, 108.50, 99.90, 61.54, 61.38, 57.79, 55.49, 53.75, 51.35, 40.74, 39.87, 30.00, 23.87, 19.11, 16.07, 12.86. HRMS (ESI-TOF) m/z: [M + H]+ calcd for C24H33N2O4 413.2435; found 413.2436.
Methyl(E)-2-((2S,3S,7aS,12bS)-3-ethyl-7a-hydroxy-8-methoxy-11-phenyl-1,2,3,4,6,7,7a,12b-octahydroindolo[2,3-a]quinolizin-2-yl)-3-methoxyacrylate (23).
A saturated aq NaHCO3 (3 mL) was added to a solution of 20 (47.4 mg, 0.10 mmol) in acetone (4 mL) at 0 °C resulting in suspension formation. A solution of oxone (30.6 mg, 0.20 mmol) in distilled water (1 mL) was added dropwise over a 5 min period. The reaction mixture was stirred for an additional 30 min at 0 °C. Then, the content was diluted with water (2–3 mL), and the product was extracted in ethyl acetate (3 × 10 mL). The EtOAc layer was washed with brine (15 mL), dried over anhydrous Na2SO4, and filtered. The solvent was removed under reduced pressure, and the content was purified by flash column chromatography (gradient: 25–65% EtOAc in hexanes) to yield 20.1 mg (41%) of 23 as a white solid. 1H NMR (400 MHz, chloroform-d) δ 7.87 (d, J = 7.1 Hz, 2H), 7.48 (d, J = 8.6 Hz, 1H), 7.43–7.37 (m, 3H), 7.30 (d, J = 7.4 Hz, 1H), 6.82 (d, J = 8.6 Hz, 1H), 3.91 (s, 3H), 3.78 (s, 3H), 3.70 (s, 3H), 3.13–3.07 (m, 1H), 3.06–2.94 (m, 2H), 2.88–2.77 (m, 2H), 2.70–2.61 (m, 2H), 2.48 (d, J = 11.4 Hz, 1H), 1.90 (d, J = 13.8 Hz, 1H), 1.79–1.61 (m, 4H), 1.21 (d, J = 7.2 Hz, 1H), 0.82 (t, J = 7.2 Hz, 3H). 13C NMR (100 MHz, chloroform-d) δ 183.40, 169.36, 160.56, 155.07, 151.97, 137.82, 130.84, 129.44, 127.86, 127.26, 127.12, 126.64, 111.54, 109.30, 80.99, 61.47, 61.33, 57.99, 55.51, 51.20, 50.02, 40.34, 39.47, 36.19, 26.06, 18.93, 12.82. HRMS (ESI-TOF) m/z: [M + H]+ calcd for C29H35N2O5 491.2540; found 491.2542.
Methyl(E)-2-((2S,3S,7aS,12bS)-3-ethyl-11-(furan-3-yl)-7a-hydroxy-8-methoxy-1,2,3,4,6,7,7a,12b-octahydroindolo[2,3-a]-quinolizin-2-yl)-3-methoxyacrylate (24).
A saturated aq NaHCO3 (3 mL) was added to a solution of 21 (46.4 mg, 0.10 mmol) in acetone (4 mL) at 0 °C, resulting in suspension formation. A solution of oxone (30.6 mg, 0.20 mmol) in distilled water (1 mL) was added dropwise over a 5 min period. The reaction mixture was stirred for additional 30 min at 0 °C. Then, the content was diluted with water (2–3 mL) and the product was extracted in ethyl acetate (3 × 10 mL). The EtOAc layer was washed with brine (15 mL), dried over anhydrous Na2SO4, and filtered. The solvent was removed under reduced pressure, and the content was purified by flash column chromatography (gradient: 25–65% EtOAc in hexanes) to yield 21.6 mg (45%) of 24 as a white solid. 1H NMR (500 MHz, chloroform-d) δ 8.35 (dd, J = 1.6, 0.8 Hz, 1H), 7.46 (s, 1H), 7.45–7.42 (m, 2H), 6.92 (dd, J = 1.9, 0.8 Hz, 1H), 6.75 (d,J = 8.6 Hz, 1H), 3.88 (s, 3H), 3.83 (s, 3H), 3.72 (s, 3H), 3.11 (dd,J = 11.0, 2.6 Hz, 1H), 3.05–2.98 (m, 2H), 2.96–2.87 (m, 1H), 2.84–2.77 (m, 1H), 2.63 (ddt, J = 13.8, 6.5, 2.3 Hz, 2H), 2.49 (ddd, J = 11.4, 3.1, 1.0 Hz, 1H), 2.18 (s, 1H), 1.95 (dtd, J = 13.5, 3.0, 1.2 Hz, 1H), 1.74–1.63 (m, 3H), 1.25–1.20 (m, 1H), 0.82 (t, J = 7.3 Hz, 3H). 13C NMR (100 MHz, chloroform-d) δ 183.61, 169.56, 160.82, 154.70, 151.65, 142.60, 141.92, 128.39, 127.51, 122.41, 118.88, 111.85, 109.50, 109.29, 81.28, 61.69, 61.64, 58.19, 55.79, 51.49, 50.21, 40.62, 39.71, 36.54, 26.49, 19.17, 13.05. HRMS (ESI-TOF) m/z: [M + H]+ calcd for C27H33N2O6 481.2333; found 481.2329.
Methyl(E)-2-((2S,3S,7aS,12bS)-3-ethyl-7a-hydroxy-8-methoxy-11-methyl-1,2,3,4,6,7,7a,12b-octahydroindolo[2,3-a]quinolizin-2-yl)-3-methoxyacrylate (25).
A saturated aq NaHCO3 (3 mL) was added to a solution of 22 (41.2 mg, 0.10 mmol) in acetone (4 mL) at 0 °C, resulting in suspension formation. A solution of oxone (30.6 mg, 0.20 mmol) in distilled water (1 mL) was added dropwise over a 5 min period. The reaction mixture was stirred for an additional 30 min at 0 °C. Then, the content was diluted with water (2–3 mL) and the product was extracted in ethyl acetate (3 × 10 mL). The EtOAc layer was washed with brine (15 mL), dried over anhydrous Na2SO4, and filtered. The solvent was removed under reduced pressure, and the content was purified by flash column chromatography (gradient: 25–65% EtOAc in hexanes) to yield 23.6 mg (55%) of 25 as a white solid. 1H NMR (400 MHz, chloroform-d) δ 7.44 (s, 1H), 7.04 (d, J = 7.6 Hz, 1H), 6.61 (d, J = 8.6 Hz, 1H), 3.82 (s, 3H), 3.81 (s, 3H), 3.71 (s, 3H), 3.04 (ddd, J = 13.6, 10.9, 7.5 Hz, 3H), 2.87–2.73 (m, 2H), 2.66–2.56 (m, 2H), 2.50–2.45 (m, 1H), 2.44 (s, 3H), 1.94–1.87 (m, 1H), 1.77–1.66 (m, 2H), 1.66–1.56 (m, 2H), 1.27–1.21 (m, 1H), 0.82 (t, J = 7.3 Hz, 3H). 13C NMR (100 MHz, chloroform-d) δ 169.29, 160.52, 153.91, 153.03, 131.77, 126.22, 123.41, 111.56, 108.67, 81.22, 61.66, 61.55, 58.18, 55.42, 51.27, 50.10, 40.52, 39.28, 35.85, 25.98, 18.98, 15.73, 12.81. HRMS (ESI-TOF) m/z: [M + H]+ calcd for C24H33N2O5 429.2384; found 429.2380.
In Vitro Pharmacology Assays.
cAMP and TANGO.36
To measure Glo-sensor Gαi-mediated cAMP inhibition, HEK 293T (ATCC CRL-11268) cells were co-transfected with human opioid receptor (hMOR, hKOR, and hDOR) along with a luciferase-based cAMP biosensor and the assay was performed as reported previously.36 Next, the arrestin recruitment Tango assay was carried out using HTLA cells expressing TEV fused-β-arrestin2 that were transfected with human opioid receptors (hMOR, hKOR, or hDOR) as the Tango construct by following previously reported protocols.36
BRET2 Assays34.
Cells were plated either in 6-well dishes at a density of 700,000–800,000 cells per well or 10 cm dishes at 7–8 million cells per dish. Cells were transfected 2–4 h later, using a 1:1:1:1 DNA ratio of receptor:Gα-RLuc8:Gβ:Gγ-GFP2 (100 ng per construct for 6-well dishes, 750 ng per construct for 10 cm dishes), except for the Gγ-GFP2 screen, where an ethanol co-precipitated mixture of Gβ1–4 was used at twice its normal ratio (1:1:2:1). Transit 2020 (Mirus Biosciences) was used to complex the DNA at a ratio of 3 μL Transit per μg DNA, in OptiMEM (Gibco-ThermoFisher) at a concentration of 10 ng DNA per μL OptiMEM. The next day, cells were harvested from the plate using Versene (0.1 M PBS + 0.5 mM EDTA, pH 7.4) and plated in poly-d-lysine-coated white, clear-bottom 96-well assay plates (Greiner Bio-One) at a density of 30,000–50,000 cells per well. One day after plating in 96-well assay plates, white backings (PerkinElmer) were applied to the plate bottoms, and the growth medium was carefully aspirated and replaced immediately with 60 μL of assay buffer (1× Hank’s balanced salt solution (HBSS) + 20 mM HEPES, pH 7.4) followed by a 10 μL addition of freshly prepared 50 μM coelenterazine 400a (Nanolight Technologies). After a 5 min equilibration period, the cells were treated with 30 μL of drug for an additional 5 min. The plates were then read in an LB940 Mithras plate reader (Berthold Technologies) with 395 (RLuc8-coelenterazine 400a) and 510 nm (GFP2) emission filters at integration times of 1 s per well. Plates were read serially six times, and measurements from the sixth read were used in all analyses. BRET2 ratios were computed as the ratio of the GFP2 emission to RLuc8 emission.
BRET-Based Nb33 Recruitment Assays.
Experiments were performed as described previously.69 Briefly, transfected cells were dissociated and resuspended in phosphate-buffered saline. Cells were added to a black-framed, white well 96-well plate (no. 60050; Perkin Elmer; Waltham, MA, USA). At time zero, the luciferase substrate coelenterazine H (5 μM) was added to each well. Ligands were added after 5 min, and then BRET signal was measured 10 min later. BRET measurements were performed using a PHERAstar FS plate reader (BMG Labtech, Cary, NC, USA). The BRET signal was calculated as the ratio of the light emitted by the mVenus acceptor (510–540 nm) over the light emitted by the NanoLuc donor (475 nm). Dose–response curves were fit using a three-parameter logistic equation in GraphPad Prism 8 (Graphpad Software, La Jolla, CA, USA). All experiments were repeated in at least three independent trials each with triplicate determinations.
Materials.
HEK-293T cells were obtained from the American Type Culture Collection (Rockville, MD, USA) and were cultured in a 5% CO2 atmosphere at 37 °C in Dulbecco’s modified Eagle medium (DMEM, high glucose, #11965; Life Technologies; Grand Island, NY, USA) supplemented with 10% fetal bovine serum (#35-010-CV, Corning, Corning, NY, USA), 100 IU mL−1 penicillin, and 100 μg mL−1 streptomycin (#30–002-CI; Corning, Corning, NY, USA). The following chemicals were used without further modification: [d-Ala,2 N-Me-Phe,4 Gly5-ol]-enkephalin (DAMGO; #78123–71-4,Abcam,-Cambridge, United Kingdom), Buprenorphine hydrochloride (#B9275, Sigma-Aldrich, St. Louis, MO, USA), morphine sulfate (#M1167, Spectrum Chemicals, New Brunswick, NJ, USA), coelenterazine H (#DC-001437, Dalton Pharma Services, Toronto, ON, Canada), polyethylenimine (PEI; #NC1014320, Polysciences, Warrington, PA, USA).
DNA Constructs.
The expression vector coding for mouse MOR tagged at the C-terminus with Nanoluc (mMOR-nluc) by a Gly-Ser linker was constructed using standard techniques in molecular biology and confirmed by DNA sequencing (Psomagen, Brooklyn, NY, USA). Briefly, two DNA inserts were PCR amplified, one coding for mMOR with an N terminal signal peptide followed by a FLAG tag, and the other coding for NanoLuc. The two inserts were joined by PCR amplification, and the resulting insert coding mMOR-nluc was cloned into the Hind III and Xho I sites of pcDNA3.1 (+) (#V79020, ThermoFisher Scientific, Waltham, MA, USA). The plasmid coding for human MOR-nanoluc (hMOR-nluc) was a gift from Dr. Nevin Lambert at the Medical College of Georgia. The plasmid coding for the nanobody-33-Venus (Nb-33) construct5 was a gift from Dr. Meritxell Canals at the University of Nottingham.
Transfection.
A total of 5 μg of cDNA was transiently transfected into HEK-293 T cells (2 × 10⁶ cells per plate) in 10 cm dishes (1 μg receptor-nluc, and 4 μg Nb-33-Venus), using PEI in a 6:1 ratio (diluted in DMEM). Cells were maintained in the HEK-293T media described above. Experiments were performed 48 h after transfection.
Pathhunter Assays.
β-Arrestin recruitment assays were performed as previously described.70 In brief, CHO-K1-human μOR cells (DiscoverX) were grown to confluency and seeded at a density of 2500 cells in a low-volume 384 well plate (10 μL per well). After incubating overnight at 37 °C with 5% CO2, a 5× dilution series of compounds prepared in opti-MEM was added (2.5 μL per well) and incubated at 37 °C for an additional 90 min. PathHunter detection reagent (DiscoverX) was prepared according to the manufacturer’s protocol and added (6 μL per well). Following a 60 min room temperature incubation in the dark, the chemiluminescence signal was measured using a FlexStation3 plate reader.
Competitive Radioligand Binding Assay.
Membrane isolation and binding assays were performed as previously described.71 In brief, membranes were isolated from CHO cells stably expressing the μOR (DiscoverX). To harvest membranes, cells were dislodged from a T75 flask and pelleted via centrifugation at 1300 rpm for 5 min at 20 °C (Eppendorf 5804R). The supernatant was aspirated, and the cell pellet was resuspended in assay buffer (50 mM Tris HCl, 10 mM MgCl2, 1 mM EDTA, pH 7.4) and thoroughly sonicated (Qsonica XL-2000, level 3.) Membranes were isolated from the resulting suspension via ultracentrifugation at 20,000 rpm for 30 min at 4 °C (Optima L-100 XP Ultracentrifuge, SW 41 Ti, 41,000 rpm rotor). The supernatant was aspirated, and the resulting membrane pellets were resuspended in assay buffer on ice by thorough sonication, pushed through a 28-gauge needle, and stored in 1 mL aliquots at −80 °C until the day of binding assay. Each T75 flask yielded approximately one 1 mL aliquot. On assay days, a 4× dilution series of compounds made in assay buffer was added to a 96-well plate (50 μL per well, added in duplicate.) Tritiated radioligand ([3H]DAMGO for MOR) diluted in assay buffer was added to the 96-well plate (50 μL per well) at a concentration near the EC80 value for the receptor: 2.325 nM [3H]DAMGO. Next, a membrane aliquot was thawed on ice, diluted in assay buffer (1:10, approximate protein concentration of 70 μg/mL) followed by thorough sonication, and the resulting membrane suspension was added to the plate (100 μL per well, approximately 7 μg protein). After adding the membrane suspension, the plate contents were incubated at room temperature for 90 min. The membrane mixture was then filtered over a 0.3% PEI pretreated GF-B/C plate (#6005174, Perkin Elmer, Waltham, MA, USA) with a cell harvester system. After the GF-B/C plate was dried overnight, scintillation fluid was added (50 μL per well, Ultimagold uLLT) and radioactivity was measured using a scintillation counter (Hewlett Packard TopCount NXT). For the competitive binding assays, all data were analyzed with GraphPad 8 (GraphPad Prism software, La Jolla, CA). Both assays were run in duplicate in a minimum of three independent assays. Data from each independent assay were normalized to a positive control, and then all independent assays were averaged and compiled into a composite figure. Data is presented as means ± SEM.
EPhys Assays.
Electrophysiology Animals.
Eight male Sprague–Dawley rats were used for whole cell electrophysiology recordings; procedures were conducted in strict accordance with the recommendations of the National Institutes Health (NIH) in the Guide for the Care and Use of Laboratory Animals. Research protocols were approved by the Institutional Animal Care and Use Committee (University of California at San Francisco, CA), approval ID AN183735-01B.
Slice Preparation and Ex Vivo Whole Cell electrophysiology.72
Rats were anesthetized with isoflurane, and their brains were removed. Horizontal brain slices (200 μm thick) containing the VTA were prepared using a vibratome (Leica Microsystems). Slices were submerged in artificial CSF solution containing (in mM): 126 NaCl, 2.5 KCl, 1.2 MgCl, 1.4 NaH2PO4, 2.5 CaCl2, 25 NaHCO3 and 11 glucose saturated with 95% O2–5% CO2 and allowed to recover at 33 °C for at least 1 h. Individual slices were visualized under a Zeiss AxioExaminer.D1 with differential interference contrast, Dodt, and near-infrared optics using a monochrome Axiocam 506 or under a Zeiss Axioskop FS 2 plus with differential interference contrast optics and infrared illumination equipped with a Zeiss Axiocam MRm (Zeiss International).Whole-cell patch-clamp recordings were made at 33 °C using 2.5–5 MΩ pipettes containing (in mM) 128 KCl, 20 NaCl, 1 MgCl2, 1 EGTA, 0.3 CaCl2, 10 HEPES, 2 MgATP, and 0.3 Na3GTP (pH 7.2, osmolarity adjusted to 275). Signals were amplified using an IPA amplifier with SutterPatch software (Sutter Instrument) filtered at 1 kHz and collected at 10 kHz or using an Axopatch 1-D (Molecular Devices), filtered at 2 kHz, and collected at 20 kHz using custom written procedures for IGOR Pro (Wavemetrics). Cells were recorded in voltage-clamp mode (V −70 mV). Series resistance and input resistance were sampled throughout the experiment with 4 mV, 200 ms hyperpolarizing steps. GABAA receptor-mediated inhibitory postsynaptic potentials (IPSCs) were pharmacologically isolated with 6,7-dinitroquinoxaline-2,3(1H,4H)-dione (DNQX: 10 μM). Stimulating electrodes were placed 80–250 μm anterior or posterior to the soma of the recorded neuron. To measure drug effects on evoked IPSCs, paired pulses (50 ms interval) were delivered once every 10 s. The IPSC amplitude was calculated by comparing the peak PSC voltage to a 2 ms interval just before stimulation. All drugs were bath applied. Drug effects were quantified by comparing the mean evoked IPSC amplitude during the 4 min of baseline just preceding drug application and the mean response amplitudes during minutes 4–7 of drug application.
Mice.
C57BL/6J mice (20–32 g each) were obtained from Jackson Laboratories (Bar Harbor, ME). MOR KO, KOR KO, and DOR KO were bred in the laboratory of Dr. McLaughlin at University of Florida. All mice used throughout the manuscript were opioid naïve. All mice were maintained on a 12 h light/dark cycle with Purina rodent chow and water available ad libitum and housed in groups of five until testing. All animal studies were preapproved by the Institutional Animal Care and Use Committees of the University of Florida, in accordance with the 2002 National Institutes of Health Guide for the Care and Use of Laboratory Animals.
Antinociception.
The 55 °C warm-water tail-withdrawal assay was conducted in C57BL/6J mice as a measure of acute thermal antinociception as described previously.19 Briefly, each mouse was tested for baseline tail-withdrawal latency prior to drug administration. Following drug administration, the latency for each mouse to withdraw the tail was measured every 10 min until latency returned to the baseline value. A maximum response time of 15 s was utilized to prevent tissue damage. If the mouse failed to display a tail-withdrawal response within 15 s, the tail was removed from the water and the animal was assigned a maximal antinociceptive score of 100%. Data are reported as percent antinociception, calculated by the equation: % antinociception = 100 × [(test latency – baseline latency)/(15 – baseline latency)]. This was utilized to account for innate variability between mice. Compounds were administered subcutaneously (sc) or orally (po), and the analgesic action of compounds was assessed at the peak effect.
Respiratory Depression and Locomotor Effects Assessment.
Respiration rates and spontaneous ambulation rates were monitored using the automated, computer-controlled Comprehensive Lab Animal Monitoring System (CLAMS) (Columbus Instruments, Columbus, OH) as described previously.28 Freely moving mice were habituated in closed, sealed individual apparatus cages (23.5 cm × 11/5 cm × 13 cm) for 60 min before testing. To start testing, mice were administered (sc) drug or vehicle and 5 min later confined to the CLAMS testing cages for 120 min. Using a pressure transducer built into the sealed CLAMS cage, the respiration rate (breaths/min) of each occupant mouse was measured. Infrared beams located in the floor measured locomotion as ambulations, from the number of sequential breaks of adjacent beams. Data are expressed as the percent of vehicle control response.
Conditioned Place Preference and Aversion.
Mice were conditioned with a counterbalanced place conditioning paradigm using a similar timing as detailed previously. A group of mice (n = 18–24) were habituated to freely explore both sides of a two-compartment apparatus for 3 h each for 2 days prior testing. The amount of time subjects spent in each of three compartments was measured over a 20 min testing period. Prior to place conditioning, the animals did not demonstrate significant differences in their time spent exploring the left vs right compartments. During each of the next 2 days, mice were administered vehicle (0.9% saline) and consistently confined in a randomly assigned outer compartment for 20 min, half of each group in the right chamber and half in the left chamber. Four hours later, mice were administered drugs morphine (10 mg/kg/d, IP), U50,488 h (30 mg/kg/d, IP), and 6 (SC13) (15 mg/kg/d, sc) and were confined to the opposite compartment for 20 min. Conditioned place preference data are presented as the difference in time spent in drug- and vehicle-associated chambers and were analyzed via repeated measure two-way ANOVA with the difference in time spent on the treatment- vs vehicle-associated side as the dependent measure and conditioning status as the between groups factor. Where appropriate, Tukey’s HSD or Sidak’s multiple comparison post hoc tests were used to assess group differences. Effects were considered significant when p < 0.05. All effects are expressed as mean ± SEM.
Assessment of Gastrointestinal Transit.
C57BL/6 J mice (8 per drug treatment) were administered morphine (10 mg/kg, sc), saline (0.9%, sc), or 6 (SC13) (15 mg/kg, sc) 20 min prior to oral gavage with 0.3 mL of a 5% aqueous solution of charcoal meal. After 3 h, mice were euthanized and the intestines removed. The progression of charcoal through the intestines was measured as distance traveled from the jejunum to the cecum as utilized elsewhere.73
Computational Studies.
Molecular Docking.
The crystal structure of active murine MOR bound to BU72 (PDB id: 5C1M) was prepared for molecular docking of 8, 9, 10, 4, 5, 6 (SC13), 11-F, morphine, and buprenorphine, using the protocol we recently reported in the literature for docking and simulations of kratom alkaloids, including mitragynine and 7OH.22 Molecular docking of morphine and buprenorphine was achieved by overlapping core heavy atoms onto the co-crystal compound BU72. In contrast, 8, 9, 10, 4, 5, 6 (SC13), and 11-F were aligned onto mitragynine and 7OH binding poses that had been previously obtained22 using the Binding Pose Metadynamics module in Schrödinger suite 2019-274 for metadynamics rescoring of initial docking poses obtained with DOCK6.9.
Molecular Dynamics Simulations.
Unbiased MD simulations of ligand–MOR complexes embedded in a POPC bilayer and solvated in a 10 × 10 × 10 Å3 orthorhombic box of simple point charge (SPC) water molecules and 0.15 M NaCl buffer in each dimension were carried out using the OPLS3e force-field and the Desmond software within the Schrödinger suite 2019-2.40 Systems were neutralized with chloride ions using the System Builder function, and missing dihedral parameters of the ligands were generated using the Force Field Builder in the Schrödinger suite. The same MD simulation parameters and protocol used in our previous work on 7OH and mitragynine40 were used here. MD production runs consisted of four independent simulations of 250 ns each for each ligand–MOR complex, for a total of 9 μs new simulation data added to the previously published 2 μs simulation data collected for 7OH–MOR and mitragynine–MOR complexes.40 Highly populated conformations of each ligand at MOR were obtained using the affinity propagation clustering algorithm described by Fray and Dueck75 and implemented in the Schrödinger’s trj_cluster.py script. Specifically, 500 snapshots of each ligand-MOR MD simulation trajectory with a stride of 2 ns were superimposed to a reference frame using the protein heavy atoms within 8 Å of the ligand prior to clustering. Pairwise root mean square deviation (RMSD) values of the same selected group of atoms were used as input for trj_cluster.py, which yielded 39, 39, 36, 39, 41, 28, 41, 46, 36, 41, and 43 clusters for mitragynine, 7OH, morphine, buprenorphine, 8, 9, 10, 4, 5, 6 (SC13), and 11-F respectively. The top populated cluster in each case accounted for 4.58, 5.38, 8.96, 6.57, 6.57, 8.37, 6.97, 4.78, 10.36, 5.58, and 6.17% of the assessed simulation frames.
Structural Interaction Fingerprint (SIFt) Analysis.
An in-house python script was used to generate 9-bit representations of ligand–receptor interactions formed by both backbone and sidechain atoms, including hydrogen-bond interactions with the protein as a hydrogen-bond donor (Hbond_proD) or hydrogen-bond acceptor (Hbond_-proA), electrostatic interactions with positively (Elec_ProP) or negatively charged (Elec_ProN) residues, apolar interactions (carbon-carbon atoms in contact), face-to-face (Aro_F2F) and edge-to-face (Aro_E2F) aromatic interactions, and 1-water mediated H-bond (Hbond_1wat) and 2-water mediated H-bond (Hbond_2-wat). Apolar interactions were cut at 4.5 Å whereas a cutoff of 4 Å was considered to define aromatic and electrostatic interactions. A two-state Markov model that samples the transition matrix posterior distribution using standard Dirichlet priors for the transition probabilities as described by Noé et al. was used to calculate the probability of each ligand-MOR interaction formed during MD simulations.76 Calculated average SIFt probabilities for each ligand are listed in Table S6 in the SI.
Logistic Regression Models Based on SIFTs.
We modeled the negative logarithm of the G protein efficacy Emax(k) for each ligand k as a function of the probability of ligands establishing up to three interactions pi(k) in the binding pocket according to the equation:
where εk is a normally distributed error term and ci is a scalar coefficient. According to this equation, the high probability of establishing an interaction whose coefficient ci is negative results in enhancing the efficacy of the ligand, while the formation of an interaction whose coefficient ci is positive reduces the ligand’s efficacy. The models were estimated in a Bayesian framework using the STAN engine77 for all possible combinations of three interactions in the binding pocket. The accuracy and robustness of the model was assessed by calculating the R2 on the full training dataset (11 ligands), as well as the RMSE in a LOO validation. The best eight performing models on the experimental data were those in the top quartile of R2 validation on the full training set and the lowest LOO-RMSE validation (red dots in Figure S2 in the SI). To summarize the effect of each of the interactions identified by these eight models, we report the average coefficients as well as the number of times the interactions appear in the top eight models in Table S8 in the SI.
Supplementary Material
ACKNOWLEDGMENTS
S.M. and D.S. is supported by funds from NIH grants DA045884 and DA046487. S.M. is further supported by DA048379. J.A.J. is supported by a grant from the Hope for Depression Research Foundation. M.F. is supported by NIH grants DA045473 and DA045884. Computations were run on resources available through the Office of Research Infrastructure of the National Institutes of Health under award numbers S10OD018522 and S10OD026880 (to the Icahn School of Medicine at Mount Sinai), as well as the Extreme Science and Engineering Discovery Environment under MCB080077 (to MF), which is supported by National Science Foundation grant number ACI-1548562. R.V.R. is supported by NIH grants AA026949. EBM is supported by funds from the State of California for medical research on alcohol and substance abuse through the University of California, San Francisco.
ABBREVIATIONS
- BRET
bioluminescence resonance energy transfer
- CLAMS
Comprehensive Lab Animal Monitoring System
- DAMGO
[d-Ala2, N-MePhe4, Gly-ol5]-enkephalin
- DCM
dichloromethane
- DOR
delta opioid receptor
- KOR
kappa opioid receptor
- MOR
mu opioid receptor
- MP
mitragynine pseudoindoxyl
- MPE
maximum possible effect
- 7OH-7
hydroxy mitragynine
- RT
room temperature
- sc
subcutaneous
Footnotes
The authors declare the following competing financial interest(s): S.M. is a co-founder of Sparian Inc. D.S.& J.A.J. are co-founders of Kures. SM, DS and JAJ are inventors on patent applications related to mitragynine analogs, which may lead to royalties or other licensing revenues from future commercial products.
Supporting Information
The Supporting Information is available free of charge at https://pubs.acs.org/doi/10.1021/acs.jmedchem.1c01273.
Additional tables, figures, 1H-13C NMR spectra of 4, 5, and 6 (SC13) and HPLC traces of 4, 5, and 6 (SC13) (PDF)
Molecular formula strings for compounds (CSV)
PDB file of docking model of 4 (PDB)
PDB file of docking model of 5 (PDB)
PDB file of docking model of 6 (SC13) (PDB)
Contributor Information
Soumen Chakraborty, Center for Clinical Pharmacology, University of Health Sciences & Pharmacy at St. Louis and Washington University School of Medicine, St. Louis, Missouri 63110, United States; Department of Anesthesiology, Washington University School of Medicine, St. Louis, Missouri 63110, United States.
Jeffrey F. DiBerto, Department of Pharmacology, University of North Carolina at Chapel Hill School of Medicine, Chapel Hill, North Carolina 27599, United States
Abdelfattah Faouzi, Center for Clinical Pharmacology, University of Health Sciences & Pharmacy at St. Louis and Washington University School of Medicine, St. Louis, Missouri 63110, United States; Department of Anesthesiology, Washington University School of Medicine, St. Louis, Missouri 63110, United States.
Sarah M. Bernhard, Center for Clinical Pharmacology, University of Health Sciences & Pharmacy at St. Louis and Washington University School of Medicine, St. Louis, Missouri 63110, United States; Department of Anesthesiology, Washington University School of Medicine, St. Louis, Missouri 63110, United States
Anna M. Gutridge, Department of Medicinal Chemistry and Molecular Pharmacology, College of Pharmacy, Purdue University, West Lafayette, Indiana 47907, United States
Steven Ramsey, Department of Pharmacological Sciences, Icahn School of Medicine at Mount Sinai, New York, New York 10029, United States.
Yuchen Zhou, Department of Pharmacological Sciences, Icahn School of Medicine at Mount Sinai, New York, New York 10029, United States.
Davide Provasi, Department of Pharmacological Sciences, Icahn School of Medicine at Mount Sinai, New York, New York 10029, United States.
Nitin Nuthikattu, Center for Clinical Pharmacology, University of Health Sciences & Pharmacy at St. Louis and Washington University School of Medicine, St. Louis, Missouri 63110, United States; Department of Anesthesiology, Washington University School of Medicine, St. Louis, Missouri 63110, United States.
Rahul Jilakara, Center for Clinical Pharmacology, University of Health Sciences & Pharmacy at St. Louis and Washington University School of Medicine, St. Louis, Missouri 63110, United States; Department of Anesthesiology, Washington University School of Medicine, St. Louis, Missouri 63110, United States.
Melissa N. F. Nelson, Departments of Psychiatry and Molecular Pharmacology and Therapeutics, Columbia University Vagelos College of Physicians and Surgeons, and Division of Molecular Therapeutics, New York State Psychiatric Institute, New York, New York 10032, United States
Wesley B. Asher, Departments of Psychiatry and Molecular Pharmacology and Therapeutics, Columbia University Vagelos College of Physicians and Surgeons, and Division of Molecular Therapeutics, New York State Psychiatric Institute, New York, New York 10032, United States
Shainnel O. Eans, Department of Pharmacodynamics, University of Florida, Gainesville, Florida 032610, United States
Lisa L. Wilson, Department of Pharmacodynamics, University of Florida, Gainesville, Florida 032610, United States.
Satyanarayana M. Chintala, Department of Anesthesiology, Washington University School of Medicine, St. Louis, Missouri 63110, United States
Marta Filizola, Department of Pharmacological Sciences, Icahn School of Medicine at Mount Sinai, New York, New York 10029, United States.
Richard M. van Rijn, Department of Medicinal Chemistry and Molecular Pharmacology, College of Pharmacy, Purdue University, West Lafayette, Indiana 47907, United States.
Elyssa B. Margolis, Department of Neurology, UCSF Weill Institute for Neurosciences, University of California San Francisco, San Francisco, California 94158, United States
Bryan L. Roth, Department of Pharmacology, University of North Carolina at Chapel Hill School of Medicine, Chapel Hill, North Carolina 27599, United States.
Jay P. McLaughlin, Department of Pharmacodynamics, University of Florida, Gainesville, Florida 032610, United States.
Tao Che, Center for Clinical Pharmacology, University of Health Sciences & Pharmacy at St. Louis and Washington University School of Medicine, St. Louis, Missouri 63110, United States; Department of Anesthesiology, Washington University School of Medicine, St. Louis, Missouri 63110, United States; Department of Pharmacology, University of North Carolina at Chapel Hill School of Medicine, Chapel Hill, North Carolina 27599, United States.
Dalibor Sames, Department of Chemistry, Columbia University, New York 10027, United States.
Jonathan A. Javitch, Departments of Psychiatry and Molecular Pharmacology and Therapeutics, Columbia University Vagelos College of Physicians and Surgeons, and Division of Molecular Therapeutics, New York State Psychiatric Institute, New York, New York 10032, United States.
Susruta Majumdar, Center for Clinical Pharmacology, University of Health Sciences & Pharmacy at St. Louis and Washington University School of Medicine, St. Louis, Missouri 63110, United States; Department of Anesthesiology, Washington University School of Medicine, St. Louis, Missouri 63110, United States.
REFERENCES
- (1).Pasternak GW; Pan Y-X Mu Opioids and Their Receptors: Evolution of a Concept. Pharmacol. Rev 2013, 65, 1257–1317. [DOI] [PMC free article] [PubMed] [Google Scholar]
- (2).Corbett AD; Henderson G; Mcknight AT; Paterson SJ 75 Years of Opioid Research: The Exciting but Vain Quest for the Holy Grail. Br. J. Pharmacol 2006, 147, S153–S162. [DOI] [PMC free article] [PubMed] [Google Scholar]
- (3).Compton WM; Jones CM; Baldwin GT The Authors Reply. In New England Journal of Medicine; Massachussetts Medical Society: March 31, 2016, p 1296. [Google Scholar]
- (4).National Institute on Drug Abuse (NIDA) Overdose Death Rates. https://www.drugabuse.gov/related-topics/trends-statistics/overdose-death-rates (accessed Sep 23, 2019).
- (5).Gillis A; Gondin AB; Kliewer A; Sanchez J; Lim HD; Alamein C; Manandhar P; Santiago M; Fritzwanker S; Schmiedel F; Katte TA; Reekie T; Grimsey NL; Kassiou M; Kellam B; Krasel C; Halls ML; Connor M; Lane JR; Schulz S; Christie MJ; Canals M Low Intrinsic Efficacy for G Protein Activation Can Explain the Improved Side Effect Profiles of New Opioid Agonists. Sci. Signaling 2020, 13, 3140. [DOI] [PubMed] [Google Scholar]
- (6).Uprety R; Che T; Zaidi SA; Grinnell SG; Varga BR; Faouzi A; Slocum ST; Allaoa A; Varadi A; Nelson M; Bernhard SM; Kulko E; Le Rouzic V; Eans SO; Simons CA; Hunkele A; Subrath J; Pan YX; Javitch JA; McLaughlin JP; Roth BL; Pasternak GW; Katritch V; Majumdar S Controlling Opioid Receptor Functional Selectivity by Targeting Distinct Subpockets of the Orthosteric Site. Elife 2021, 10, No. e56519. [DOI] [PMC free article] [PubMed] [Google Scholar]
- (7).Che T; Roth BL Structural Insights Accelerate the Discovery of Opioid Alternatives. Annu. Rev. Biochem 2021, 90, 739–761. [DOI] [PubMed] [Google Scholar]
- (8).Kelly E Efficacy and Ligand Bias at the μ-Opioid Receptor. Br. J. Pharmacol 2013, 1430–1446. [DOI] [PMC free article] [PubMed] [Google Scholar]
- (9).McPherson J; Rivero G; Baptist M; Llorente J; Al-Sabah S; Krasel C; Dewey WL; Bailey CP; Rosethorne EM; Charlton SJ; Henderson G; Kelly E μ-Opioid Receptors: Correlation of Agonist Efficacy for Signalling with Ability to Activate Internalization. Mol. Pharmacol 2010, 78, 756–766. [DOI] [PMC free article] [PubMed] [Google Scholar]
- (10).Ramanathan S; McCurdy CR Kratom (Mitragyna Speciosa): Worldwide Issues. Curr. Opin. Psychiatry 2020, 33, 312–318. [DOI] [PubMed] [Google Scholar]
- (11).Chakraborty S; Majumdar S Natural Products for the Treatment of Pain: Chemistry and Pharmacology of Salvinorin A, Mitragynine, and Collybolide. Biochemistry 2021, 60, 1381–1400. [DOI] [PMC free article] [PubMed] [Google Scholar]
- (12).Todd DA; Kellogg JJ; Wallace ED; Khin M; Flores-Bocanegra L; Tanna RS; McIntosh S; Raja HA; Graf TN; Hemby SE; Paine MF; Oberlies NH; Cech NB Chemical Composition and Biological Effects of Kratom (Mitragyna Speciosa): In Vitro Studies with Implications for Efficacy and Drug Interactions. Sci. Rep 2020, 10, 19158. [DOI] [PMC free article] [PubMed] [Google Scholar]
- (13).Brown PN; Lund JA; Murch SJ A Botanical, Phytochemical and Ethnomedicinal Review of the Genus Mitragyna Korth: Implications for Products Sold as Kratom. J. Ethnopharmacol 2017, 202, 302–325. [DOI] [PubMed] [Google Scholar]
- (14).Ellis CR; Racz R; Kruhlak NL; Kim MT; Zakharov AV; Southall N; Hawkins EG; Burkhart K; Strauss DG; Stavitskaya L Evaluating Kratom Alkaloids Using PHASE. PLoS One 2020, 15, e0229646. [DOI] [PMC free article] [PubMed] [Google Scholar]
- (15).Takayama H Chemistry and Pharmacology of Analgesic Indole Alkaloids from the Rubiaceous Plant, Mitragyna Speciosa. Chem. Pharm. Bull 2004, 52, 916–928. [DOI] [PubMed] [Google Scholar]
- (16).Takayama H; Ishikawa H; Kurihara M; Kitajima M; Aimi N; Ponglux D; Koyama F; Matsumoto K; Moriyama T; Yamamoto LT; Watanabe K; Murayama T; Horie S Studies on the Synthesis and Opioid Agonistic Activities of Mitragynine-Related Indole Alkaloids: Discovery of Opioid Agonists Structurally Different from Other Opioid Ligands. J. Med. Chem 2002, 45, 1949–1956. [DOI] [PubMed] [Google Scholar]
- (17).Flores-Bocanegra L; Raja HA; Graf TN; Augustinović M; Wallace ED; Hematian S; Kellogg JJ; Todd DA; Cech NB ; Oberlies NH The Chemistry of Kratom [Mitragyna Speciosa]: Updated Characterization Data and Methods to Elucidate Indole and Oxindole Alkaloids. J. Nat. Prod 2020, 83, 2165–2177. [DOI] [PMC free article] [PubMed] [Google Scholar]
- (18).Kruegel AC; Gassaway MM; Kapoor A; Váradi A; Majumdar S; Filizola M; Javitch JA; Sames D Synthetic and Receptor Signaling Explorations of the Mitragyna Alkaloids: Mitragynine as an Atypical Molecular Framework for Opioid Receptor Modulators. J. Am. Chem. Soc 2016, 138, 6754–6764. [DOI] [PMC free article] [PubMed] [Google Scholar]
- (19).Váradi A; Marrone GF; Palmer TC; Narayan A; Szabó MR; Le Rouzic V; Grinnell SG; Subrath JJ; Warner E; Kalra S; Hunkele A; Pagirsky J; Eans SO; Medina JM; Xu J; Pan YX; Borics A; Pasternak GW; McLaughlin JP; Majumdar S Mitragynine/Corynantheidine Pseudoindoxyls As Opioid Analgesics with Mu Agonism and Delta Antagonism, Which Do Not Recruit β-Arrestin-2. J. Med. Chem 2016, 59, 8381–8397. [DOI] [PMC free article] [PubMed] [Google Scholar]
- (20).Kruegel AC; Uprety R; Grinnell SG; Langreck C; Pekarskaya EA; Le Rouzic V; Ansonoff M; Gassaway MM; Pintar JE; Pasternak GW; Javitch JA; Majumdar S; Sames D 7-Hydroxymitragynine Is an Active Metabolite of Mitragynine and a Key Mediator of Its Analgesic Effects. ACS Cent. Sci 2019, 5, 992–1001. [DOI] [PMC free article] [PubMed] [Google Scholar]
- (21).Stoeber M; Jullie D; Li J; Chakraborty S; Majumdar S; Lambert NA; Manglik A; von Zastrow M Agonist-Selective Recruitment of Engineered Protein Probes and of GRK2 by Opioid Receptors in Living Cells. Elife 2020, 9, No. e54208. [DOI] [PMC free article] [PubMed] [Google Scholar]
- (22).Zhou Y; Ramsey S; Provasi D; El Daibani A; Appourchaux K; Chakraborty S; Kapoor A; Che T; Majumdar S; Filizola M Predicted Mode of Binding to and Allosteric Modulation of the μ-Opioid Receptor by Kratom’s Alkaloids with Reported Antinociception In Vivo. Biochemistry 2021, 60, 1420–1429. [DOI] [PMC free article] [PubMed] [Google Scholar]
- (23).Gutridge AM; Robins MT; Cassell RJ; Uprety R; Mores KL; Ko MJ; Pasternak GW; Majumdar S; van Rijn RM G Protein-Biased Kratom-Alkaloids and Synthetic Carfentanil-Amide Opioids as Potential Treatments for Alcohol Use Disorder. Br. J. Pharmacol 2020, 177, 1497–1513. [DOI] [PMC free article] [PubMed] [Google Scholar]
- (24).Wilson LL; Chakraborty S; Eans SO; Cirino TJ; Stacy HM; Simons CA; Uprety R; Majumdar S; McLaughlin JP Kratom Alkaloids, Natural and Semi-Synthetic, Show Less Physical Dependence and Ameliorate Opioid Withdrawal. Cell. Mol. Neurobiol 2021, 41, 1131–1143. [DOI] [PMC free article] [PubMed] [Google Scholar]
- (25).Chakraborty S; Uprety R; Daibani AE; Rouzic VL; Hunkele A; Appourchaux K; Eans SO; Nuthikattu N; Jilakara R; Thammavong L; Pasternak GW; Pan Y-X; McLaughlin JP; Che T; Majumdar S Kratom Alkaloids as Probes for Opioid Receptor Function: Pharmacological Characterization of Minor Indole and Oxindole Alkaloids from Kratom. ACS Chem. Neurosci 2021, 12, 2661–2678. [DOI] [PMC free article] [PubMed] [Google Scholar]
- (26).Kamble SH; Sharma A; King TI; León F; McCurdy CR; Avery BA Metabolite Profiling and Identification of Enzymes Responsible for the Metabolism of Mitragynine, the Major Alkaloid of Mitragyna Speciosa(Kratom). Xenobiotica 2019, 49, 1279–1288. [DOI] [PubMed] [Google Scholar]
- (27).Maxwell EA; King TI; Kamble SH; Raju KSR; Berthold EC; León F; Avery BA; McMahon LR; McCurdy CR; Sharma A Pharmacokinetics and Safety of Mitragynine in Beagle Dogs. Planta Med. 2020, 86, 1278–1285. [DOI] [PMC free article] [PubMed] [Google Scholar]
- (28).Wilson LL; Harris HM; Eans SO; Brice-Tutt AC; Cirino TJ; Stacy HM; Simons CA; León F; Sharma A; Boyer EW; Avery BA; McLaughlin JP; McCurdy CR Lyophilized Kratom Tea as a Therapeutic Option for Opioid Dependence. Drug Alcohol Depend. 2020, 216, 108310. [DOI] [PubMed] [Google Scholar]
- (29).Hiranita T; Leon F; Felix JS; Restrepo LF; Reeves ME; Pennington AE; Obeng S; Avery BA; McCurdy CR; McMahon LR; Wilkerson JL The Effects of Mitragynine and Morphine on Schedule-Controlled Responding and Antinociception in Rats. Psychopharmacology 2019, 236, 2725–2734. [DOI] [PMC free article] [PubMed] [Google Scholar]
- (30).Obeng S; Kamble SH; Reeves ME; Restrepo LF; Patel A; Behnke M; Chear NJY; Ramanathan S; Sharma A; León F; Hiranita T; Avery BA; McMahon LR; McCurdy CR Investigation of the Adrenergic and Opioid Binding Affinities, Metabolic Stability, Plasma Protein Binding Properties, and Functional Effects of Selected Indole-Based Kratom Alkaloids. J. Med. Chem 2020, 63, 433–439. [DOI] [PMC free article] [PubMed] [Google Scholar]
- (31).Yue K; Kopajtic TA; Katz JL Abuse Liability of Mitragynine Assessed with a Self-Administration Procedure in Rats. Psychopharmacology 2018, 235, 2823–2829. [DOI] [PubMed] [Google Scholar]
- (32).Hemby SE; McIntosh S; Leon F; Cutler SJ; McCurdy CR Abuse Liability and Therapeutic Potential of the Mitragyna Speciosa (Kratom) Alkaloids Mitragynine and 7-Hydroxymitragynine. Addict. Biol 2019, 24, 874–885. [DOI] [PubMed] [Google Scholar]
- (33).Takayama H; Misawa K; Okada N; Ishikawa H; Kitajima M; Hatori Y; Murayama T; Wongseripipatana S; Tashima K; Matsumoto K; Horie S New Procedure to Mask the 2,3-π Bond of the Indole Nucleus and Its Application to the Preparation of Potent Opioid Receptor Agonists with a Corynanthe Skeleton. Org. Lett 2006, 8, 5705–5708. [DOI] [PubMed] [Google Scholar]
- (34).Olsen RHJ; DiBerto JF; English JG; Glaudin AM; Krumm BE; Slocum ST; Che T; Gavin AC; McCorvy JD; Roth BL; Strachan RT TRUPATH, an Open-Source Biosensor Platform for Interrogating the GPCR Transducerome. Nat. Chem. Biol 2020, 16, 841–849. [DOI] [PMC free article] [PubMed] [Google Scholar]
- (35).Barnett ME; Knapp BI; Bidlack JM Unique Pharmacological Properties of the Kappa Opioid Receptor Signaling through Gaz as Shown with Bioluminescence Resonance Energy Tranfer. Mol. Pharmacol 2020, 98, 462–474. [DOI] [PMC free article] [PubMed] [Google Scholar]
- (36).Che T; Majumdar S; Zaidi SA; Ondachi P; McCorvy JD; Wang S; Mosier PD; Uprety R; Vardy E; Krumm BE; Han GW; Lee M-Y; Pardon E; Steyaert J; Huang X-P; Strachan RT; Tribo AR; Pasternak GW; Carroll FI; Stevens RC; Cherevoz V; Katritch V; Wacker D; Roth BL Structure of the Nanobody-Stabilized Active State of the Kappa Opioid Receptor. Cell 2018, 172, 55–67.e15. [DOI] [PMC free article] [PubMed] [Google Scholar]
- (37).Che T; English J; Krumm BE; Kim K; Pardon E; Olsen RHJ; Wang S; Zhang S; Diberto JF; Sciaky N; Carroll FI; Steyaert J; Wacker D; Roth BL Nanobody-Enabled Monitoring of Kappa Opioid Receptor States. Nat. Commun 2020, 11, 1145. [DOI] [PMC free article] [PubMed] [Google Scholar]
- (38).Margolis EB; Fields HL; Hjelmstad GO; Mitchell JM δ-Opioid Receptor Expression in the Ventral Tegmental Area Protects against Elevated Alcohol Consumption. J. Neurosci 2008, 28, 12672–12681. [DOI] [PMC free article] [PubMed] [Google Scholar]
- (39).Bhowmik S; Galeta J; Havel V; Nelson M; Faouzi A; Bechand B; Ansonoff M; Fiala T; Hunkele A; Kruegel AC; Pintar JE; Majumdar S; Javitch JA; Sames D Site Selective C─H Functionalization of Mitragyna Alkaloids Reveals a Molecular Switch for Tuning Opioid Receptor Signaling Efficacy. Nat. Commun 2021, 12, 3858. [DOI] [PMC free article] [PubMed] [Google Scholar]
- (40).Schrödinger L Small-Molecule Drug Discovery Suite; 2019–2, 2018–3. Ed., Schrödinger, LLC: New York, NY, 2019. [Google Scholar]
- (41).Ballesteros JA; Weinstein H Integrated Methods for the Construction of Three-Dimensional Models and Computational Probing of Structure-Function Relations in G Protein-Coupled Receptors. Methods Neurosci. 1995, 25, 366–428. [Google Scholar]
- (42).Isberg V; De Graaf C; Bortolato A; Cherezov V; Katritch V; Marshall FH; Mordalski S; Pin JP; Stevens RC; Vriend G; Gloriam DE Generic GPCR Residue Numbers - Aligning Topology Maps While Minding the Gaps. Trends Pharmacol. Sci 2015, 22–31. [DOI] [PMC free article] [PubMed] [Google Scholar]
- (43).Matsumoto K; Horie S; Ishikawa H; Takayama H; Aimi N; Ponglux D; Watanabe K Antinociceptive Effect of 7-Hydroxymitragynine in Mice: Discovery of an Orally Active Opioid Analgesic from the Thai Medicinal Herb Mitragyna Speciosa. Life Sci. 2004, 74, 2143–2155. [DOI] [PubMed] [Google Scholar]
- (44).Manglik A; Lin H; Aryal DK; McCorvy JD; Dengler D; Corder G; Levit A; Kling RC; Bernat V; Hubner H; Huang XP; Sassano MF; Giguère PM; Löber S; Duan D; Scherrer G; Kobilka BK; Gmeiner P; Roth BL; Shoichet BK Structure-Based Discovery of Opioid Analgesics with Reduced Side Effects. Nature 2016, 537, 185–190. [DOI] [PMC free article] [PubMed] [Google Scholar]
- (45).Faouzi A; Varga BR; Majumdar S Biased Opioid Ligands. Molecules 2020, 4257. [DOI] [PMC free article] [PubMed] [Google Scholar]
- (46).Schmid CL; Kennedy NM; Ross NC; Lovell KM; Yue Z; Morgenweck J; Cameron MD; Bannister TD; Bohn LM Bias Factor and Therapeutic Window Correlate to Predict Safer Opioid Analgesics. Cell 2017, 171, 1165–1175.e13. [DOI] [PMC free article] [PubMed] [Google Scholar]
- (47).Faouzi A; Uprety R; Gomes I; Massaly N; Keresztes AI; Le Rouzic V; Gupta A; Zhang T; Yoon HJ; Ansonoff M; Allaoa A; Pan YX; Pintar J; Morón JA; Streicher JM; Devi LA; Majumdar S Synthesis and Pharmacology of a Novel μ-δ Opioid Receptor Heteromer-Selective Agonist Based on the Carfentanyl Template. J. Med. Chem 2020, 63, 13618–13637. [DOI] [PMC free article] [PubMed] [Google Scholar]
- (48).Cuitavi J; Hipolito L; Canals M The Life Cycle of the Mu-Opioid Receptor. Trends Biochem. Sci 2021, 46, 315–328. [DOI] [PubMed] [Google Scholar]
- (49).Kliewer A; Gillis A; Hill R; Schmiedel F; Bailey C; Kelly E; Henderson G; Christie MJ; Schulz S Morphine-Induced Respiratory Depression Is Independent of β-Arrestin2 Signalling. Br. J. Pharmacol 2020, 177, 2923–2931. [DOI] [PMC free article] [PubMed] [Google Scholar]
- (50).Kliewer A; Schmiedel F; Sianati S; Bailey A; Bateman JT; Levitt ES; Williams JT; Christie MJ; Schulz S Phosphorylation-Deficient G-Protein-Biased μ-Opioid Receptors Improve Analgesia and Diminish Tolerance but Worsen Opioid Side Effects. Nat. Commun 2019, 10, 367. [DOI] [PMC free article] [PubMed] [Google Scholar]
- (51).Raehal KM; Walker JKL; Bohn LM Morphine Side Effects in β-Arrestin 2 Knockout Mice. J. Pharmacol. Exp. Ther 2005, 314, 1195–1201. [DOI] [PubMed] [Google Scholar]
- (52).Liapakis G; Chan WC; Papadokostaki M; Javitch JA Synergistic Contributions of the Functional Groups of Epinephrine to Its Affinity and Efficacy at the β2 Adrenergic Receptor. Mol. Pharmacol 2004, 65, 1181–1190. [DOI] [PubMed] [Google Scholar]
- (53).Kenakin T A Scale of Agonism and Allosteric Modulation for Assessment of Selectivity, Bias, and Receptor Mutation. Mol. Pharmacol 2017, 414–424. [DOI] [PubMed] [Google Scholar]
- (54).Selley DE; Liu Q; Childers SR Signal Transduction Correlates of Mu Opioid Agonist Intrinsic Efficacy: Receptor-Stimulated [35S]GTPγS Binding in MMOR-CHO Cells and Rat Thalamus. J. Pharmacol. Exp. Ther 1998, 285, 496–505. [PubMed] [Google Scholar]
- (55).Strange PG Use of the GTPγS ([35S]GTPγS and Eu-GTPγS) Binding Assay for Analysis of Ligand Potency and Efficacy at G Protein-Coupled Receptors. Br. J. Pharmacol 2010, 1238–1249. [DOI] [PMC free article] [PubMed] [Google Scholar]
- (56).Gierschik P; Milligan G; Pines M; Goldsmith P; Codina J; Klee W; Spiegel A Use of Specific Antibodies to Quantitate the Guanine Nucleotide-Binding Protein Go in Brain. Proc. Natl. Acad. Sci. U. S. A 1986, 83, 2258–2262. [DOI] [PMC free article] [PubMed] [Google Scholar]
- (57).Sánchez-Blázquez P; Rodríguez-Díaz M; DeAntonio I; Garzón J Endomorphin-1 and Endomorphin-2 Show Differences in Their Activation of μ Opioid Receptor-Regulated G Proteins in Supraspinal Antinociception in Mice. J. Pharmacol. Exp. Ther 1999, 291, 12–18. [PubMed] [Google Scholar]
- (58).Garzón J; García-España A; Sánchez-Blázquez P Opioids Binding Mu and Delta Receptors Exhibit Diverse Efficacy in the Activation of Gi2 and G(x/z) Transducer Proteins in Mouse Periaqueductal Gray Matter. J. Pharmacol. Exp. Ther 1997, 281, 549–557. [PubMed] [Google Scholar]
- (59).Dahan A Opioid-Induced Respiratory Effects: New Data on Buprenorphine. Palliative Med. 2006, 20, 3–8. [PubMed] [Google Scholar]
- (60).Pergolizzi J; Aloisi AM; Dahan A; Filitz J; Langford R; Likar R; Mercadante S; Morlion B; Raffa RB; Sabatowski R; Sacerdote P; Torres LM; Weinbroum AA Current Knowledge of Buprenorphine and Its Unique Pharmacological Profile. Pain Pract. 2010, 10, 428–450. [DOI] [PubMed] [Google Scholar]
- (61).Grinnell SG; Ansonoff M; Marrone GF; Lu Z; Narayan A; Xu J; Rossi G; Majumdar S; Pan YX; Bassoni DL; Pintar J; Pasternak GW Mediation of Buprenorphine Analgesia by a Combination of Traditional and Truncated Mu Opioid Receptor Splice Variants. Synapse 2016, 70, 395–407. [DOI] [PMC free article] [PubMed] [Google Scholar]
- (62).Canestrelli C; Marie N; Noble F Rewarding or Aversive Effects of Buprenorphine/Naloxone Combination (Suboxone) Depend on Conditioning Trial Duration. Int. J. Neuropsychopharmacol 2014, 17, 1367–1373. [DOI] [PubMed] [Google Scholar]
- (63).Selley DE; Sim LJ; Xiao R; Liu Q; Childers SR μ-Opioid Receptor-Stimulated Guanosine-5′-O-(γ-Thio)-Triphosphate Binding in Rat Thalamus and Cultured Cell Lines: Signal Transduction Mechanisms Underlying Agonist Efficacy. Mol. Pharmacol 1997, 51, 87–96. [DOI] [PubMed] [Google Scholar]
- (64).Wnendt S; Krüger T; Janocha E; Hildebrandt D; Englberger W Agonistic Effect of Buprenorphine in a Nociceptin/OFQ Receptor-Triggered Reporter Gene Assay. Mol. Pharmacol 1999, 56, 334–338. [DOI] [PubMed] [Google Scholar]
- (65).Huang P; Kehner GB; Cowan A; Liu-Chen LY Comparison of Pharmacological Activities of Buprenorphine and Norbuprenorphine: Norbuprenorphine Is a Potent Opioid Agonist. J. Pharmacol. Exp. Ther 2001, 297, 688–695. [PubMed] [Google Scholar]
- (66).Alhaddad H; Cisternino S; Declèves X; Tournier N; Schlatter J; Chiadmi F; Risède P; Smirnova M; Besengez C; Scherrmann JM; Baud FJ; Mégarbane B Respiratory Toxicity of Buprenorphine Results from the Blockage of P-Glycoprotein-Mediated Efflux of Norbuprenorphine at the Blood-Brain Barrier in Mice. Crit. Care Med 2012, 40, 3215–3223. [DOI] [PubMed] [Google Scholar]
- (67).Brown SM; Holtzman M; Kim T; Kharasch ED Buprenorphine Metabolites, Buprenorphine-3-Glucuronide and Norbuprenorphine-3-Glucuronide, Are Biologically Active. Anesthesiology 2011, 115, 1251–1260. [DOI] [PMC free article] [PubMed] [Google Scholar]
- (68).Iribarne C; Picart D; Dréano Y; Bail JP; Berthou F Involvement of Cytochrome P450 3A4 in N-Dealkylation of Buprenorphine in Human Liver Microsomes. Life Sci. 1997, 60, 1953–1964. [DOI] [PubMed] [Google Scholar]
- (69).Donthamsetti P; Quejada JR; Javitch JA; Gurevich VV; Lambert NA Using Bioluminescence Resonance Energy Transfer (BRET) to Characterize Agonist-Induced Arrestin Recruitment to Modified and Unmodified G Protein-Coupled Receptors. Curr. Protoc. Pharmacol 2015, 70, 2.14.1–2.14.14. [DOI] [PMC free article] [PubMed] [Google Scholar]
- (70).Chiang T; Sansuk K; Van Rijn RM β-Arrestin 2 Dependence of δ Opioid Receptor Agonists Is Correlated with Alcohol Intake. Br. J. Pharmacol 2016, 173, 332–343. [DOI] [PMC free article] [PubMed] [Google Scholar]
- (71).Cassell RJ; Mores KL; Zerfas BL; Mahmoud AH; Lill MA; Trader DJ; van Rijn RM Rubiscolins Are Naturally Occurring G Protein-Biased Delta Opioid Receptor Peptides. Eur. Neuropsychopharmacol 2019, 29, 450–456. [DOI] [PMC free article] [PubMed] [Google Scholar]
- (72).Margolis EB; Hjelmstad GO; Fujita W; Fields HL Direct Bidirectional μ-Opioid Control of Midbrain Dopamine Neurons. J. Neurosci 2014, 34, 14707–14716. [DOI] [PMC free article] [PubMed] [Google Scholar]
- (73).Eans SO; Ganno ML; Mizrachi E; Houghten RA; Dooley CT; McLaughlin JP; Nefzi A Parallel Synthesis of Hexahydrodiimidazodiazepines Heterocyclic Peptidomimetics and Their in Vitro and in Vivo Activities at μ (MOR), δ (DOR), and κ (KOR) Opioid Receptors. J. Med. Chem 2015, 58, 4905–4917. [DOI] [PubMed] [Google Scholar]
- (74).Clark AJ; Tiwary P; Borrelli K; Feng S; Miller EB; Abel R; Friesner RA; Berne BJ Prediction of Protein-Ligand Binding Poses via a Combination of Induced Fit Docking and Metadynamics Simulations. J. Chem. Theory Comput 2016, 12, 2990–2998. [DOI] [PubMed] [Google Scholar]
- (75).Frey BJ; Dueck D Clustering by Passing Messages between Data Points. Science 2007, 315, 972–976. [DOI] [PubMed] [Google Scholar]
- (76).Noe F; Schutte C; Vanden-Eijnden E; Reich L; Weikl TR Constructing the Equilibrium Ensemble of Folding Pathways from Short Off-Equilibrium Simulations. Proc. Natl. Acad. Sci 2009, 106, 19011–19016. [DOI] [PMC free article] [PubMed] [Google Scholar]
- (77).Stan Development Team Stan Modeling Language Users Guide and Reference Manual, 2.21.0; 2019; https://mc-stan.org.
Associated Data
This section collects any data citations, data availability statements, or supplementary materials included in this article.