. 2021 Sep 30;10:e69222. doi: 10.7554/eLife.69222

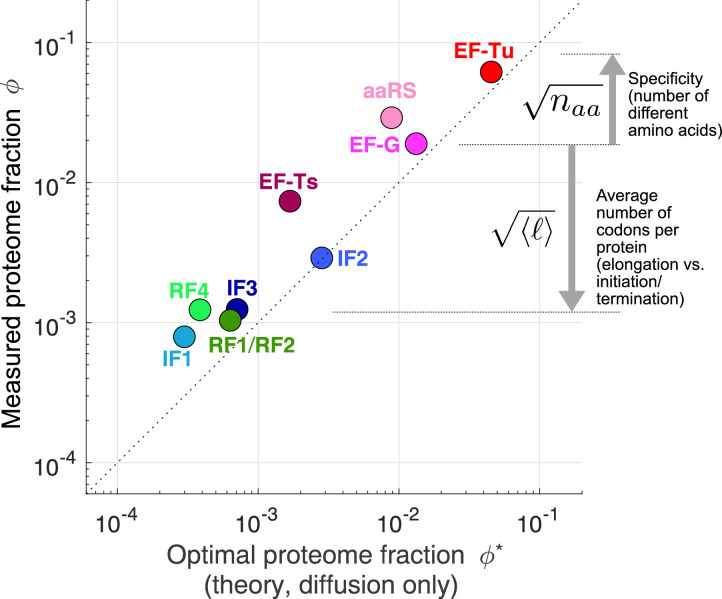
Figure 4. Predicted optimal abundance (no catalytic contribution, kcat) versus observed abundance.

Measured proteome fractions are the average of E. coli, B. subtilis, V. natriegens (Lalanne et al., 2018). We note that given the sensitivity of the optimal aaRS abundance on the total tRNA/ribosome ratio (visually: yellow star’s position in Figure 3B moves rapidly along x-axis upon changes in plateau of transition line), the prediction for aaRS should be interpreted with caution. Data and predicted values can be found in Supplementary file 1 and 2.

Figure 4.

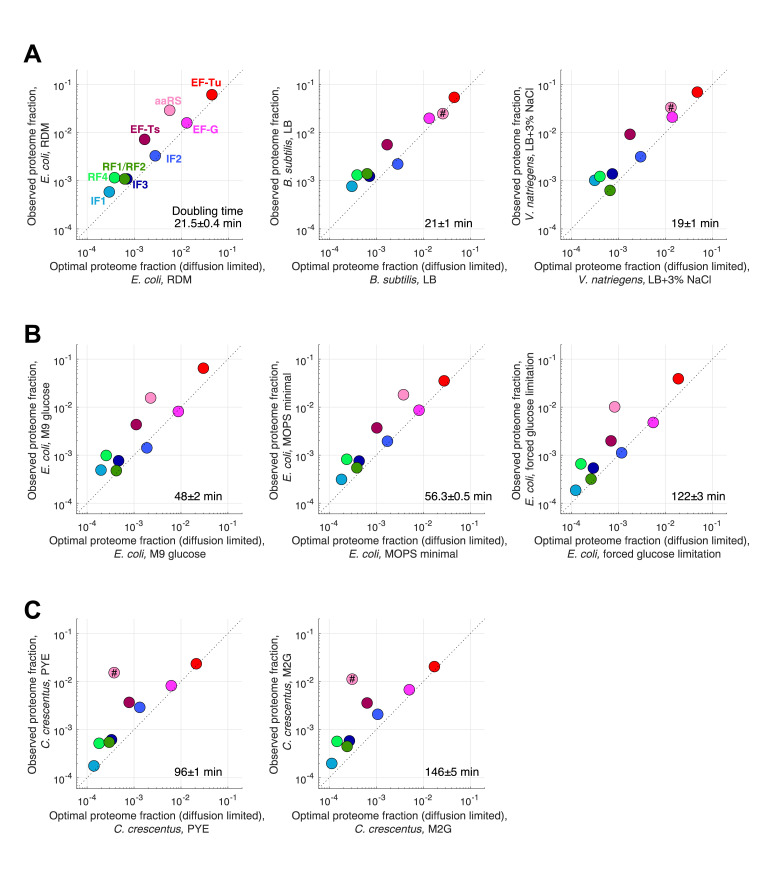
Figure 4—figure supplement 1. Measured and predicted proteome fraction for core translation factors in individual conditions.

Figure 4—figure supplement 1.

Measured (ribosome profiling) and predicted (diffusion-limited estimates) proteome fraction for core translation factors in individual conditions corresponding to different ribosome profiling datasets included in our analysis (see Supplementary files 14). Doubling time for each condition is indicated. (A) Individual fast growing species (see Figure 4 for the average). (B) Slower growth conditions in E. coli. (C) C. crescentus datasets. Predictions of aaRS in species other than E. coli are marked by # to indicate that we used E. coli tRNA abundance measurements from Dong et al., 1996 to make prediction for this tlF these other species.
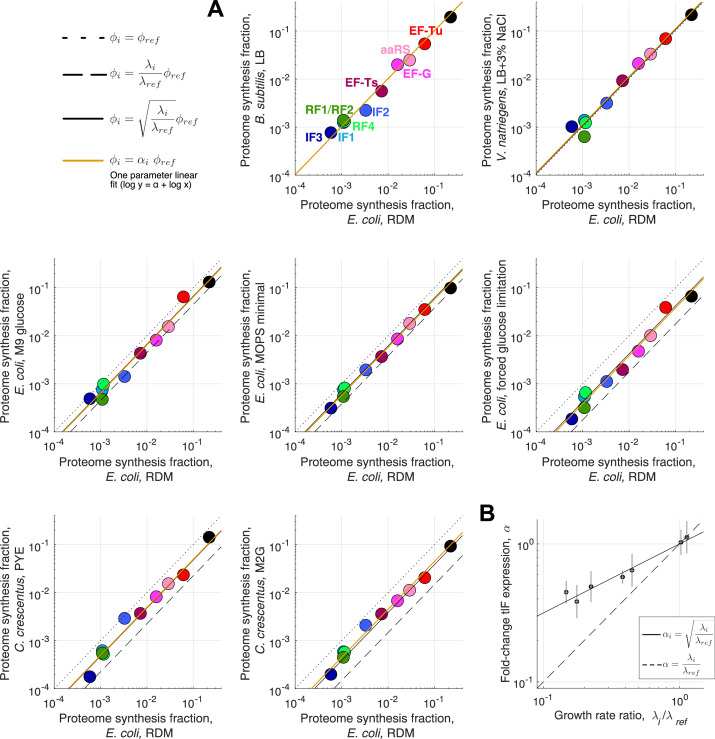
Figure 4—figure supplement 2. Expression stoichiometry of core translation factors in different species and at different growth rates.

Figure 4—figure supplement 2.

Expression stoichiometry of core translation factors in different species and at different growth rates. (A) Comparison of measured (ribosome profiling) proteome fraction for core translation factors across different species and growth conditions (same conditions as Figure 4—figure supplement 1). All conditions are compared to the E. coli RDM dataset (reference: ref, condition of interest: i). Dotted line correspond to ϕi=ϕref, dashed line to ϕi=(λi/λref)ϕref and full black line to ϕi=λi/λrefϕref (the parameter free prediction from the binding-limited regime of the model, optimal abundance λ). Orange line corresponds to the one parameter fit logϕi=αi+logϕref (excluding aaRS, not expected to follow the square root scaling, and ribosomes), corresponding to the scaling of all factor’s abundance. (B) Best one-parameter fit αi (scale factor) from (A) as a function of the growth rate ratio λi/λref. Square root scaling: full line. Linear scaling: dashed line. Uncertainties on the growth ratio are propagated from uncertainties of the respective growth rates. Uncertainties in αi are 95% confidence interval from the linear fits in (A).