Abstract
The state-of-the-art configurations for acoustic-resolution photoacoustic (PA) microscope (AR-PAM) are large in size and expensive, hindering their democratization. While previous research on AR-PAMs introduced a low-cost light source to reduce the cost, few studies have investigated the possibility of optimizing the sensor actuation, particularly for the AR-PAM. Additionally, there is an unmet need to evaluate the image quality deterioration associated with the actuation inaccuracy. A low-cost actuation device is introduced to reduce the system size and cost of the AR-PAM while maintaining the image quality by implementing the advanced beamformers. This work proposes an AR-RAM incorporating the delta configuration actuator adaptable from a low-cost off-the-shelf 3D printer as the sensor actuation device. The image degradation due to the data acquisition positioning inaccuracy is evaluated in the simulation. We further assess the mitigation of potential actuation precision uncertainty through advanced 3D synthetic aperture focusing algorithms represented by the Delay-and-Sum (DAS) with Coherence Factor (DAS+CF) and Delay-Multiply-and-Sum (DMAS) algorithms. The simulation study demonstrated the tolerance of image quality on actuation inaccuracy and the effect of compensating the actuator motion precision error through advanced reconstruction algorithms. With those algorithms, the image quality degradation was suppressed to within 25% with the presence of 0.2 mm motion inaccuracy. The experimental evaluation using phantoms and an ex-vivo sample presented the applicability of low-cost delta configuration actuators for AR-PAMs. The measured full width at half maximum of the 0.2 mm diameter pencil-lead phantom were 0.45±0.06 mm, 0.31±0.04 mm, and 0.35±0.07 mm, by applying the DAS, DAS+CF, and DMAS algorithms, respectively. AR-PAMs with a compact and low-cost delta configuration provide high-quality PA imaging with better accessibility for biomedical applications. The research evaluated the image degradation contributed by the actuation inaccuracy and suggested that the advanced beamformers are capable of suppressing the actuation inaccuracy.
Keywords: photoacoustic imaging, robotics, acoustic-resolution photoacoustic microscopy, delta configuration actuator, beamforming
Graphical Abstract
Introduction
Photoacoustic (PA) imaging, also known as optoacoustic imaging, is an emerging biomedical imaging modality based on laser-generated ultrasound[1–3]. In PA imaging, tissue and optical contrast agents absorb a short light pulse and generate thermoelastic waves (PA waves) through adiabatic expansion. The spatial distribution of the acoustic transient pressure inside the tissue acts as the initial source for the acoustic waves. The acoustic waves travel to the tissue surface and are detected by ultrasound receivers with time delays. The initial acoustic source can be mapped by measuring the time of arrival with the known speed of sound and shows the position of the optical absorption and thermal conversion. Based on the difference in spectrum properties[4], materials can be decomposed for spectroscopic functional imaging[5–7], which benefits the research on brain imaging[8] and cancer detection[9].
PA microscopy (PAM) provides a high resolution and contrast image at a desired imaging depth range depending on its configuration. The PAM systems are categorized into two groups based on their focusing method: optical-resolution PAM (OR-PAM)[10–13] and acoustic-resolution PAM (AR-PAM)[14–17]. OR-PAMs can achieve a cellular lateral resolution by focusing excitation light. However, maximum imaging depth is limited by the optical diffusion limit (less than 1 mm in tissue). On the other hand, given that the acoustic scattering is much weaker beyond the optical diffusion limit, AR-PAMs allow visualization of biological tissues with a lateral resolution of several tens or hundreds of micrometers with depths of several millimeters. A focused ultrasound transducer defines a detection zone for PA waves in AR-PAMs. The center frequency and bandwidth of the ultrasound transducer determine the spatial resolution and imaging depth.
The mainstay research and development of PA imaging devices has focused on improving speed, image quality, penetration depth, scanning area, as well as receptor sensitivity and frequency bandwidth [18–23]. The complexity of a PA imaging system leads to the high cost of the device that prevents the technology from broader applications. A PA imaging system mainly consists of three components: a high-power light source, a custom ultrasound data acquisition (DAQ) device, and a sensor actuation device. To reduce the size and cost of light sources, the usage of overdrove LED[24–26], pulsed laser diode[27–29] is proposed. Specifically for AR-PAM systems, Dai et al.[30] introduced replacing the laser with LED as the light source, and Stylogiannis et al.[31] proposed using an overdriven continuous wave (CW) laser diode. For the ultrasound data acquisition, a vendor-independent PA imaging system has been explored utilizing ultrasound post-beamformed data, which is readily accessible in some clinical scanners[32,33]. While the miniaturization of PA imaging devices has been realized through hand-held[25,34] and wearable devices[35], actuation configurations in these devices are highly customized and not widely available. The Cartesian linear translation stages are used as the accessible actuator in AR-PAMs[17,36]. The linear translation stages provide high precision motorized motion at several micrometers and guarantee the scanning tip localization accuracy. However, these motorized linear states are bulky and expensive, and the cost could further increase depending on the required loading capacity and actuation degree of freedom (DOF). Therefore, there is a need to explore the creation of an AR-PAM based on a compact, accessible, and economical actuation device.
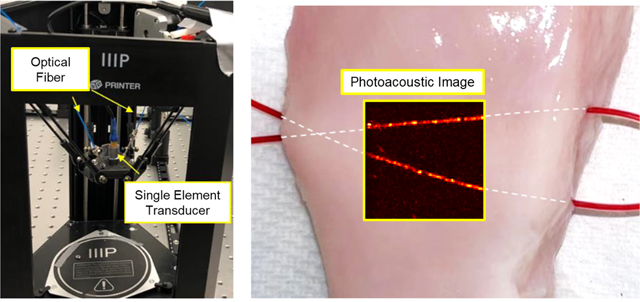
This work introduces an AR-PAM based on a parallel arm robot, adapted from a low-cost, commercially available off-the-shelf 3D printer. The sensor head comprises a single element focused ultrasound transducer, optical fibers, and their holder to deliver pulsed light. The sensor moves under delta configuration actuation in a lateral pattern (horizontal plane) covering the area of interest. The contributions of this work fold under three aspects. (1) We introduce a low-cost and compact actuation configuration to maximize the accessibility of the PAM. (2) We evaluate the effect of the actuation motion inaccuracy on image quality. The recent trend on developing miniaturized, compact, and affordable PAM systems may raise a concern about the reliability in the positioning accuracy. The low-precision actuators can induce artifacts and the degradation of the reconstructed PA image quality due to the incoherent wavefront. We evaluate the relationship between image degradation and data acquisition positioning inaccuracy. (3) We assess the mitigation of the image degradation associated with the actuation precision uncertainty through advanced beamformers combined with synthetic aperture focusing techniques (SAFT). DAS+CF and DMAS, are selected as two representative advanced reconstruction algorithms.
This paper first introduces the system design and overview. Then, the image degradation due to the positioning inaccuracy of an actuator and the image quality enhancement through advanced SAFTs are evaluated in the simulation. The imaging performance of the system is experimentally validated using pencil lead and tubing phantoms, as well as an ex-vivo sample. Finally, the advantages of the delta actuation configuration and limitations of the current implementation are discussed.
Materials and Methods
System Architecture and Delta Configuration Actuator
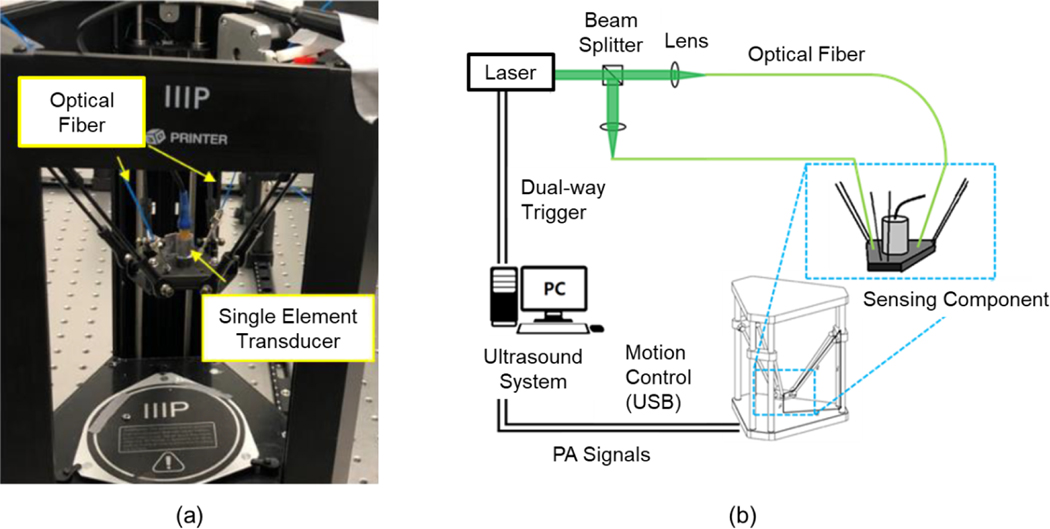
Fig. 1 (a) shows the proposed AR-PAM system based on the delta configuration actuator. Delta configuration mechanism is a three DOF parallel structure. This mechanism provides high motion precision and maximizes effort from the actuator that guarantees the performance of the PAM[37–39]. The simplicity of the structure reduces the cost of manufacturing and maintenance. Components used for communicating with the host workstation and other specific protocols are summarized in Fig. 1 (b). The Verasonics Vantage system was used as the host controller (Vantage 128, Verasonics, USA). The host controller was based on the Windows 10 operating system with Intel Xeon W-2155 CPU, 32GB RAM, NVIDIA Quadro P2000 graphic card, and specific factory settings to provide the optimal performance as an ultrasound system[40]. A single-element focused ultrasound transducer (IAR202, ndtXducer, USA) with a center frequency of 20 MHz and a focal length of 12.4 mm was used. The transducer has an element dimension of 6.2 mm. A Q-switched Nd:YAG laser (Q-smart 450, Quantel, USA) with an optical parametric oscillator (OPO) (MagicPRISM, OPOTEK, USA) was used, which is capable of generating the wavelengths of 690–950 nm at a repetition rate of 20 Hz with 5 ns pulse duration. To translate the sensing component, an off-the-shelf 3D printer (MP Mini Delta 3D Printer, Monoprice, USA) modified by the researchers was used. This actuator provided a maximum scan area of 100 mm in diameter with a 120 mm height at a minimum step size of 50 μm. The advertised motion precision is 12.5 μm in X and Y axis[41]. The 3D printing nozzle was removed and replaced by the sensing component comprised of optical fibers and the single element transducer.
Fig. 1.
The AR-PAM system based on delta-configuration actuation. (a) The imaging system and sensing component, and (b) system components and communication protocols.
The entire system, including the laser control, data collection, signal processing, and actuator motion control, was operated in the Matlab (Matlab, Mathworks, USA) environment. The prolific sub-200 USD delta 3D printer market proved to be a reasonable motion precision actuator that can be mass-produced at a low cost, which rationalizes the usage of the proposed mechanism in microscope design. A programmable motion platform allows for a flexible scanning trajectory, which is desired when prototyping and research[42]. The controller of the printer communicates using g-code commands in real-time through serial communication from the host workstation. The g-code is a widely-used programming language in computer-aided manufacturing to control the position and velocity of the automated machine. The controller calculates the inverse kinematics with its specification and drives the motor to perform the desired signal collection trajectory.
The AR-PAM scans the target sample by first collecting channel data, which is radiofrequency (RF) PA data, following the predefined scanning path. Once the data collection is completed, the recorded PA signals are processed using software with filters and beamforming algorithms as described below in detail to reconstruct high-resolution 3D PA images. Considering the potentially compromised motion precision of a low-cost actuator, advanced beamforming algorithms were implemented to mitigate the associated image quality degradation.
Optical Components
To deliver optical energy to the area-of-interest, the optical path is optimized to uniformly illuminate the target. The output pulses from the laser are split into two beams with the beam splitter (47–009, Edmund Optics, USA) and individually coupled to quartz optical fibers (core diameter, 600 μm; NA, 0.39) using a plano-convex lens (focal length, 100 mm)[16] as shown in Fig. 1(b).
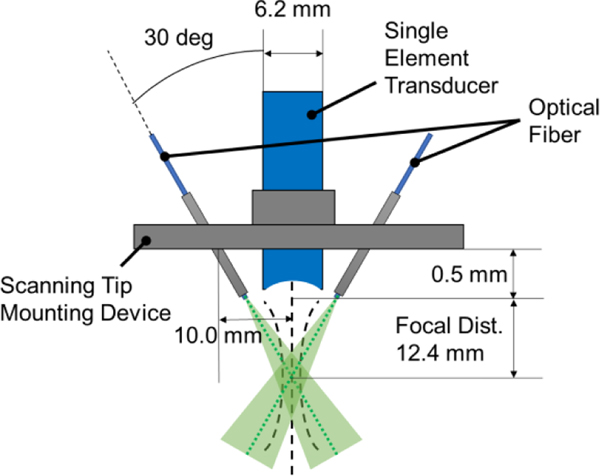
The end-effector of the AR-PAM is also designed to provide optimal light illumination. The mounting part is designed and 3D-printed to properly fix the PA sensing component on the delta configuration platform as well as align the optical fibers with respect to the transducer position. The output ends of the fibers are placed in the steel tube to fix the angle where the centerlines of the laser beams intersect at the focal depth of the acoustic beam, as shown in Fig. 2. Therefore, the target located at the focus depth will receive the maximum optical energy to generate strong PA waves.
Fig. 2.
The design parameters of the scanning tip of the AR-PAM. Two optical fibers are fixed at an angle to maximize the laser energy at the focal depth of the acoustic beam. The green area indicates laser illumination.
System Synchronization
To map the accurate depth of the received thermoelastic expansion signal by the single element transducer, laser illumination must be excited at proper timing. This requires time synchronization of the transducer data acquisition and laser transmission. The laser is excited at a maximum rate of 20 Hz while the ultrasound system has a higher frequency. The laser emission has two stages. The first step is the energy pump getting ready which is called flashlamp in the system. Then the Q-switch excites the laser and generates a pulsed laser beam. To synchronize the laser with the data collection, the triggering signal function is utilized.
When the pump on the laser is ready, a trigger signal is sent to the ultrasound system. The ultrasound system waits for this signal and sends a trigger signal out to excite the laser and start collecting the signal simultaneously. There is a fixed delay period before laser emission is introduced by system synchronization and program execution. Once the PA signal is collected, the system continues the next process.
The fixed delay during the process is measured and automatically fixed in the collected RF data. The calibration is achieved by the capability of the system to scan the ultrasound imaging and PA imaging at the same time. Ultrasound imaging relies on acoustic reflection in the layer between two acoustic property materials, while a PA signal is generated by the thermoelastic expansion from the contrast agent. Given the contrast mechanisms of two imaging modalities, the traveling time of the PA signal from the same target should be equal to half of the ultrasound signal. By using this approach, the synchronization of the laser transmission and ultrasound acquisition was achieved.
Beamforming Photoacoustic Imaging
In PA microscopy, a one-dimensional PA signal (A-line) is acquired in each shot, with information on the energy absorption property mapping the time arrival. Through the transducer scanning along with the two transverse directions, a volume PA image can be obtained. In AR-PAM, the axial resolution depends on the numerical aperture and the bandwidth of the transducer. The lateral resolution depends on the focal width of the single element transducer. However, with the depth penetration capability of AR-PAMs, the image quality in the out-of-focus region is significantly degraded. Also, the low-cost actuation design leads to a certain level of lateral resolution decrements. To solve this issue, SAFT with a virtual detector (VD) was applied to expand the focal region of the microscopy. In DAS algorithm, a certain angular extension from the VD is assumed to be able to detect the signal. The collected off-axis signals are combined with the time delay calculated based on the overlapping radiation field[43].
In this research, DAS algorithm was implemented to the obtained PA signals as a baseline for 3D image reconstruction. However, if an off-axis target occurs in the scanning direction, the delayed signals are no longer in phase. Then, the information from the off-axis target dominates the SAFT applied signals rather than the synthesized direction target in this case. By introducing the coherence factor (CF) as a weighting coefficient, the image quality can be further improved[44]. DMAS algorithm is another approach to reinforce the signal components by combinatorially coupling and multiplying the delayed signal[45]. DAS+CF[44] and DMAS[45] were implemented to obtain high-quality PA images, as well as compensate for the image distortion introduced by the actuator.
Implementation
Simulation Setup
Simulation studies were conducted to evaluate how motion inaccuracy affects the acquired PA image quality. K-Wave software was used for the time-domain PA acoustic wave simulation[46]. A 3D simulation environment with a space of 8×8×7.4 mm3 was set. Five point targets (Diameter: 20 μm) were placed at the depth of 3, 4, 5, 6, and 7 mm with respect to the transducer plane. The transducer elements were placed apart from each other at a distance of 100 μm to simulate the mechanical scanning process with a 100 μm step size. A random position error with a controlled standard deviation was applied to the sensor position on each trial when assigning this parameter to simulate the actuator’s mechanical motion error. We used the default sensor setting in terms of the directivity and bandwidth of the detectors. The sensor is omni-directional, and the sensor is a broadband point detector. The generated channel data were then used to form a PA image by applying three beamforming algorithms, DAS, DAS+CF[44], and DMAS[45]. The effect of motion error on PA image formation was assessed. The ability of the advanced beamforming algorithms to compensate for the motion error and to reduce the background noise was evaluated. The background white noise was added to the simulated RF signals to evaluate the enhancement of the algorithms in both image resolution and contrast. The noise amplitude was set at 40 dB signal-to-noise ratio (SNR).
Phantom and Ex-vivo Evaluation
The phantom studies were conducted using pencil leads and microtubes to evaluate the PA imaging quality taken with the actuator based on delta configuration. Four pencil leads with a diameter of 200 μm (Pentel Ain Pencil Leads 0.2mm 2B, Japan) were placed with 5 mm depth apart: the depths were at 14 mm, 19 mm, 24 mm, and 29 mm from the surface of the ultrasound transducer, which is 1.6 mm, 6.6 mm, 11.6 mm, and 16.6 mm away from the focal depth of the transducer, respectively. Pencil leads allow the evaluation of system resolution and contrast at varying depths, and the applicability on the more complicated structure was demonstrated using microtubes. Polyethylene tubes (Outer diameter (OD): 610 μm, inner diameter (ID): 280 μm) were filled with two different materials; the ink tubes were filled with diluted India ink (ink-to-water ratio, approx. 1:4) and the water tubes were set as a negative comparison group. PA images of the tubing phantom were collected with two different depth (distance from the phantom plane to the transducer) settings: near focal depth, 16.5 mm from the transducer surface (4.1 mm from the focal depth), and far from focus depth, 24.5 mm from the transducer surface (12.1 mm from the focal depth). The 3% concentration of diluted milk was added to water for both phantom studies to introduce optical scattering[47].
In addition, an ex-vivo study was conducted to evaluate the imaging capability of biological samples. Polyethylene tubes (OD: 965 μm, ID: 580 μm) were used to mimic the blood vessels, where heparinized mouse blood was injected. The tubes were inserted into a chicken breast at approximately 5 mm from the surface. The prepared sample was submerged underwater for imaging. The focal depth of the ultrasound transducer was set at a 2 mm distance from the surface of the chicken breast.
In all phantom and ex-vivo experiments, a 20 mm × 20 mm square area in the X-Y (lateral) plane of the actuator was scanned. The step size of the system was set to be 200 μm. The scanning trajectory of the proposed PAM was designed to minimizing the potential actuation position inaccuracy introduced by the low-cost actuator. Single-direction raster scanning was implemented. The sensor tip moved along the X-axis from its starting point and performed a move-stop-scan routine. After 100 steps (20 mm) were scanned, the transducer returns to the initial coordinates then moves to the next line on Y-axis. The motion pattern repeated until it reached 100 steps (20 mm) in the Y-direction. This approach minimizes the systematic actuation error caused by mechanical components such as gears and belts. Compared to bi-directional raster scanning, single-direction raster scanning reduces the motion inaccuracy by 0.17 mm between scanning lines observed during our preliminary design testing.
At each motion step, the transducer position was paused to collect multiple PA signals. The wavelength of 725 nm was used for imaging. To suppress the random white noise and to improve the SNR, the PA signals were collected and averaged 10 times. An ultrasound image acquisition was conducted as a reference group. The recorded PA signals were post-processed with three beamforming algorithms that are the same from the simulation study: DAS, DAS with Coherence Factor (DAS+CF), and DMAS reconstruction algorithms. The image contrast and resolution were evaluated through SNR and FWHW.
Image quality evaluation
The full width at half maximum (FWHM) value of the cross-sectional PA signal profile was measured to evaluate the spatial resolution of the acquired data. The image contrast was quantified by SNR, which mathematic formula is defined as follows,
| (1) |
where Ppeak is the PA signal amplitude and σnoise is the standard deviation of background noise. The noise region was selected at the same depth as the peak signal present and more than 1 mm away in the lateral direction from each peak.
Results
Simulation Analysis of Actuation Motion Error
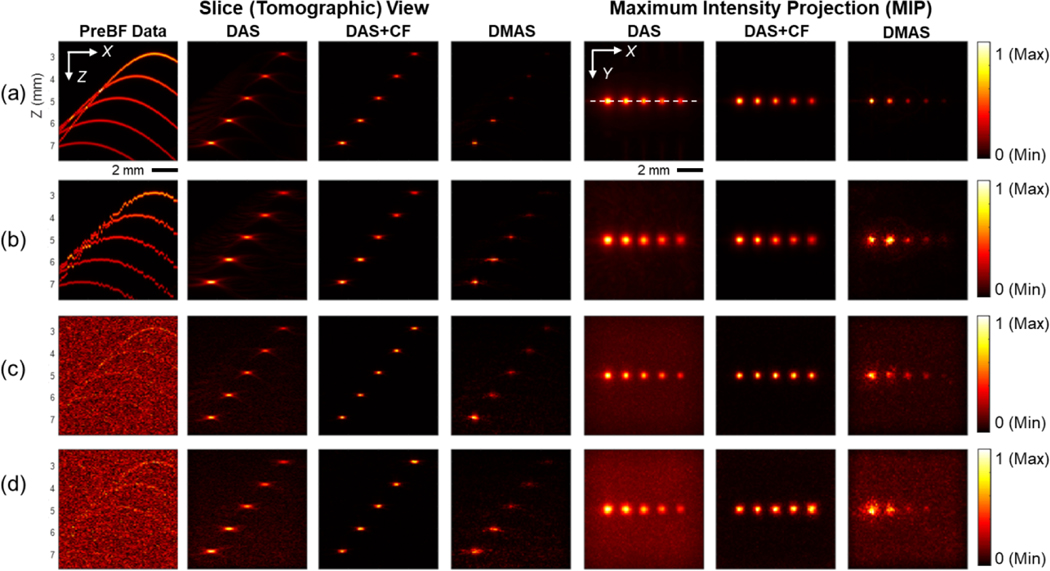
Simulation studies were conducted to evaluate the effect of the actuation motion inaccuracy on reconstruction. A randomized error was added to the transducer position with a controlled standard deviation to reproduce the actuation inaccuracy. PA data were simulated in a 3D space and a 2D plane to evaluate the 3D PA image visualization and provide a more thorough quantified image quality, respectively. The sliced view and maximum intensity projection (MIP) results of the 3D simulation are presented in Fig. 3. The lateral signal profile of the point target located at the depth of 5mm is shown in Fig. 4. The detailed quantification of FWHM and SNR of the 5 mm depth target is presented in Table 1. The simulated point scatterer has the diameter of 20 μm. With no error, the raw pre-beamformed image contained the curved wavefront from the off-axis signals, generated from targets not directly located under the transducer. With DAS beamforming, the reconstructed point targets were confirmed. Two advanced algorithms (DAS+CF and DMAS) provided improved visualization with fewer sidelobes at all depths. As the step size of the scanning is set to be 200 μm, the same amount of motion inaccuracy in standard deviation was added in the simulation. With this inaccuracy, the wavefronts in the pre-beamformed image were distorted, and the targets became blurred in the DAS result, while the change was not obvious in the results using the advanced beamforming algorithms. Beamforming could suppress the background noise, especially with DAS+CF and DMAS algorithms. The 3D simulation suggests that SAFT algorithms can reconstruct the point targets well under the presence of high actuation error and background noise. The two advanced beamforming algorithms presented a higher tolerance in actuation inaccuracy and background noise compared to DAS algorithm.
Fig. 3.
The PA imaging results of the 3D simulation through the slice (tomographic) plane view in the X-Z plane and MIP. The color bar represents the normalized PA intensity. (a) The condition with no sensor position error and no background noise, b) The condition with the sensor placing error of 200 μm in standard deviation, c) The condition with a 40dB SNR white noise included and with no sensor placing error, d) The condition with the sensor placing error of 200 μm in standard deviation and with a 40dB SNR white noise included.
Fig. 4.
Lateral profiles of the simulated PA images for the target located at the depth of 5 mm. Subfigures (a)–(d) correspond to the conditions of (a)-(d) in Fig. 3.
Table 1.
Image quality evaluation for the simulated point target located at the 5 mm depth
| No error, No noise | 200μm error, No noise | No error, 40dBSNR | 200μm error, 40dBSNR | |||||
|---|---|---|---|---|---|---|---|---|
| FHWM [mm] | SNR [dB] | FHWM [mm] | SNR [dB] | FHWM [mm] | SNR [dB] | FHWM [mm] | SNR [dB] | |
|
|
|
|
|
|||||
| DAS | 0.39 | 46.27 | 0.54 | 42.71 | 0.37 | 32.13 | 0.55 | 30.22 |
| DAS+CF | 0.32 | 72.60 | 0.34 | 69.13 | 0.27 | 59.68 | 0.31 | 48.07 |
| DMAS | 0.30 | 75.22 | 0.28 | 81.70 | 0.32 | 43.54 | 0.33 | 38.44 |
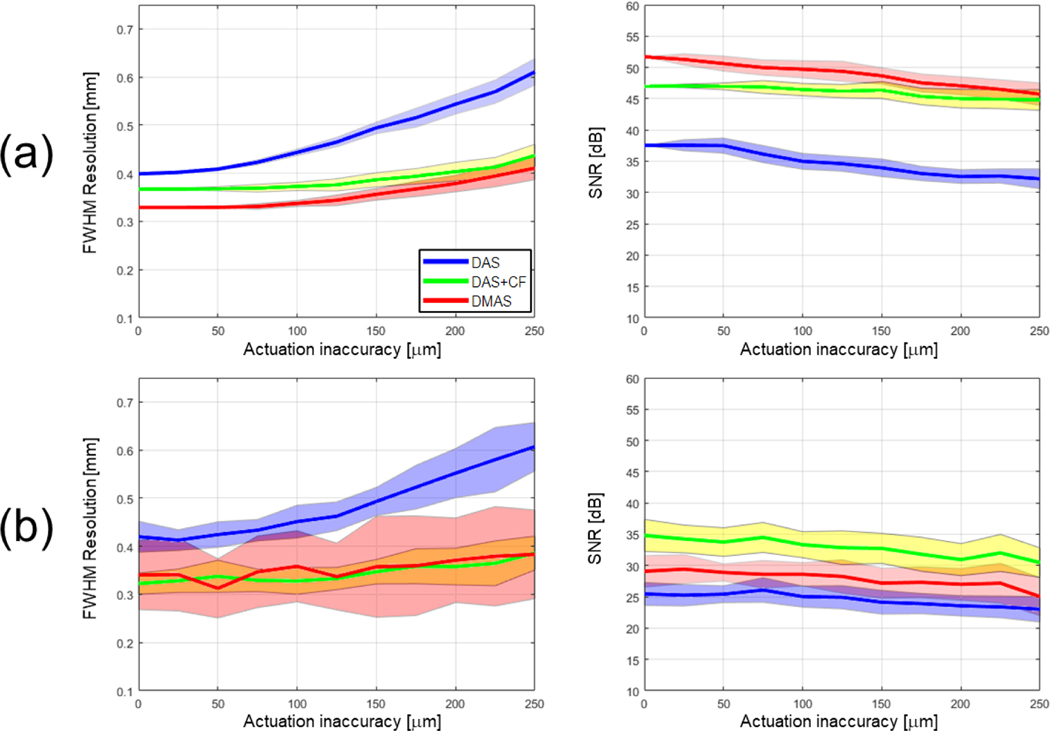
To further evaluate the change in image quality with increased actuation inaccuracy, Fig. 5 summarizes the statistical results of the three beamforming algorithms: DAS, DAS+CF, and DMAS through 2D plane simulation. Each data point presents the average FWHM and SNR of five point targets (the diameter of 20 μm) to capture the trend of image quality under different reconstruction and noise conditions. The motion inaccuracy up to 250 μm was evaluated with an intermediate step of 25 μm. The image quality metric was computed based on the average value of five targets. For each condition and motion inaccuracy group, the quantifications were repeated 32 times to present the mean and the standard deviation. The image quality variation with and without the presence of background noise (40 dB SNR) was plotted. As the actuation error increased, the FWHM variation with both DAS+CF and DMAS algorithms stayed flatter than DAS algorithm in the high noise environment. Lateral resolution in FWHM and contrast in SNR were affected less than 5% when the 50 μm actuation motion error was present. The presence of the background noise provided a higher tolerance in the actuation inaccuracy in terms of FWHM (Figs. 5a and 5b).
Fig. 5.
The image quality evaluation in resolution and contrast corresponds to the increased sensor position errors under different beamforming algorithms. The color-ranged boundary represents the standard deviation. (a) The image quality variation without including white noise, and (b) the image quality variation when a 40dB SNR white noise is added to the RF signal.
Phantom and Ex-Vivo Evaluation
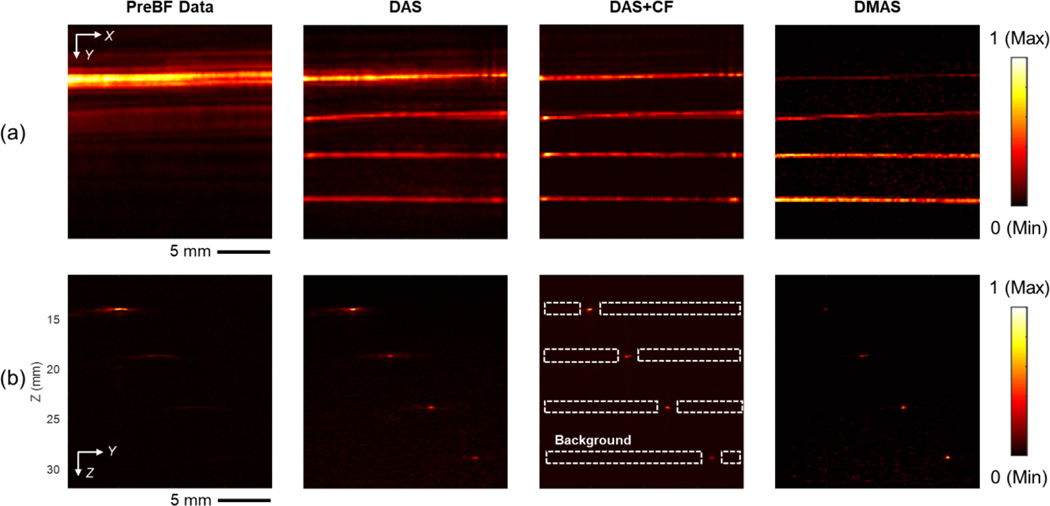
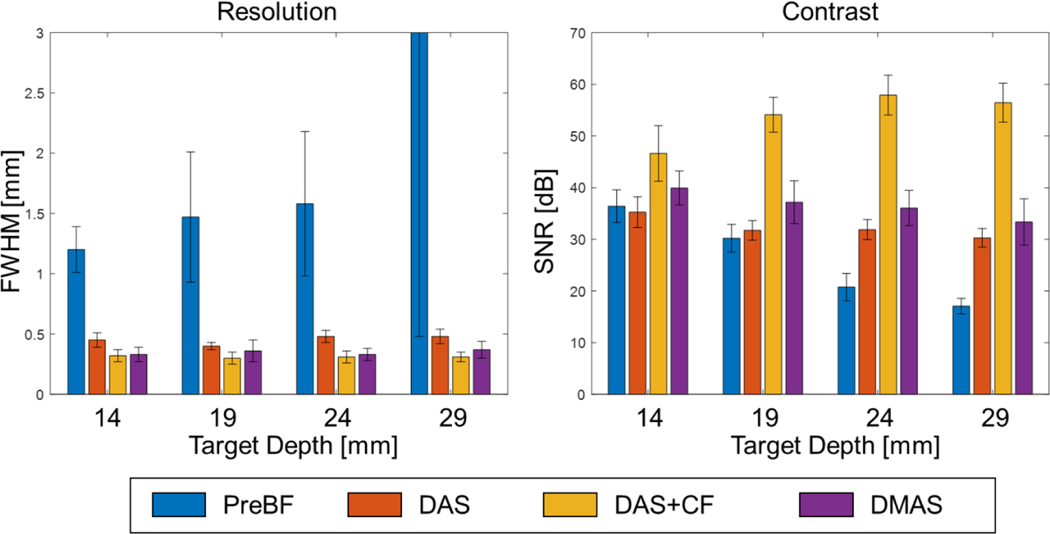
The results of the pencil lead phantom study are shown in Fig. 6. Four pencil leads at different depths were well focused after the 3D reconstruction, which shows the dynamic focusing capacity of the proposed system. Fig. 7 displays the quantified image quality. The algorithms successfully focused the target on different depths. The average FWHMs for all depths were 0.45±0.06 mm, 0.31±0.04 mm, and 0.35±0.07 mm, by applying the DAS, DAS+CF, and DMAS algorithms, respectively. The improvement in image resolution and contrast is observed in the results using DAS+CF and DMAS algorithms compared to that of DAS. DAS+CF algorithms superiors over DMAS in both resolutions and contrast, which is the same as the non-noise condition in simulation.
Fig. 6.
The PA imaging results of the pencil-lead phantom, four pencil leads were placed at 14 mm, 19 mm, 24 mm, and 29 mm from the surface of the ultrasound transducer, which is 1.6 mm, 6.6 mm, 11.6 mm, and 16.6 mm away from the focal depth of the transducer, respectively. (a) The MIP images of pre-beamformed data, DAS, DAS+CF, and DMAS reconstruction. (b) The corresponding cross-section slices at X = 10 mm position. The depth axis unit presents the distance from the transducer surface (the focal depth is 12.4 mm). The color bar represents the normalized PA intensity. The dot section is the background used to compute SNR.
Fig. 7.
Image quality evaluation of the pencil-lead phantom imaging results in resolution and contrast. Note that the FWHM value measured for the target located at 29 mm depth (5.05 ± 4.57) exceeds the display range.
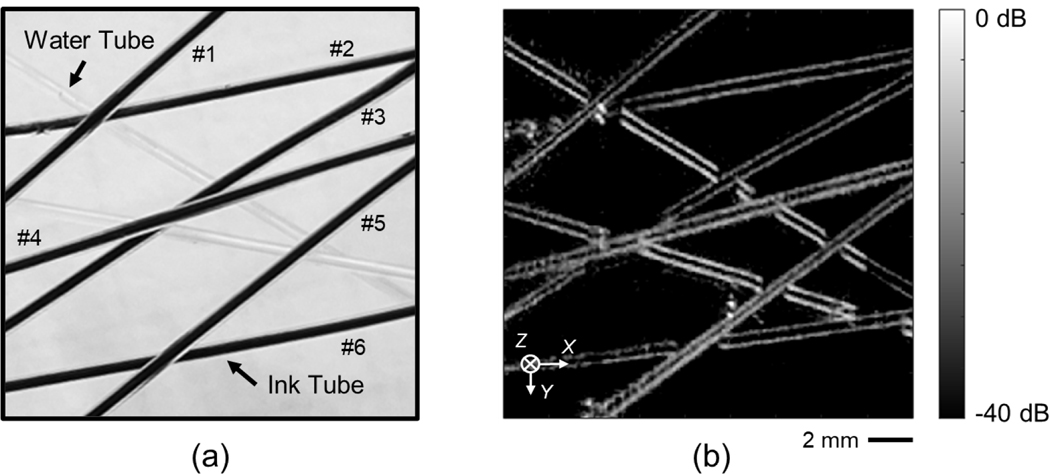
Microtubes were used to reproduce a phantom mimicking the blood vessel. Ultrasound imaging results with DAS beamforming are shown in Fig. 8. The ultrasound image serves as the baseline to validate the system functionality in motion control, data collection, signal processing, and image reconstruction. Both tubes with water and ink were visible.
Fig. 8.
The picture (a) and ultrasound image (b) of the tubing phantom. The number labels in (a) show the ink tube identification. The ultrasound image is beamformed with DAS algorithm.
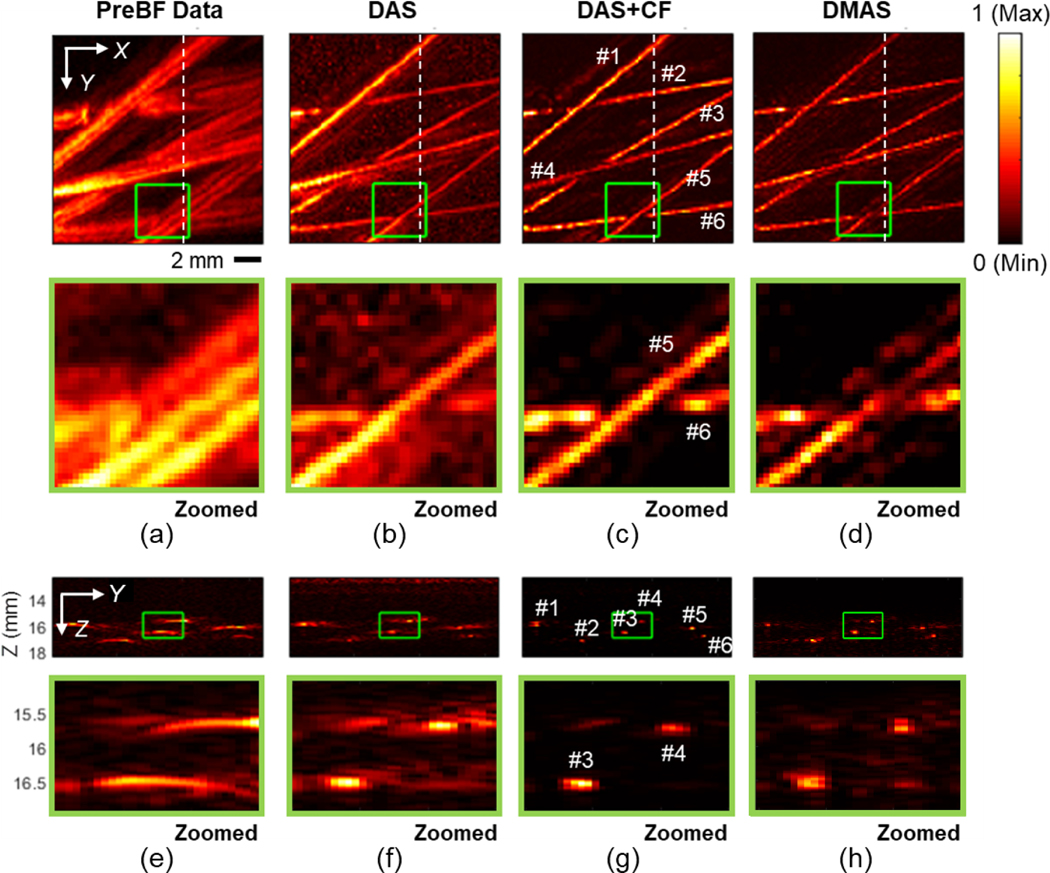
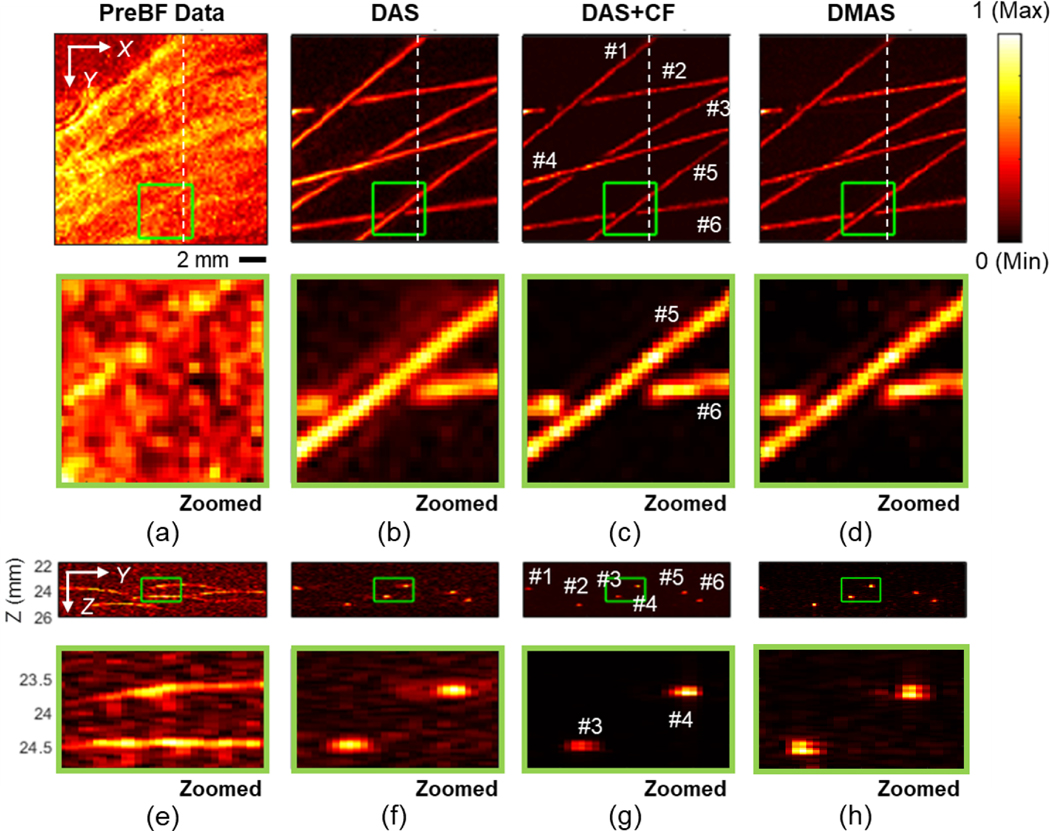
Fig. 9 shows the PA image results of the near focal depth scanning when the tubing phantom was placed at a 16.5 mm depth (4.1 mm from the focal depth of the transducer). Figs. 9a–d displays the MIP image on the X-Y plane of the 3D PA image and their zoomed-in images, respectively. In Figs. 9e–h, the Y-Z cross-section slice shows the images at X = 10 mm, and their zoomed-in images are shown, respectively. The phantom structure with India ink could be reconstructed well in all conditions including the raw channel data, because the phantom location was near the focal depth. The target visualization was further enhanced in the results with 3D reconstruction. The artifacts and sidelobes were particularly suppressed in two advanced beamforming algorithms (DAS+CF and DMAS), resulting in image quality enhancement. The FWHM and SNR quantifications based on tubes #3 and #4 in Fig. 9 under different reconstruction algorithms are summarized in Table 2. DAS reconstruction improved the image quality in both resolution and contrast. With the two advanced reconstruction algorithms (DAS+CF and DMAS), the image quality was further improved.
Fig. 9.
The PA imaging results of the microtube phantom placed at the depth of 16.5 mm from the transducer surface (4.1 mm from the focal depth of the transducer). (a) Pre-beamformed data, (b) DAS, (c) DAS+CF, and (d) DMAS reconstruction results with the images corresponding to cross-section slices at X = 10 mm position (e) – (h) are presented. The depth axis unit presents the distance from the transducer surface (the focal depth is 12.4 mm). The color bar represents the normalized PA intensity.
Table 2.
Image quality evaluation of the microtube phantom imaging results
| Depth = 16.5 mm | Depth = 24.5 mm | |||||||
|---|---|---|---|---|---|---|---|---|
|
|
||||||||
| Tube #3 | Tube #4 | Tube #3 | Tube #4 | |||||
|
|
||||||||
| FWHM [mm] | SNR [mm] | FWHM [mm] | SNR [mm] | FWHM [mm] | SNR [mm] | FWHM [mm] | SNR [mm] | |
|
| ||||||||
| Pre-beamformed | 2.66 | 29.59 | 1.91 | 32.56 | 2.63 | 17.32 | 1.06 | 13.62 |
|
| ||||||||
| DAS | 0.49 | 31.11 | 0.54 | 31.42 | 0.49 | 28.79 | 0.4 | 32.33 |
|
| ||||||||
| DAS+CF | 0.31 | 41.04 | 0.34 | 35.67 | 0.34 | 44.94 | 0.3 | 52.28 |
|
| ||||||||
| DMAS | 0.37 | 31.25 | 0.27 | 35.47 | 0.38 | 39.28 | 0.32 | 41.57 |
The results of the PA image based on the far depth, 24.5 mm from the transducer (12.1 mm from the focal depth), are shown in Fig. 10. The quantification results based on tubes #3 and #4 are summarized in Table 2. Lower SNR is observed before applying beamforming due to the reduced PA signal amplitude associated with the increased distance from the focal depth of both sound and light. Less light energy reaches the target combining with more acoustic signals being absorbed and scattered as the depth increases. The PA signal amplitude detected by the sensor decreases, while the background noise maintains at a similar level which combinatorically led to lower SNR. The tubing targets were barely visible in the pre-beamformed result. The 3D synthetic aperture reconstruction recovered the dynamic focus and visibility of tubes with ink. Between the two advanced beamforming algorithms, DAS+CF provides higher resolution and contrast comparing to DMAS when the target is deeply located.
Fig. 10.
The PA imaging results of the microtube phantom placed at the depth of 24.5 mm from the transducer surface (12.1 mm from the focal depth of the transducer). (a) Pre-beamformed data, (b) DAS, (c) DAS+CF, and (d) DMAS reconstruction results with the images corresponding to cross-section slices at X = 10 mm position (e) – (h) are presented. The depth axis unit presents the distance from the transducer surface (the focal depth is 12.4 mm). The color bar represents the normalized PA intensity.
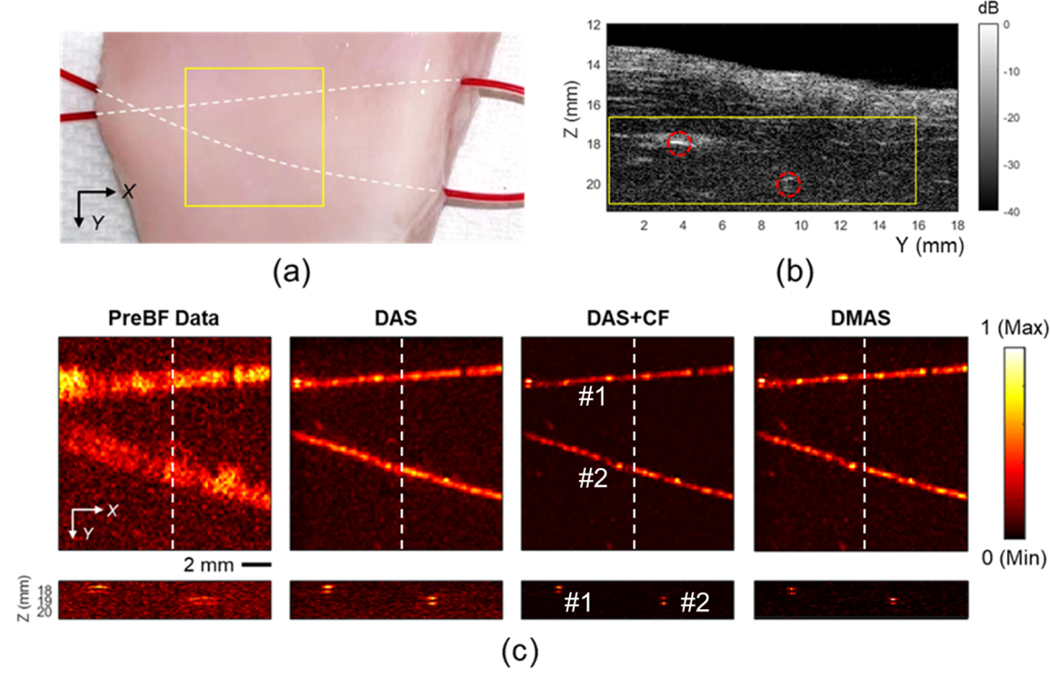
The ex-vivo study was performed aiming to evaluate the imaging capability of the developed AR-PAM with the biological samples. The chicken breast represented the attenuation and scattering effects of biological tissue, and the mouse blood served as the endogenous contrast agent. The results are shown in Fig. 11. The ultrasound image (Fig. 11b) depicts the anatomy of the sample. The blood contained in the tube was imaged in PA imaging (Fig. 11c). The quantification was summarized in Table 3. The position of microtubes captured in the PA image matches that in the ultrasound image. Two tubes were well focused under 3D SAFT. The background noise and other artifacts were significantly suppressed with two advanced algorithms. Comparing between two advanced beamforming algorithms, DAS+CF provided higher image contrast by 4.62dB on average, while the average resolution with both algorithms were comparable.
Fig. 11.
The results of the ex-vivo study. (a) The picture of the chicken breast sample with the mouse blood-contained microtube embedded. The yellow region covers the imaging area. (b) The ultrasound image of the sample corresponding to the cross-section slice at X = 10 mm position in the PA image. The tube locations are highlighted in red. (c) The PA images of the sample with pre-beamformed data and DAS, DAS+CF, and DMAS reconstruction results (first row) and the corresponding cross-section slices at X = 10 mm position (second row). The depth axis unit presents the distance from the transducer surface (the focal depth is 12.4 mm). The color bar represents the normalized PA intensity.
Table 3.
Image quality evaluation of the ex-vivo imaging results
| FWHM [mm] | SNR [dB] | |||
|---|---|---|---|---|
| Tube #1 | Tube #2 | Tube #1 | Tube #2 | |
|
|
|
|||
| Pre-beamformed data | 1.67 | 1.41 | 18.81 | 21.51 |
| DAS | 0.58 | 0.58 | 29.73 | 28.42 |
| DAS+CF | 0.35 | 0.32 | 45.62 | 38.20 |
| DMAS | 0.30 | 0.35 | 40.75 | 33.82 |
Discussion
The simulation studies examined the relationship between the positioning inaccuracy of an actuator and the degradation of the PA image quality. The varied magnitude of random errors simulates the influence of the low-resolution actuator and other positioning inaccuracies. The developed simulation platform could serve as the benchmark to evaluate the tolerance of positioning inaccuracies when developing a low-cost or/and miniaturized PA imaging device. Our contribution aligns with the recent trend of extending the accessibility of PA imaging via a handheld or wearable configuration [25,34,35].
Additionally, we demonstrated the contribution of the advanced SAFTs for compensating the image degradation caused by the positioning inaccuracy of an actuator. The image quality reconstructed by the SAFTs maintained within 5% degradation in both FWHM and SNR during the presence of a 50 μm position inaccuracy compared to the baseline (no position inaccuracy). DAS+CF and DMAS algorithms presented a significant superiority over DAS algorithm in compensating for the actuation inaccuracy. Compared to the results with no positioning inaccuracy, the image quality stayed within 25% degradation in the FWHM and SNR with the sensor position error of 200 μm, which is equivalents to a skipping step during scanning. DAS+CF algorithm shows higher tolerance to the noisy environment in terms of image contrast. With 40 dB noise existing, the SNR in DAS+CF result is the highest compared to the conventional algorithm (DAS) and DMAS. The results with DAS+CF algorithm provide higher stability in FWHM based on its standard deviation, comparing to that with DMAS algorithm when the noise is present. Note that tissue inhomogeneity and signal diffraction were not considered in this simulation work and could worsen the image quality. The image reconstruction in the simulation was cross validated through an experiment using a phantom made of pencil leads.
We compared the PA image with the corresponding ultrasound image in the tube phantom studies. The ink tubes appeared as the tube boundary in the ultrasound image, while the contained ink was visible in the PA image. The optically transparent water tubes were only visible in the ultrasound image. The ex-vivo study successfully demonstrated the sensitivity of the developed system of detecting the endogenous blood contrast embedded in the biological tissue. The mimicking blood vessels can be imaged at the depth of 5 mm under the tissue surface.
The CF weighs the pixel of the reconstructed image based on the spatial spectrum of the aperture. The off-axis pixel, of which delayed signals are no longer in phase, are degraded so that the contrast of the image is improved [44]. In DMAS algorithm, the coupling operations provide more equivalent RF signals for the summing operation than DAS[45]. Therefore, the two advanced SAFT algorithms provide higher image quality than the conventional algorithm. The CF shows higher sidelobe degradation functionality between the two advanced algorithms than the coupling operation provided by DMAS. With a deeper target, this sidelobe introduces a greater level of noise. Hence, the image quality with DMAS was worse in contrast compared to the CF algorithm.
The delta configuration offers advantages on the cost, size, and ease of use over other actuators used in the previous PAM designs with the trade-off in motion resolution and accuracy. The delta configuration has been used for a single element ultrasound imaging system [42]. To the best of our knowledge, its usage in PA imaging is introduced for the first time. Table 4 summarizes the spec of representative translation stages and low-cost 3D printers in both delta and Cartesian configurations. The cost and size for the motorized translation stages could further be higher by including the controller and actuating multiple axes. Most 3D printers include the three DOF actuation configurations with a built-in programmable controller. The drawback of using 3D printers is the limited actuator step size and accuracy, for which we proposed to use the advanced SAFTs to compensate for the effect of inaccuracy. When comparing the proposed delta configuration with the Cartesian configuration, the Cartesian configuration provides more constant motion resolution due to simpler kinematics. In contrast, the delta configuration carries the actuators on its frame, and the weight on the end-effector tip can be reduced compared to the Cartesian actuator. This weight reduction of the tip reduces inertia and enables quick acceleration of the optical component while preserving its accuracy. The lower maintenance and manufacturing costs are achievable because of the simplified construction and the requirement of fewer parts for fabrication. More importantly, most of the Cartesian 3D printers achieve the lateral plane motion by translating the bed vertically. Moving the bed where the sample is placed is not preferred for the risk of inducing motion artifacts and complicating the experimental setup for biomedical applications. The delta configuration moves the end-effector tip vertically without involving the sample motion. These features affirm the suitability of the delta configuration for the design of compact and high-resolution microscopy.
Table 4.
Summary of comparing the spec of three actuator configurations
| Actuator name | Lateral Motion range [mm] | Minimum step size [μm] | Size [mm] | Price [USD]* |
|---|---|---|---|---|
|
| ||||
| Delta Actuation-Based 3D Printer (Num of Axes: 3; Controller Included: Yes) | ||||
|
| ||||
| Monoprice MP Mini Delta 3D Printer** [41] | Ø110 | 50 | 360×440×480 | 199 |
| FLSUN Q5[48] | Ø200 | 50 | 300×300×650 | 280 |
| SeeMeCNC Rostock MAX V4[49] | Ø280 | 50 | 430×410×1130 | 1400 |
|
| ||||
| Cartesian Actuation-Based 3D Printer (Num of Axes: 3; Controller Included: Yes) | ||||
|
| ||||
| Monoprice MP10 Mini 3D Printer [50] | 200×200 | 50 | 400×533×400 | 299 |
| Creality CR-6 SE[51] | 235×235 | 10 | 442×462×540 | 430 |
| Original Prusa i3 MK3S+[52] | 250×210 | 10 | 550×400×500 | 749 |
|
| ||||
| Translation Stage (Num of Axes: 1; Controller Included: No) | ||||
|
| ||||
| OSMS20-(X), Sigma koki [17,53] | 35 | 2 | 183×61×36*** | 1000 |
| L406, Physik Instrumente [54,55] | 102 | 0.24 | 205×65×36*** | 2599 |
| M403 2DG, Physik Instrumente [27,56] | 200 | 0.2 | 255×80×40*** | 2147 |
The listed price is as of 12/27/2020.
Used in this paper.
Not including the controller size.
Several limitations on the implementation and validation of the proposed delta configuration AR-PAM system were uncovered. First, the system synchronization limited the scanning time significantly. Scanning of a square area of 20×20 mm corresponded to 100,000 A-lines in total based on the step size of 0.2 mm with the averaging filter size of 10, and it took approximately 90 minutes. The laser pulse repetition frequency of 20 Hz limits the scanning speed of the AR-PAM. This scanning rate was reasonable yet challenging to improve with the current component setup. The speed required a trade-off between the total scanning time with the filter size and the scanning step size. In other words, the balance between image quality and scanning speed should be considered. Second, 3D image reconstruction requires intensive computational power. The high-configured workstation (CPU: AMD Ryzen threadripper 3970× 32-core processor, Memory: 125.7 GB, GPU: TITAN RTX) was used along with Matlab parallel CPU computing. With the data size of 10,000 filtered A-lines, 3D DAS reconstruction took three minutes, and DAS with the CF algorithm took four minutes. DMAS required the longest computation time of 25 minutes. Third, the imaging performance over variable depth range can be investigated further. The penetration depth of the AR-PAM was not evaluated in the bio-sample in this research. In the optical scattering medium, the image quality degradation on contrast was observed. With two advanced reconstruction algorithms, the image quality maintains at different depths. In both simulation and phantom studies, the image qualities of deeper targets were better than those of shallower targets. The cause of the image quality improvement at deeper targets is attributed to the effective aperture area expansion corresponding to the depth increase due to the use of a fixed f-number for 3D beamforming. With the extended aperture, the deeper targets can involve more coherent components that allow DAS+CF and DMAS to obtain higher image quality, comparing to that of shallower targets. This compromises the relative contrast of near field targets compared to that of far field targets after intensity normalization across the 3D volume. Implementing a fixed aperture area at different depths or a weighting function as the time-gain compensation could improve the visual effect over variable depth range. Fourth, the experiment demonstration was conducted with samples submerged under water. For the cases of scanning samples that cannot be placed under water, a setup based on a small water container with an optically and acoustically transparent membrane sealed window can be used [36,57,58]. This allows the sensor tip to move freely in the water without touching the surface of the sample. Finally, additional influential factors, such as motion artifacts and heterogeneous tissue property, could deteriorate the performance of the proposed system when translating from imaging ex-vivo samples to living animals in-vivo.
Future works will focus on solving the existing limitations and adapting the system for preclinical and clinical applications. The expected applications of the device include evaluating the vascular network embedded in the biological tissue. We would like to extend the system evaluation toward the in-vivo study and improve the sample mounting mechanism. Design optimization to reduce the scanning time should also be considered to limits the effect of the motion artifact when imaging living animals. The computation time could be reduced by optimizing the control and reconstructing algorithms and GPU implementation. A combination with a high-speed light source and a low-cost data acquisition unit will further magnify the potential impact of the concept to make PA imaging more accessible and affordable.
Conclusion
The economical delta configuration actuation-based AR-PAM system was introduced to maximize the accessibility of the PAM. The optical fiber and acoustic sensing configuration were integrated into a low-cost, commercially available, off-the-shelf delta configuration 3D printer to form an AR-PAM. The delta configuration allows high motion accuracy and fast acceleration response in motion control with low fabrication and maintenance cost. Additionally, we investigated the relationship between image degradation and data acquisition positioning inaccuracy. This work also evaluated the mitigation of potential actuation precision uncertainty through advanced beamformers combined with synthetic aperture focusing techniques (SAFT). The research demonstrated that two advanced beamforming algorithms (DAS with Coherence Factor (DAS+CF) and DMAS) were tolerant of inaccuracy and errors in simulation. The imaging capability of the developed device was further confirmed through the phantom experiments and an ex-vivo study. Results indicate that AR-PAMs with a compact and low-cost delta configuration combined with advanced beamforming has the potential to create accessible, high-quality PA imaging.
Highlights:
An acoustic-resolution photoacoustic microscopy based on a compact and low-cost delta configuration actuator is introduced.
The effect of the data acquisition positioning inaccuracy on the image quality degradation is studied.
Advanced 3D synthetic aperture focusing methods mitigate the image quality degradation caused by actuation uncertainty.
Acknowledgments
This work was supported by the Worcester Polytechnic Institute internal fund, the Transformative Research and Innovation, Accelerating Discovery (TRIAD) grant, and the National Institutes of Health funding [grant numbers CA134675, EB024495, and DP5 OD028162]. We thank Mrs. Nicole Hermance and Dr. Amity L. Manning for providing heparinized mouse blood.
Footnotes
Declaration of interests
The authors declare that they have no known competing financial interests or personal relationships that could have appeared to influence the work reported in this paper.
Publisher's Disclaimer: This is a PDF file of an unedited manuscript that has been accepted for publication. As a service to our customers we are providing this early version of the manuscript. The manuscript will undergo copyediting, typesetting, and review of the resulting proof before it is published in its final form. Please note that during the production process errors may be discovered which could affect the content, and all legal disclaimers that apply to the journal pertain.
References
- [1].Kruger RA, Liu P, Richard” Fang Y, Appledorn CR, Photoacoustic ultrasound (PAUS)—Reconstruction tomography, Med. Phys 22 (1995) 1605–1609. 10.1118/1.597429. [DOI] [PubMed] [Google Scholar]
- [2].Esenaliev RO, Karabutov AA, Tittel FK, Fornage BD, Thomsen SL, Stelling C, Oraevsky AA, Laser optoacoustic imaging for breast cancer diagnostics: limit of detection and comparison with x-ray and ultrasound imaging, in: Chance B, Alfano RR (Eds.), Opt. Tomogr. Spectrosc. Tissue Theory, Instrumentation, Model. Hum. Stud. II, SPIE, 1997: pp. 71–82. 10.1117/12.280213. [DOI] [Google Scholar]
- [3].Hoelen CGA, de Mul FFM, Pongers R, Dekker A, Three-dimensional photoacoustic imaging of blood vessels in tissue, Opt. Lett 23 (1998) 648. 10.1364/ol.23.000648. [DOI] [PubMed] [Google Scholar]
- [4].Beard P, Biomedical photoacoustic imaging Review, Interface Focus. 1 (2011) 602–631. 10.1098/rsfs.2011.0028. [DOI] [PMC free article] [PubMed] [Google Scholar]
- [5].Hu S, Neurovascular photoacoustic tomography, Front. Neuroenergetics (2010). 10.3389/fnene.2010.00010. [DOI] [PMC free article] [PubMed] [Google Scholar]
- [6].Kim C, Favazza C, Wang LV, In vivo photoacoustic tomography of chemicals: High-resolution functional and molecular optical imaging at new depths, Chem. Rev 110 (2010) 2756–2782. 10.1021/cr900266s. [DOI] [PMC free article] [PubMed] [Google Scholar]
- [7].Hu S, Wang LV, Photoacoustic imaging and characterization of the microvasculature, J. Biomed. Opt 15 (2010) 011101. 10.1117/1.3281673. [DOI] [PMC free article] [PubMed] [Google Scholar]
- [8].Zhang HK, Yan P, Kang J, Abou DS, Le HND, Jha AK, Thorek DLJ, Kang JU, Rahmim A, Wong DF, Boctor EM, Loew LM, Listening to membrane potential: photoacoustic voltage-sensitive dye recording, J. Biomed. Opt 22 (2017) 045006. 10.1117/1.jbo.22.4.045006. [DOI] [PMC free article] [PubMed] [Google Scholar]
- [9].Zhang HK, Chen Y, Kang J, Lisok A, Minn I, Pomper MG, Boctor EM, Prostate-specific membrane antigen-targeted photoacoustic imaging of prostate cancer in vivo, J. Biophotonics 11 (2018) 1–6. 10.1002/jbio.201800021. [DOI] [PMC free article] [PubMed] [Google Scholar]
- [10].Yao D-K, Maslov K, Shung KK, Zhou Q, Wang LV, In vivo label-free photoacoustic microscopy of cell nuclei by excitation of DNA and RNA, Opt. Lett 35 (2010) 4139. 10.1364/ol.35.004139. [DOI] [PMC free article] [PubMed] [Google Scholar]
- [11].Hu S, Maslov K, Tsytsarev V, Wang LV, Functional transcranial brain imaging by optical-resolution photoacoustic microscopy, J. Biomed. Opt 14 (2009) 040503. 10.1117/1.3194136. [DOI] [PMC free article] [PubMed] [Google Scholar]
- [12].Shi W, Shao P, Hajireza P, Forbrich A, Zemp RJ, In vivo dynamic process imaging using real-time optical-resolution photoacoustic microscopy, J. Biomed. Opt 18 (2013) 1. 10.1117/1.jbo.18.2.026001. [DOI] [PubMed] [Google Scholar]
- [13].Yao J, Maslov KI, Zhang Y, Xia Y, Wang LV, Label-free oxygen-metabolic photoacoustic microscopy in vivo, J. Biomed. Opt 16 (2011) 076003. 10.1117/1.3594786. [DOI] [PMC free article] [PubMed] [Google Scholar]
- [14].Zhang HF, Maslov K, Stoica G, Wang LV, Functional photoacoustic microscopy for high-resolution and noninvasive in vivo imaging, Nat. Biotechnol 24 (2006) 848–851. 10.1038/nbt1220. [DOI] [PubMed] [Google Scholar]
- [15].Favazza CP, Jassim O, Cornelius LA, Wang LV, In vivo photoacoustic microscopy of human cutaneous microvasculature and a nevus, J. Biomed. Opt 16 (2011) 016015. 10.1117/1.3528661. [DOI] [PMC free article] [PubMed] [Google Scholar]
- [16].Tsunoi Y, Sato S, Watanabe R, Kawauchi S, Ashida H, Terakawa M, Acoustic-resolution photoacoustic imaging system with simple fiber illumination, in: Photons Plus Ultrasound Imaging Sens. 2013, 2013: p. 85812U. 10.1117/12.2003150. [DOI] [Google Scholar]
- [17].Tsunoi Y, Sato S, Watanabe R, Kawauchi S, Ashida H, Terakawa M, Compact acoustic-resolution photoacoustic imaging system with fiber-based illumination, Jpn. J. Appl. Phys 53 (2014). 10.7567/JJAP.53.126701. [DOI] [Google Scholar]
- [18].Yang J, Gong L, Xu X, Hai P, Shen Y, Suzuki Y, Wang LV, Motionless volumetric photoacoustic microscopy with spatially invariant resolution, Nat. Commun 8 (2017) 1–7. 10.1038/s41467-017-00856-2. [DOI] [PMC free article] [PubMed] [Google Scholar]
- [19].Yao J, Wang LLV, Yang JM, Maslov KI, Wong TTW, Li L, Huang CH, Zou J, Wang LLV, High-speed label-free functional photoacoustic microscopy of mouse brain in action, Nat. Methods 12 (2015) 407–410. 10.1038/nmeth.3336. [DOI] [PMC free article] [PubMed] [Google Scholar]
- [20].Allen TJ, Spurrell J, Berendt MO, Ogunlade O, Alam SU, Zhang EZ, Richardson DJ, Beard PC, Ultrafast laser-scanning optical resolution photoacoustic microscopy at up to 2 million A-lines per second, J. Biomed. Opt 23 (2018) 1. 10.1117/1.jbo.23.12.126502. [DOI] [Google Scholar]
- [21].Allen TJ, Zhang E, Beard PC, Large-field-of-view laser-scanning OR-PAM using a fibre optic sensor, in: Oraevsky AA, Wang LV (Eds.), Photons Plus Ultrasound Imaging Sens. 2015, SPIE, 2015: p. 93230Z. 10.1117/12.2082815. [DOI] [Google Scholar]
- [22].Allen TJ, Ogunlade O, Zhang E, Beard PC, Large area laser scanning optical resolution photoacoustic microscopy using a fibre optic sensor, Biomed. Opt. Express 9 (2018) 650. 10.1364/boe.9.000650. [DOI] [PMC free article] [PubMed] [Google Scholar]
- [23].Cebrecos A, García-Garrigós JJ, Descals A, Jiménez N, Benlloch JM, Camarena F, Beamforming for large-area scan and improved SNR in array-based photoacoustic microscopy, Ultrasonics. 111 (2021) 106317. 10.1016/j.ultras.2020.106317. [DOI] [PubMed] [Google Scholar]
- [24].Zhang HK, Democratizing LED-Based Photoacoustic Imaging with Adaptive Beamforming and Deep Convolutional Neural Network, in: LED-Based Photoacoust. Imaging, Springer, Singapore, 2020: pp. 183–202. 10.1007/978-981-15-3984-8_8. [DOI] [Google Scholar]
- [25].Xia W, Kuniyil Ajith Singh M, Maneas E, Sato N, Shigeta Y, Agano T, Ourselin S, West SJ, Desjardins AE, Handheld Real-Time LED-Based Photoacoustic and Ultrasound Imaging System for Accurate Visualization of Clinical Metal Needles and Superficial Vasculature to Guide Minimally Invasive Procedures, Sensors. 18 (2018) 1394. 10.3390/s18051394. [DOI] [PMC free article] [PubMed] [Google Scholar]
- [26].Kuniyil Ajith Singh M, Sivasubramanian K, Sato N, Ichihashi F, Sankai Y, Xing L, Deep learning-enhanced LED-based photoacoustic imaging, in: Oraevsky AA, Wang LV (Eds.), Photons Plus Ultrasound Imaging Sens. 2020, SPIE, 2020: p. 116. 10.1117/12.2545654. [DOI] [Google Scholar]
- [27].Arabul MU, Heres M, Rutten MCM, van Sambeek MR, van de Vosse FN, Lopata RGP, Toward the detection of intraplaque hemorrhage in carotid artery lesions using photoacoustic imaging, J. Biomed. Opt 22 (2016) 041010. 10.1117/1.jbo.22.4.041010. [DOI] [PubMed] [Google Scholar]
- [28].Kolkman RGM, Steenbergen W, Van Leeuwen TG, In vivo photoacoustic imaging of blood vessels with a pulsed laser diode, Lasers Med. Sci 21 (2006) 134–139. 10.1007/s10103-006-0384-z. [DOI] [PubMed] [Google Scholar]
- [29].Allen TJ, Beard PC, Pulsed near-infrared laser diode excitation system for biomedical photoacoustic imaging, Opt. Lett 31 (2006) 3462. 10.1364/ol.31.003462. [DOI] [PubMed] [Google Scholar]
- [30].Dai X, Yang H, Jiang H, In vivo photoacoustic imaging of vasculature with a low-cost miniature light emitting diode excitation, Opt. Lett 42 (2017) 1456. 10.1364/ol.42.001456. [DOI] [PubMed] [Google Scholar]
- [31].Stylogiannis A, Prade L, Buehler A, Aguirre J, Sergiadis G, Ntziachristos V, Continuous wave laser diodes enable fast optoacoustic imaging, Photoacoustics. 9 (2018) 31–38. 10.1016/j.pacs.2017.12.002. [DOI] [PMC free article] [PubMed] [Google Scholar]
- [32].Zhang HK, Bell MAL, Guo X, Kang HJ, Boctor EM, Synthetic-aperture based photoacoustic re-beamforming (SPARE) approach using beamformed ultrasound data, Biomed. Opt. Express 7 (2016) 3056. 10.1364/boe.7.003056. [DOI] [PMC free article] [PubMed] [Google Scholar]
- [33].Wu Y, Zhang HK, Kang J, Boctor EM, An economic photoacoustic imaging platform using automatic laser synchronization and inverse beamforming, Ultrasonics. 103 (2020) 106098. 10.1016/j.ultras.2020.106098. [DOI] [PMC free article] [PubMed] [Google Scholar]
- [34].Park K, Kim JY, Lee C, Jeon S, Lim G, Kim C, Handheld Photoacoustic Microscopy Probe, Sci. Rep 7 (2017) 1–15. 10.1038/s41598-017-13224-3. [DOI] [PMC free article] [PubMed] [Google Scholar]
- [35].Dangi A, Agrawal S, Datta GR, Srinivasan V, Kothapalli SR, Towards a Low-Cost and Portable Photoacoustic Microscope for Point-of-Care and Wearable Applications, IEEE Sens. J 20 (2020) 6881–6888. 10.1109/JSEN.2019.2935684. [DOI] [PMC free article] [PubMed] [Google Scholar]
- [36].Tsunoi Y, Yoshimi K, Watanabe R, Kumai N, Terakawa M, Sato S, Quality improvement of acoustic-resolution photoacoustic imaging of skin vasculature based on practical synthetic-aperture focusing and bandpass filtering, Jpn. J. Appl. Phys 57 (2018). 10.7567/JJAP.57.127001. [DOI] [Google Scholar]
- [37].Bouri M, Clavel R, The linear delta: Developments and applications, Jt. 41st Int. Symp. Robot. 6th Ger Conf. Robot. 2010, ISR/ROBOTIK 2010. 2 (2010) 1198–1205. [Google Scholar]
- [38].Thurneysen M, Clavel R, Bouri M, Frayssinet H, Giovanola J, Schnyder M, Jeannerat D, Hita-STT, a new parallel five-axis machine tool, Parallel Kinematic Mach. Res. Pract 24 (2004) 529–544. https://infoscience.epfl.ch/record/62722 (accessed June 22, 2020). [Google Scholar]
- [39].Company F FLO Pierrot, C. Fioroni, Modeling and preliminary design issues for 3-Axis parallel machine-tool, in: Proc. Parallel Kinematic Mach. Int. Conf, Ann Arbor, MI, 2000: pp. 14–23. [Google Scholar]
- [40].Vantage Systems – Verasonics, (n.d.). https://verasonics.com/vantage-systems/ (accessed June 22, 2020).
- [41].Monoprice MP Mini Delta 3D Printer - Monoprice.com, (n.d.). https://www.monoprice.com/Product?p_id=21666&seq=1&format=2 (accessed June 22, 2020).
- [42].Xu K, Kim Y, Boctor EM, Zhang HK, Enabling low-cost point-of-care ultrasound imaging system using single element transducer and delta configuration actuator, Proc. SPIE (2019) 31. 10.1117/12.2513169. [DOI] [Google Scholar]
- [43].Li M-L, Zhang HF, Maslov K, Stoica G, Wang LV, Improved in vivo photoacoustic microscopy based on a virtual-detector concept, Opt. Lett 31 (2006) 474. 10.1364/ol.31.000474. [DOI] [PubMed] [Google Scholar]
- [44].Mozaffarzadeh M, Yan Y, Mehrmohammadi M, Makkiabadi B, Enhanced linear-array photoacoustic beamforming using modified coherence factor, J. Biomed. Opt 23 (2018) 1. 10.1117/1.jbo.23.2.026005. [DOI] [PubMed] [Google Scholar]
- [45].Park J, Jeon S, Meng J, Song L, Lee JS, Kim C, Delay-multiply-and-sum-based synthetic aperture focusing in photoacoustic microscopy, J. Biomed. Opt 21 (2016) 036010. 10.1117/1.JBO.21.3.036010. [DOI] [PubMed] [Google Scholar]
- [46].Treeby BE, Cox BT, k-Wave: MATLAB toolbox for the simulation and reconstruction of photoacoustic wave fields, J. Biomed. Opt 15 (2010) 021314. 10.1117/1.3360308. [DOI] [PubMed] [Google Scholar]
- [47].Anas EMA, Zhang HK, Kang J, Boctor E, Enabling fast and high quality LED photoacoustic imaging: a recurrent neural networks based approach, Biomed. Opt. Express 9 (2018) 3852. 10.1364/boe.9.003852. [DOI] [PMC free article] [PubMed] [Google Scholar]
- [48].Flsun Q5: Specs, Price, Release & Reviews | All3DP, (n.d.). https://all3dp.com/1/flsun-q5-review-3d-printer-specs/ (accessed December 27, 2020).
- [49].RostockMAX v4 Fully Assembled RTP – SeeMeCNC, (n.d.). https://www.seemecnc.com/products/rostockmax-v4-fully-assembled-rtp?utm_source=all3dp (accessed December 26, 2020).
- [50].MP10 Mini 200×200mm 3D Printer. Magnetic Heated Build Plate, Resume Printing Function, Assisted Leveling, and Touchscreen - Monoprice.com, (n.d.). https://www.monoprice.com/product?p_id=34438 (accessed November 25, 2020).
- [51].Official Creality3D CR-6 SE 3D Printer in 2020 – Creality3D Store® Official Store for Creality 3D Printers and Accessories, (n.d.). https://www.creality3dofficial.com/products/creality-cr-6-se-3d-printer?sca_ref=10788.CFDqhuwn3C (accessed December 26, 2020).
- [52].Original Prusa i3 MK3S kit, (n.d.). https://shop.prusa3d.com/en/3d-printers/180-original-prusa-i3-mk3s-kit.html?search_query=mk3s&results=75 (accessed December 26, 2020).
- [53].OSMS Series Translation Motorized Stages - 5 Phase Stepping Motor : OSMS20-(X) | SIGMAKOKI, (n.d.). https://www.globaloptosigma.com/en_jp/Catalogs/gno/?from=page&pnoname=OSMS20-%28X%29&ccode=W9063&dcode=&gnoname=OSMS20-35%28X%29 (accessed December 27, 2020).
- [54].Kim J, Kim JY, Jeon S, Baik JW, Hee Cho S, Kime C, Agent-Free Super-Resolution High-Speed Photoacoustic Microscopy, in: Int IEEE. Ultrason. Symp. IUS, IEEE, 2019: pp. 1054–1056. 10.1109/ULTSYM.2019.8925572. [DOI] [Google Scholar]
- [55].L-406 Compact Linear Stage, (n.d.). https://www.pi-usa.us/en/products/positioning-stages-linear-rotary-motorized-precision/precision-motorized-linear-stages/l-406-compact-linear-stage-1201904/#description (accessed December 27, 2020).
- [56].M-403 Linear Stage, (n.d.). https://www.pi-usa.us/en/products/positioning-stages-linear-rotary-motorized-precision/precision-motorized-linear-stages/m-403-precision-translation-stage-701750/#specification (accessed December 27, 2020).
- [57].Yao J, Wang L, Yang J-M, Gao LS, Maslov KI, Wang LV, Huang C-H, Zou J, Wide-field fast-scanning photoacoustic microscopy based on a water-immersible MEMS scanning mirror, J. Biomed. Opt 17 (2012) 1. 10.1117/1.jbo.17.8.080505. [DOI] [PMC free article] [PubMed] [Google Scholar]
- [58].Hai P, Yao J, Maslov KI, Zhou Y, Wang LV, Near-infrared optical-resolution photoacoustic microscopy, Opt. Lett 39 (2014) 5192. 10.1364/ol.39.005192. [DOI] [PMC free article] [PubMed] [Google Scholar]


