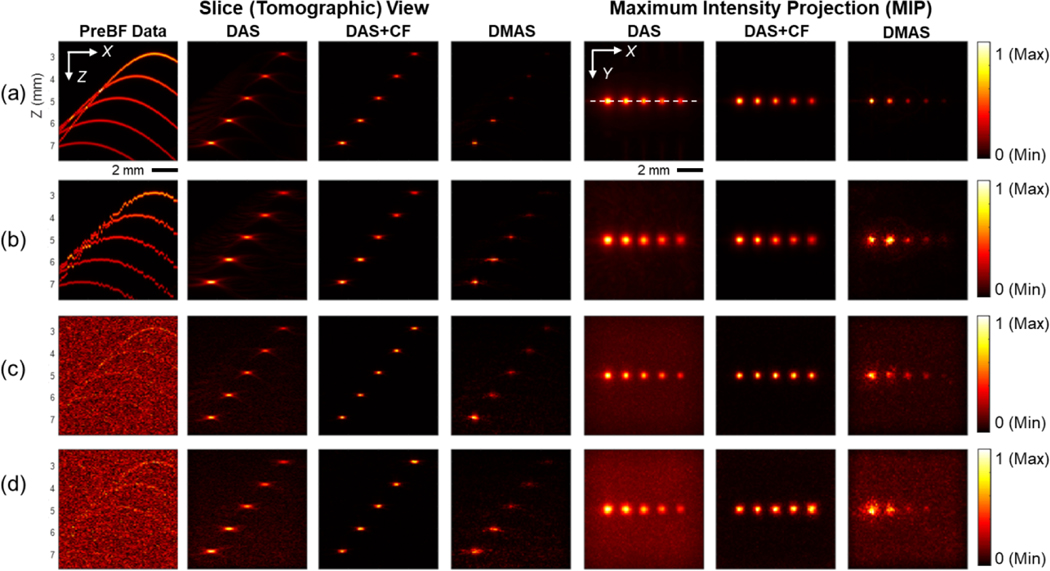
Fig. 3.
The PA imaging results of the 3D simulation through the slice (tomographic) plane view in the X-Z plane and MIP. The color bar represents the normalized PA intensity. (a) The condition with no sensor position error and no background noise, b) The condition with the sensor placing error of 200 μm in standard deviation, c) The condition with a 40dB SNR white noise included and with no sensor placing error, d) The condition with the sensor placing error of 200 μm in standard deviation and with a 40dB SNR white noise included.

