

Abstract
Flow-based cytometry methods are widely used to analyze heterogeneous cell populations. However, their use for small molecule studies remains limited due to bulky fluorescent labels that often interfere with biochemical activity in cells. In contrast, radiotracers require minimal modification of their target molecules and can track biochemical processes with negligible interference and high specificity. Here, we introduce flow radiocytometry (FRCM) that broadens the scope of current cytometry methods to include beta-emitting radiotracers as probes for single cell studies. FRCM uses droplet microfluidics and radiofluorogenesis to translate the radioactivity of single cells into a fluorescent signal that is then read out using a high-throughput optofluidic device. As a proof of concept, we quantitated [18F]fluorodeoxyglucose radiotracer uptake in single human breast cancer cells and successfully assessed the metabolic flux of glucose and its heterogeneity at the cellular level. We believe FRCM has potential applications ranging from analytical assays for cancer and other diseases to development of small-molecule drugs.
Keywords: radiochemistry, droplet microfluidics, radiofluorogenesis, fluorodeoxyglucose, single-cell analysis, optofluidics
1. INTRODUCTION
Methods that can analyze the heterogeneous states and phenotypes of single cells have been garnering increased attention in recent years (Cai et al. 2006; Cornell University 2019; Fritzsch et al. 2012; Zenobi 2013). Fluorescence methods such as flow cytometry and microscopy have been widely used for this purpose, but they require the use of fluorophore labels prone to interfering with biological processes (Liu and Lan 2019). In addition to photobleaching and blinking issues, most common fluorophores are sensitive to its immediate environment (Chattopadhyay et al. 2016) and have been observed to bind nonspecifically to cell culture substrates (Zanetti-Domingues et al. 2012) and lipid bilayers (Hughes et al. 2014), alter protein diffusion (Zanetti-Domingues et al. 2013), destabilize DNA hairpins (Hartmann et al. 2014) and DNA nanostructures (Lacroix et al. 2019), and reduce solubility of labeled molecules (Hu et al. 2015). In one recent example, Tao et al. observed that a widely used fluorescent glucose analog, 2-[N-(7-nitrobenz-2-oxa-1,3-diazol-4-yl) amino]-2-deoxy-D-glucose (2-NBDG), is not an accurate substitute for glucose. In particular, they found that 2-NBDG is efficiently transported by only a small subset of glucose transporters in rumen bacteria and concluded the tracer is not adequate for quantitative measurements (Tao et al. 2016). The other studies raised similar concerns about the non-specific uptake of NBDG by certain types of immune cells and mammalian cells and argued that 2-NBDG and 6-NBDG may not be reliable tools for the assessment of cellular glucose transport (Hamilton et al. 2021; Sinclair et al. 2020). Finally, 2-NBDG has also been observed to lose its fluorescence after cellular uptake, which can further confound quantitation of glucose transport (Yoshioka et al. 1996).
In contrast, radiotracers are highly specific thanks to their superior mimicry to the target molecule. For instance, radiolabeled glucose analogs such as [14C]glucose or [18F]fluorodeoxyglucose (FDG) involve minimal modification of the original molecule (Fig. 1a). However, despite their unmatched strength, the use of radiotracers has remained limited for single-cell studies (Tao et al. 2016). It is partly because radiotracers are expensive and require specific equipment, training, and safety precautions, and more importantly conventional radiometric assays can only be performed on bulk cell populations and are not capable of resolving changes happening in subpopulations or single cells present in a complex mixture of cells (Sinclair et al. 2020). Recently, researchers have developed radiometric imaging platforms with single-cell resolution (Liu and Lan 2019). A notable work in the field is radioluminescence microscopy (RLM) developed in 2012 at Stanford (Kim et al. 2017; Kiru et al. 2018; Pratx et al. 2012; Sengupta and Pratx 2016; Türkcan et al. 2019). RLM offers the best resolution (i.e., tens of microns) for radionuclide imaging to date (Liu and Lan 2019), but it can analyze only 40–200 cells a time, and each acquisition requires at least 5 minutes often as long as an hour (Gallina et al. 2017). In addition, its design does not easily allow the imaged cells to be sorted based on the measured radioactive signal for post analysis.
Figure 1.

(a) Molecular structures of D-glucose, fluorine-18-radiolabeled glucose analog (2-deoxy-2-[18F]-fluoro-D-glucose or [18F]FDG), and fluorescent glucose analog (2-NBDG). [14C]glucose is made by replacing one of the carbon atom of a D-glucose molecule with its radioisotope 14C. (b) Illustration showing production of ROS from radioactive beta decay. Proton (P) decays into neutron (N), emitting positron (e+) and neutrino (v). The emitted positron travels a finite distance, interacting with water molecules along its path and creating ROS, until it annihilates with an electron (e−), resulting in two antiparallel 511 keV photons. (c) Illustration showing principle of radiofluorogenic conversion. A single radioactive cell is encapsulated into a water-in-oil drop. As the radiotracer decays, the emitted beta radiation creates ROS such as hydroxyl radicals, which in turn mediate the radiofluorogenic conversion. (d) Nonfluorescent dichlorodihydrofluorescein (DCFH) is converted into fluorescent dichlorofluorescein (DCF) after losing two protons from interacting with radiation-induced ROS.
Here, we report the development of flow radiocytometry (FRCM), a new method enabling high-throughput radiometry of single cells and future integration with downstream cell sorting. The method is similar to flow cytometry but relies on radiofluorogenesis to convert dim and discontinuous radioactive signals from single cells into integrated bright and continuous fluorescence. This radiofluorogenic translation is realized using molecular probes which irreversibly convert to fluorophores in response to ionizing radiation. Using a microfluidic platform, we encapsulated radiolabeled single cells together with radiofluorogenic probes in water-in-oil drops (Fig. 1b). Within these drops, ionizing particles (positrons, electrons, or alpha particles) emitted from an encapsulated single cell produce reactive oxygen species (ROS) via water radiolysis (Fig. 1c). These ROS instantaneously react with radiofluorogenic probes, generating a fluorescent signal proportional to the level of radioactivity (Fig. 1d).
The strategy of co-encapsulating single cells and ROS probes in micro-drops was first proposed and attempted by Gallina et al. in our group (Gallina et al. 2017). Although Gallina et al. demonstrated the potential feasibility of the approach, their assay suffered from low signal-to-background ratio (SBR), significant cross-contamination between drops, polydispersity in drop size, and low readout throughput. To address these issues, we investigated the use of a different radiofluorogenic probe better suited for emulsions and developed a continuous-flow optofluidic platform to achieve a 2-order-of-magnitude reduction in acquisition time per cell compared to microscopy-based approaches. As a proof of concept, FRCM was demonstrated by quantifying the metabolic flux of glucose, via its radiolabeled analog FDG, in various populations of human breast cancer cells. We anticipate that, with further integration with downstream cell sorting, this platform will constitute a high-throughput method for studying the distribution of a wide range of radiolabeled molecules in single cells using fluorescence detection.
2. METHODS AND MATERIALS
2.1. Microchip fabrication
Microfluidic platforms capable of generating and reading droplets were designed and built. Polydimethylsiloxane (PDMS) microfluidic chips with channel depth modulations were fabricated using replica molding protocols. The reusable molds were fabricated using Nanoscribe (Nanoscribe Photonics Professional GT, Nanoscribe GmbH, Germany), a submicron resolution 3D printer based on two-photon polymerization of negative photoresist. The channel mold designs for drop generation and drop read microchips are shown in Fig. S1. We find a number of advantages in using Nanoscribe for microchannel mold fabrication over conventional photolithography methods. First, accurate channel depth modulation was easily achieved whereas the conventional way of spin-coating liquid-type negative photoresist is influenced by slight differences in temperature, humidity, and device control and thus prone to inaccurate and non-uniform depth modulation. Second, sharp rectangle cross-sectional shape of channels was easily achieved whereas a mask-based photolithography is prone to creating undesirable trapezoidal shapes.
We note that cleaning of silicon wafer substrate with 500W oxygen plasma treatment for 10 minutes (Drytek2 DRIE100 plasma etcher) prior to Nanoscribe fabrication significantly enhanced adhesion of photoresist onto the substrate surface and thus durability of the mold.
The mold surface was rendered hydrophobic with trichloro(1H, 1H, 2H, 2H-perfluorooctyl)silane (Sigma Aldrich, MO, USA). Then, the PDMS base (Sylgard 184, Dow corning) and curing agent were mixed in a 10:1 ratio, poured over the mold, degassed in vacuum chamber, and cured at ~ 60°C for over 4 hr. We peeled off the cured PDMS from the mold and punctured holes for inlet and outlet ports using a 1 mm diameter disposable biopsy punch (Integra Miltex, Integra York PA, Inc., PA, USA). The PDMS chips were then bonded to a 25 mm × 75 mm × 1.0 mm precleaned glass microscope slides (Corning® 2947–3×1, Corning Inc., NY, USA) with oxygen plasma treatment (Plasma cleaner PDC-32G, Harrick Plasma, NY, USA). Immediately after, microchips were placed on a 95°C hot plate for over 10 min to reinforce the bonding. The microchannel wall surfaces were rendered hydrophobic by flowing in Novec™ 1720 Electronic grade Coating (3M, MN, USA) through the channel and blow-drying with air.
2.2. Droplet generation and fluid flow operation
We generated 800 pL monodisperse droplets using the flow-focusing nozzle on our drop generation microchip. The cross-section of the flow-focusing nozzle for all four channels was square with side length of 90 μm. The continuous phase was HFE 7500 perfluorinated oil containing 2% w/w of 008-fluorosurfactant (RAN Biotechnologies, MA, USA) as a surfactant to stabilize the droplets against coalescence. The disperse phase was a mixture of DCFH dissolved in phosphate buffered solution and Cell Dissociation Buffer Type II. Fluids were injected through the inlet ports and driven at flow rates of 36 and 4.5 μL/min using a syringe pump (neMESYS, Cetoni GmbH, Korbussen, Germany) for the continuous phase and the two dispersed phases, respectively. Drop diameters were measured using Leica microscope. The monodispersity of drop size was observed from the micrograph-based measurement and PMT-based fluorescence peak-width measurement.
2.3. Droplet incubation and incubator fabrication
The droplets were collected into a 2.8-meter long polytetrafluoroethylene (PTFE) tubing and incubated in the dark at 4°C for 4 hours. The inside of the tubing was rendered hydrophobic with Novec™ 1720 Electronic grade Coating prior to use. The tubing holder and the box (Fig. S2) were 3D printed using Ultimaker S5 (Ultimaker B.V., Utrecht, Netherlands).
2.4. Droplet read and image acquisition
After incubation, we injected the droplets into another optofluidic microchip to read their fluorescence. The drops were arranged and spaced in a single file to be investigated one by one with no crosstalk. Red and green fluorescence emission from each droplet was collected through two optical fibers and measured using two photomultiplier tubes (PMTs). The red fluorescence emitted from quantum dots was measured through the 1st fiber, which was used to confirm single cell encapsulation. Within 15 ms, the green fluorescence emitted from radiofluorogenic probe was measured through the 2nd fiber, which informed on the amount of FDG uptake of the corresponding single cell. Immersion oil was placed in between the fiber end and PDMS wall to achieve a good optical coupling. The microscope light was used as a fluorescence excitation source and focused on a droplet investigation area by a 40x objective lens (as shown in Fig. 2f). The red emission was detected using a Hamamatsu PMT (H7422P-50, Hamamatsu Corp., NJ, USA), a photon counting setup (C9744/C8855–01) and a gate time of 200 μs. The green emission was detected using a Thorlabs PMT (PMM02, Thorlabs Inc., NJ, USA) and data acquisition board (USB-6002, National Instruments, TX, USA) with 5,000 Hz measurement frequency. The two PMTs were synchronized using a hardware-trigger given by a function waveform generator (SDG1025, Siglent Technologies, OH, USA). Both PMT signals were read by a PC and recorded using Labview custom-purpose scripts. Peaks and valleys were identified from the PMT measurement data using an open-source MATLAB code. Erroneous peak measurements were found based on peak shape and width and were excluded from data. The valleys were used to measure noise and background, which we defined respectively as standard deviation and average calculated from outliers-excluded valley height measurements. In addition, we developed a MATLAB code to count the number of cell encapsulation from the peaks of red and green fluorescence signals.
Figure 2.
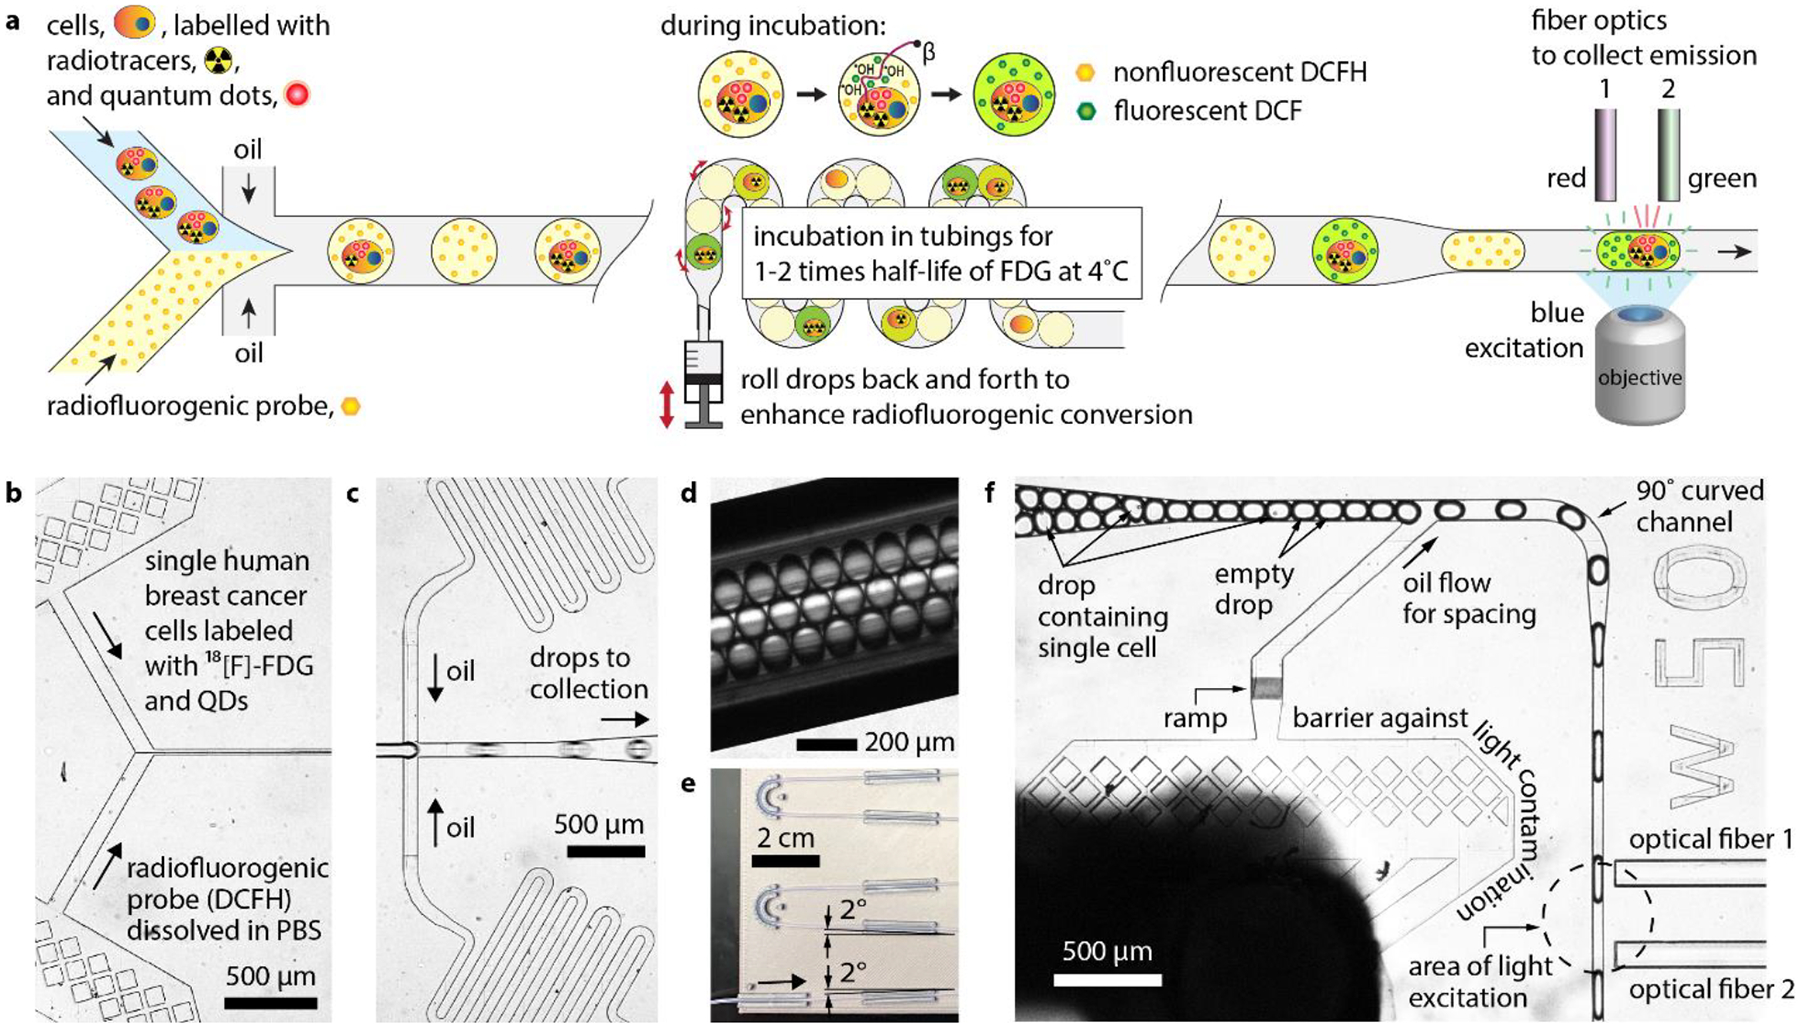
Device overview and design. (a) Schematics showing drop generation, incubation, and read. (b) Optical micrograph (top view) showing cell samples and radiofluorogenic probe solution being introduced and mixed in DropGen microchip (c) Optical micrograph showing the cross-junction microfluidic channels where the mixture (i.e., dispersed phase) including the cells was encapsulated in water-in-oil drops. (d) Optical micrograph of polytetrafluoroethylene tubing where drops were incubated. (e) Picture of the tubing and holder. (f) Optical micrograph of DropRead microchip in which drops were introduced to have their fluorescence measured after incubation.
2.5. Radiofluorogenic probe preparation
2’,7’-dichlorodihidrofluorescein (DCFH) was prepared via chemical de-esterification of commercially available 2’,7’-dichlorodihydrofluorescein diacetate (DCFH-DA; D6883–250mg, Sigma-Aldrich, MO, USA). To achieve the conversion of DCFH-DA to DCFH, we employed an alkaline hydrolysis protocol which we slightly modified from what was described by Sleiman et al. (Sleiman et al. 2013). That is, instead of 25 mM phosphate buffer, we used a mixture of commercially available phosphate buffered saline (PBS) to match the proposed buffer capacity: (a) 0.025 g of DCFH-DA was dissolved in 5 mL methanol. (b) By mixing 15 μL of this 10 mM DCFH-DA stock solution and 60 μL of 0.01 N NaOH, the de-esterification of DCFH-DA proceeded in the dark at room temperature for 30 min. (c) The mixture was then neutralized with 1 mL of 10x PBS at pH 7.4 and 13.25 mL of 1x PBS at pH 7.4. This solution was kept on ice in the dark until used. The solution was prepared fresh and used immediately within one hour for all assays. The final concentration of DCFH-DA was 10 μM. We caution that, as opposed to the protocol described by Sleiman et al. (Sleiman et al. 2013) and employed by us, the majority of literature describes preparation of 1 mM DCFH-DA stock solution and use of stronger base relative to the molar amount of DCFH-DA for de-esterification (LeBel et al. 1992).
2.6. FDG preparation
FDG was prepared through nucleophilic 18F-fluorination and hydrolysis of mannose triflate by the Stanford Cyclotron Radiochemistry Facility. 18F was made in a GE PETtrace cyclotron and the production was performed via cassette-based automated synthetic module (FASTlab, GE Healthcare). Quality control tests were performed according to USP823. The radiotracer was used within 8 h after production due to its short halftime (τ1/2 = 1.8 h). Radioactivity was measured using a dose calibrator (Atomlab 400, Biodex) prior to each experiment.
2.7. Media preparation
Cell culture medium was Dulbecco’s Modified Eagle Medium (DMEM) containing high glucose (4.5 g/L), sodium pyruvate (110 mg/L), and GlutaMAX™ (Cat. No. 10569077, Gibco®, Grand Island, NY, USA) supplemented with 10% (v/v) fetal bovine serum (FBS; Cat. No. 15140122, Gibco®, Grand Island, NY, USA) and 1% (v/v) penicillin-streptomycin (PS; Cat. No. 15140122, Gibco®, Grand Island, NY, USA), called hereafter Complete Growth Medium. The cell culture medium used for radiolabeling was glucose-free DMEM (Cat. No. 11966025, Gibco®, Grand Island, NY, USA) supplemented with 10% (v/v) FBS and 1% (v/v) PS, called hereafter Glucose-free Medium. For single cell preparation, two types of media were prepared. The first type was Mg2+ Ca2+ free 1x PBS with 2 mM EDTA, 75 μM bovine serum albumin (BSA) and 5 mM MgCl2·6H2O, called hereafter Cell Dissociation Medium Type I. The second was Mg2+ Ca2+ free 1x PBS with 3 μM BSA and 2.5 mM MgCl2·6H2O, called hereafter Cell Dissociation Medium Type II. All the DMEM, FBS, and PS were purchased from Thermo Fisher Scientific, Inc. and manufactured at Gibco®, Grand Island, NY, USA.
2.8. Cell culture
Human breast adenocarcinoma cells (MDA-MB-231) were cultured at 37 °C and 5% CO2 in Complete Growth Medium. Dr. Amato Giaccia at Stanford University kindly offered the cells of passage number 7. The passage number of the cell samples used for FRCM was in a range of 7–9.
2.9. Cell labeling with fluorescent quantum dots
Cells were labeled using fluorescent quantum dots (ex/em 405–760/800 nm; Qtracker® 800 Cell Labeling Kit, Q25079, Thermo Fisher Scientific, Inc.) to confirm single cell encapsulation during FRCM assay: (a) To prepare 15 nM labeling solution, we mixed 1.5 μL each of Qtracker® Component A and Component B in a 1.5 mL microcentrifuge tube. (b) We incubated the mixture for 5 minutes at room temperature and proceeded immediately to the next step. (c) We added 0.2 mL of fresh complete growth medium to the tube and vortexed for 30 seconds. (d) We added ~2 × 10⁶ cells (from a cell suspension at ~1 × 10⁷ cells/mL in growth medium) to the tube containing the labeling solution. (e) We incubated the sample at 37 °C for 45–60 minutes. (f) We washed the cells twice with complete growth medium and seeded them in a T25 flask.
2.10. Cell radiolabeling
In addition to labeling with fluorescent quantum dots, we labeled the cells with FDG radiotracer to assess heterogeneity of cellular metabolism using the proposed flow radiocytometry: (a) We washed the quantum dot-labeled cells in T25 flask twice with 1x PBS. (b) We added 2 mL of FDG dissolved in glucose-free complete growth medium to the flask and incubated the sample at 37 °C and 5% CO2 for 45 min (Midi 40, Thermo Scientific, Inc.). The radioactivity of 2 mL FDG-dissolved medium was measured to be about 800 MBq. (c) We washed the cells twice with ice-cold 1x PBS. We assume the use of cold PBS reduces leakage of unphosphorylated FDG out of the radiolabeled cells.
2.11. Single cell preparation
To encapsulate single cells in droplets with high efficiency, we needed to dissociate clumped cells into single cells prior to introducing them to DropGen microchip. Here, we describe detailed protocols for single cell preparation: (a) Immediately after radiolabeling, cells were treated with 1.5 mL Trypsin-EDTA 0.05% (Gibco, Thermo Fisher Scientific, Inc.) and incubated for 2 min at 37 °C. (b) After quenching trypsin digestion by adding 1.5 mL of cold complete growth medium, we centrifuged, washed with 1x PBS, and resuspended the cells in 3 mL of Cell Dissociation Medium Type I. (c) We added 30 units of DNase I to the sample and incubated at 37 °C for 10 min. (d) We exchanged the medium with 2 mL of Cell Dissociation Medium Type II via centrifugation for 5 min and added 20 units of DNase I. (e) We pipetted at least 20 times to help dissociate cell clusters into single cells and filtered out remaining cell clusters using a 40 μm-pored nylon mesh strainer (Fisher Scientific). (f) We measured cell density using hemocytometer and total radioactivity of the cell sample using a dose calibrator (Atomlab 400, Biodex) to estimate average radioactivity of radiolabeled single cell. (g) We added 1x PBS to achieve a cell number density of ~1 × 10⁶ cells/mL and 16% v/v OptiPrep density gradient medium (Sigma-Aldrich) to match the density of the final medium to 1.06 kg/m3 reported as the density of mammalian epithelial cells (Ford et al. 1994; Mazutis et al. 2013).
2.12. X-ray irradiation and fluorescence spectrometry
Stability and sensitivity of DCFH were assessed using kinetic fluorescence spectrometry. DCFH samples prepared in 5x PBS with concentration range of 50 nM – 500 μM were dispensed in 96-well plates in four aliquots, each with a volume of 100 μL. Paraffin oil with a volume of 100 μL was dispensed on top of DCFH to prevent DCFH in direct contact with air and minimize undesirable oxidation of DCFH. Samples were irradiated with an X-RAD 320 X-ray irradiator (Precision X-ray) with a source-surface distance of 45 cm and a dose output set to 504 cGy/min (320 kVp, 12.5 mA and 2 mm thick aluminum filter).
2.13. GLUT1 knock down cell preparation
To establish GLUT1 knockdown cells, we procured shRNAs targeting the encoding gene SLC2A1 (Target sequence: CCAAAGTGATAAGACACCCGA) as well as a nontargeting random control sequence (Millipore Sigma). For transfection, 1×10⁶ HEK293T cells were seeded in 10 cm dish with DMEM supplemented with 10% FBS and 1% antibiotic-antimycotic. After 24-hour incubation, cells were washed twice with DMEM only and 5 ml of DMEM with 10% FBS were added. 5 μg of shRNAs were mixed with 2.5 μg of packaging plasmids, Δ8.7 and VSV.G and transfected into cells using 15 μL of X-tremeGENE™ 9 transfection reagent (Sigma-Aldrich). Cell media containing virus particles were collected 48 hours after and filtered through 0.45 μm syringe filters. As a recipient cell line, 1.5 × 10⁵ MDA-MB-231 cells were seeded into 6-well plate and incubated for 24 hours. Then cell media were removed, and 1 mL of virus particles were added with 1 μg/mL of polybrene and 1 mL of regular DMEM with 10% FBS and 1% antibiotic-antimycotic. After incubating for 48 hours, knockdown cells were selected by treatment with 2 μg/mL puromycin for 2 weeks. GLUT1 knockdown was confirmed by Western blot after removing N-glycans using PNGase F.
2.14. Western blot of shGLUT1 and shSCR
To confirm SLC2A1 gene knockdown in MDA-MB-231 cells, GLUT1 protein expression was evaluated using Western blot. Since GLUT1 is highly glycosylated, N-glycans were removed using PNGase F. As the first procedure, whole cell protein was extracted with RIPA buffer supplemented with protease inhibitor cocktail. Then, 10 μg of protein was mixed with 2 μL of PNGase F (NEB #P0707S) and incubated at 37°C overnight. After incubation, we added sample buffer and ran BOLT 4–12% Bis-Tris gel for western blot (Thermo Fisher Scientific #NW04120). After a transfer to nitrocellulose membrane using Trans-Blot Turbo transfer system (BioRad), the membrane was probed with anti-GLUT1 antibody (Abcam #ab115730).
3. RESULTS AND DISCUSSION
3.1. Experimental overview and design
The goal of FRCM is to measure the heterogeneous behavior of single cells on the basis of their transport and incorporation of radiolabeled substrates. For instance, the metabolic flux of glucose into single cells can be assessed by measuring their radioactivity after incubation with a radiolabeled glucose analog. In this work, we quantitated FDG radiotracer uptake in thousands of single human breast cancer cells (MDA-MB-231). It is important to assess cellular heterogeneity of cancer considering that higher uptake of FDG is interpreted as a distinctive property of cancer tissues. Reports have shown that increased glycolysis in cancer is associated with higher cell proliferation, metastatic potential, and therapeutic resistance (Cantelmo et al. 2016; Li et al. 2018; Zhao et al. 2017). This implies that FRCM may provide crucial information for cancer therapeutics and identification of rare cell subclones. The assessment of heterogeneity in FDG uptake from ~100 cancer cells has been done via RLM, but we here present statistically robust high-throughput data for thousands of cells.
3.1.1. Drop design and generation
In the FRCM assay, cells are incubated with a radiolabeled substrate of interest, then washed and analyzed following a three-stage process comprised of drop encapsulation, incubation, and read (Fig. 2a). Using a flow focusing microfluidic chip, called hereafter DropGen microchip, single radioactive cells were mixed with a radiofluorogenic probe (Fig. 2b) and encapsulated in water-in-oil drops (Fig. 2c). The device generated 800 pL monodisperse drops at a throughput of 200 per second. In addition, since drops may be empty or contain multiple cells, we used fluorescent quantum dots (QDs) to label cells and allow them to be counted in each drop.
The assay is designed such that the fluorescence of a radiofluorogenic drop accurately represent the amount of radiotracer in the encapsulated cell. To achieve this goal, unwanted cross-contamination and nonspecific fluorescence activation of probe should be minimized. Specifically, radiofluorogenic probe, radiotracers, and ROS should all be hermetically encapsulated to avoid cross-contamination between drops. In addition, the radiofluorogenic fluorescence activation should be driven predominantly by extracellular radiation-induced ROS, not by intracellular ROS either inherently present or generated from oxidative stress. To address these requirements, we selected a hydrophilic radiofluorogenic probe, dichlorodihydrofluorescein (DCFH), as the ROS sensor. This helped create a strict compartmentalization of the three reactants (i.e., DCFH, FDG, and ROS) in the water drop and cell (Fig. 1b). The hydrophilic probe DCFH was observed to be strictly confined within the water phase, preventing cross-contamination between adjacent drops. In addition, the hydrophilicity of DCFH limited its transport into cells, thus mitigating the nonspecific fluorescence activation by cell-intrinsic ROS. As for ROS, the major radical produced during the radiolysis of water, •OH, is short-lived (c.f., nanoseconds order of lifetime) and remains confined to the drops in which it is created. In contrast metabolism-driven intracellular ROS such as •O2− and H2O2 are long lived, and therefore cell-containing drops were kept ice-cold to suppress mitochondrial ROS production and diffusion. Additionally, we thoroughly optimized drop size and chemical composition of the water phase to achieve high signal-to-background ratio (SBR). These considerations are discussed in detail in Supplementary Information.
3.1.2. Drop incubation
In the second stage, the generated drops were collected into a 1.8 m length of tubing for incubation. During incubation, positrons emitted from the radioactive cells ionized surrounding water molecules and produced ROS within the drop. The ROS readily attacks nonfluorescent DCFH, abstracting two protons from it and turning the molecule into fluorescent dichlorofluorescein (DCF) as illustrated in Fig. 1d (Chen et al. 2010).
We designed the incubation system such that radiofluorogenic conversion of a drop is proportional to the amount of radiotracer taken up by the encapsulated cell, with no unwanted cross-contamination between adjacent drops. Considering that 18F has a mean positron range of 0.6 mm in water (Conti and Eriksson 2016), it was important to separate the drops to avoid physical crosstalk. First, we kept the cell concentration in the sample as low as 13,000 – 25,000 cells per mL, such that only 5–9% of drops contained a cell. Second, we collected the drops into a 2.8 m-long microbore tubing for incubation. The narrow lumen (inner diameter of 500 μm) forced the drops to line up along a few rows (Fig. 2d). Third, the flow rate ratio of the continuous phase to the dispersed phase in drop generation was 3 to 1, and the larger volume of the continuous phase further spread out the drops in the incubation tubing. Together, these features of the assay provided significant spatial distancing between cell-containing drops, minimizing physical crosstalk. Other approaches were implemented for optimal incubation of radioactive cells within droplets, which are detailed as Supplementary Information including Fig. S2. After incubation, the box was placed upright to concentrate the drops by driving them upward through buoyancy along the inclining serpentine path (Fig. 2e). This drop packing procedure was crucial to achieve high throughput in drop reading by removing undesirable extra spacing between the drops.
3.1.3. Drop read
After incubation, we injected the drops into the second optofluidic microchip, called hereafter DropRead microchip, to measure the DCF fluorescence (Fig. 2f). The DropRead microchip was mounted on a microscope stage to monitor microfluidic operation and obtain brightfield and fluorescence images. We also used the microscope illumination for fluorescence excitation. A single excitation light source (480 nm wavelength) was sufficient to excite both DCF and QD at the same time. The emission peaks of DCF and QD were respectively 525 nm and 800 nm, and we did not observe any overlap between the two emission measurements.
The drops were arranged in a single file and spaced to be investigated one by one with no overlap. This spacing was achieved by adding a flow of continuous oil phase. The drops passed in front of two optical fibers, which were inserted into the DropRead microchip to collect fluorescence from QD and DCF, respectively. The blue excitation light was focused by a 40x objective lens onto the location shown in Fig. 2f, covering the two fiber ends. As the drops flowed in front of the optical fibers, QD fluorescence was collected via optical fiber 1 and measured by photomultiplier tube (PMT) 1, then, shortly afterwards, DCF fluorescence was collected via optical fiber 2 and measured by PMT 2 (Fig. 3a). We synchronized the two PMT measurements in time using a common trigger signal. The plots in Fig. 3b show raw PMT signals as a function of elapsed time. Peaks and valleys were identified, and their heights were measured using custom MATLAB scripts (See Supplementary Information including Fig. S3 for more details). Peak height was used as the signal (S) representing the fluorescence intensity of individual drops. Excluding outliers, valley heights were averaged to estimate background (B; i.e., intrinsic fluorescence of the continuous oil phase) and the normalized drop fluorescence was computed as (S-B)/B.
Figure 3.

Optofluidic configuration and measurement. (a) Schematic showing the optofluidic configuration. (b) The two PMT signals as a function of elapsed time.
The fluorescence peaks from both PMTs were analyzed. Typically, the DCF fluorescence peak (PMT 2) had a width of 12 ms and appeared 4 ms after the corresponding QD peak (PMT 1). The combination of the two PMT signals enabled us to differentiate cell-containing drops from empty ones. Additionally, if two or more peaks were detected within 6 ms in the PMT 1 signal, we assumed the drop contained multiple cells and excluded the measurement from the dataset. The measured cell encapsulation probability in these experiments followed Poisson statistics, as expected for random encapsulation (see Supplementary Information including Tables S1 and S2 for more details).
The proposed optofluidic configuration offers crucial advantages in radiofluorogenic drop read over conventional epifluorescence microscopy. First, the proposed system can detect the dim fluorescence of empty drops and drops containing non-radioactive cells with high sensitivity. The measurement of these drops is necessary to accurately capture the full range of cellular heterogeneity, including cells taking up minimal amount of radiotracer. Minimal exposure of drop to excitation light is also important to minimize unwanted photo-activation of DCFH, which contributes to higher background. The resident time of each drop under the excitation window was approximately 12 ms, which is much shorter than the time required to image a field of view using fluorescence microscopy. In addition, high sensitivity was achieved in our design by employing sensitive PMT photodetectors, which not only detected weakly radioactive single cells but also captured single cells labeled with minimal amount of QDs. Finally, thanks to precise microfabrication techniques, our system measures each drop at the same location, thus improving reproducibility compared to microscope set-up that are subject to variations in excitation and light collection efficiency over the field of view.
3.2. Radiofluorogenic probe selection and optimization
3.2.1. Revisiting DCFH and its instability
We here describe why we chose DCFH for FRCM among many ROS probes available. Our foremost consideration was that DCFH is hydrophilic and, therefore, remained confined to the water drops and did not leak out to continuous phase, at least over 12 hours. In contrast, many other ROS probes (e.g., Amplex Red) are amphiphilic and thus prone to leaking out of aqueous drops. For example, Gallina et al. observed that DHRh123 partitioned to the oil phase and adsorbed onto the PDMS microchannel wall, reducing sensor concentration within the drop while increasing background fluorescence. Despite the notable advantage of using DCFH for a droplet assay, Gallina et al. ruled it out for use in their radiofluorogenic assay because the authors believed the sensitivity of DCFH to ionizing radiation drastically deteriorated over time (Gallina et al. 2017). However, repeating the same assay we achieved far more stable reagent than reported by Gallina et al. The data plots and linear regression analysis for the measured sensitivity and stability are respectively shown in Fig. S4 and Table S3. Detailed protocol is also discussed in Supplementary Information.
3.2.2. DCFH sensitivity
We assumed that there would exist an optimal DCFH concentration relative to the sample radioactivity for achieving maximum sensitivity. This is because, if the sample had an excessive molar amount of DCFH relative to the molar amount of ROS produced by the radioactivity, then background fluorescence would be greater than desired due to nonspecific activation. On the other hand, if there were not enough moles of DCFH to measure all the ROS produced in sample, then the fluorescence signal would be saturated and fail to reach the desired value. To evaluate this effect, we dispensed 100 μL of mixture of FDG and DCFH (1:1 v/v) on a 96-well plate array with varying concentration of DCFH from 50 nM to 500 μM and a fixed radioactivity concentration of 160 MBq/mL. This radioactivity concentration corresponds to 12 Bq/cell contained within a drop of 113 μm diameter, and we thus believe the following spectroscopy results and analyses are suitable to understand to the drop-based FRCM experiments. We covered the wells with 100 μL paraffin oil on top to minimize nonspecific activation of DCFH by oxygen. The green fluorescence of DCFH, with and without FDG, was measured every 15 minutes using spectrometry. The measured background (I0) and signal (I) fluorescence intensities are respectively plotted in Figs. 5a and 5b.
In Fig. 4a, the background increases over time despite the absence of ionizing radiation, which we ascribe to nonspecific activation induced by excitation light and oxygen. In order to assess the photo-activation of DCFH induced by the excitation light, we performed the same kinetic spectroscopy and compared fluorescence increment rate for varying the time intervals between measurements and found that DCFH fluorescence increased 2.4 times faster when excitation light was given every 1 hour versus 20 hours (Fig. S5a). In addition, to assess the influence of oxygen on the nonspecific activation of DCFH, we compared two DCFH samples, one covered with paraffin oil on top, and one with no oil cap so that oxygen could freely diffuse into the test solution. DCFH fluorescence intensities increased faster and reached larger values when the samples were not capped with oil (Fig. S5b). These two experimental results confirm that both light and oxygen contribute to the nonspecific fluorescence activation of DCFH, as also observed previously by others (Chen et al. 2010; Kalyanaraman et al. 2012). We also note that the higher the DCFH concentrations, the larger the slopes (Fig. 4a). Linear regression shows that the slope is linearly proportional to the DCFH concentration (Fig. S5c).
Figure 4.

Kinetic fluorescence spectroscopy measurements of (a) DCFH solutions and (b) mixture of DCFH and FDG. (c) Signal to background ratio (SBR) as a function of elapsed time. (d) SBR measured at increasing elapsed times as a function of the ratio of radioactivity to DCFH concentration.
When FDG is added to the solution, the fluorescence of the mixture increases more quickly than that of the control DCFH samples (Fig. 4b). This is because radioactive decay of 18F produced ROS, which oxidized nonfluorescent DCFH and converted it to fluorescent DCF. The fluorescence slopes gradually decreased over time because the rate of ROS production was reduced as a result of exponential decay of the 18F radioactivity. We note that, for the low DCFH concentrations (e.g., 50 and 250 nM), the fluorescence of the samples reached a plateau, indicating that DCFH molecules in the samples were entirely converted to DCF. In contrast, the fluorescence of the relatively higher DCFH concentration samples continuously increased over 12 hours. This indicates that these samples had more DCFH molecules than could be converted within the time frame. The SBRs, (I − I0)⁄I0, of samples with varying DCFH concentration are shown as a function of elapsed time in Fig. 4c. This result confirms that there exists an optimal ratio of DCFH concentration to radioactivity in sample. In Fig. 4d, the SBRs measured at different elapsed times were plotted as a function of the ratio of radioactivity to DCFH concentration (GBq/nmole) in sample, which we denote as α. We observe that there exists an optimal incubation time to achieve maximal SBR. We assume the optimal incubation time is on the order of the half-life of the radionuclide in use, which is 110 minutes for 18F. This is because the rate of fluorescence activation for the mixtures of DCFH and FDG decreases over time, while the non-specific activation of DCFH remains relatively constant. Given 4 hours of incubation time, an SBR higher than 10 is achieved for α between of 1.6 and 160 (GBq/nmole), with the peak value achieved for α = 16 (GBq/nmole). Accordingly, the optimal DCFH concentration is about 1 μM given 110 μm drop diameter and 20 Bq/cell radiolabeling. Detailed protocol of preparing the DCFH solution, including the selection of an optimal cell dissociation buffer for FRCM experiments, is described in Supplementary Information including Figs. S6 and S7.
3.3. FRCM of live cancer cells
The FRCM pipeline was then applied to measure the uptake of FDG by live human breast adenocarcinoma cells (MDA-MB-231). To estimate the contribution of intrinsic cell metabolism and other non-specific processes to fluorescence activation of DCFH, a control FRCM experiment was first performed with non-radiolabeled cells. The fluorescence micrograph of control droplets shows that drop fluorescence was uniformly low, regardless of the presence of cells (Fig. 5a). No significant increase of background fluorescence was observed in the water-phase, suggesting minimal leakage of cellular ROS. We observed that some encapsulated cells exhibited visible fluorescence, and we attribute this to DCFH which was partitioned into the cell and converted to DCF in reaction to cell-intrinsic ROS. In contrast, when cells were incubated with FDG, we observed a large difference in fluorescence intensity between empty drops and cell-containing drops (Fig. 5b). PMT measurements acquired using FRCM show a similar trend: for non-radioactive cells, we found little difference between drops containing cells and empty drops (Fig. 5c), whereas for cells incubated with FDG, there was a clear difference in terms of peak heights between empty drops and cell-containing drops. (Fig. 5d). The results clearly demonstrate that the increase in drop fluorescence measured by FRCM is directly caused by the radiotracers taken up by the cells.
Figure 5.

Fluorescence measurements of drops containing non-radiolabeled cells (control) vs. radiolabeled cells (sample). (a,b) Micrographs of drops at the inlet of DropRead microchips: (a) control and (b) sample; bright field image on the left and FITC fluorescence image on the right. (c,d) PMT measurements as a function of time for (c) control and (d) sample assays.
To further evaluate the performance of FRCM for single-cell analyses, we performed another experiment using two different cell populations that, by design, expressed different levels of glucose transporters and were incubated with the same amount of FDG. Our goal was to show that the signal measured by FRCM reflects true biological processes in cells. Here, MDA-MB-231 cells were transfected to silence the expression of SLC2A1, the gene encoding GLUT1 protein, using short-hairpin RNA (shRNA). While there exist 14 different types of GLUT protein, GLUT1 is one of the major transporters that is expressed in all cell types to facilitate basal glucose uptake(Smith and Walton 2002). GLUT1 expression is known to be one of the primary mediators of FDG uptake by cells. Once FDG is taken up, it becomes phosphorylated by hexokinase and effectively trapped inside the cell. The efficacy of SLC2A1 knockdown in the cells (shGLUT1) was confirmed by GLUT1 protein expression using Western blot and compared to a scrambled shRNA control (shSCR; see Fig. 6a and Fig. S8).
Figure 6.

(a) Western blot comparing SLC2A1 knockdown (shGLUT1) to scrambled shRNA control (shSCR) in MDA-MB-231 cells. (b) Averaged radioactivity of shSCR and shGLUT1 samples measured using bulk dose calibrator and hemocytometry. The error bars show standard deviation and associated with cell counting. (c) Half-violin plot summarizing the drop read results. Each dot in the scatter plots on the left-hand side represents a single drop measured by FRCM. The frequency distribution corresponding to the scatter plot is shown on the right-hand side. Grey: non-radioactive cell sample (i.e., control), red: FDG-labeled control shSCR cell sample, and blue: FDG-labeled shGLUT1 cell sample.
Initial bulk radioactivity measurements confirmed that GLUT1 knockdown cells took up 53% less FDG compared to the control shSCR cells (Fig. 6b). However, unlike FRCM, bulk gamma counting does not provide information about heterogeneity at the cellular level. The radioactivity of the single cells from both the groups were therefore measured using FRCM. By doing so, we aimed to confirm our earlier results showing that the FRCM signal was specific to FDG uptake. Second, we aimed to demonstrate the radiometric accuracy of the proposed technique and show that it could differentiate between two different levels of radiotracer uptake by single cells.
The half-violin box plot in Fig. 6c summarizes the drop read results for all the experiments. In the plot, each dot corresponds to the pulse height measured by the PMT for a single fluorescent drop. The shaded area on the right-hand side shows the frequency distribution of the drop fluorescence measurements. The two grey-colored data sets are measured from the control experiment, which compared empty drops and drops containing non-radioactive cells. As previously mentioned, we attribute the small increase in fluorescence in cell-containing drops to DCFH partitioned into the cell and activated. We believe the any leakage of long-lived ROS out of an encapsulated cell was significantly suppressed as cells were kept ice-cold throughout the experiment. The red-colored data represent the FDG uptake of control cells treated with scrambled shRNA, and the blue-colored that of GLUT1 knockdown cells. As expected, on average, the drops containing radioactive single cells (i.e., radiolabeled shSCR and shGLUT1) exhibited much brighter fluorescence than the drops containing non-radioactive cells. In addition, the FRCM signal was significantly lower when GLUT1 was knocked down in cells (P < 10−4). On average, FRCM pulse height signal was 52% lower for the shGLUT1 cells compared to the control shSCR cells. This decrease in comparable to the 53% decrease in uptake measured using bulk gamma counting, suggesting that FRCM is a quantitative approach. This finding confirms that the increase in drop fluorescence was specifically due to FDG taken up by cells via GLUT1. This also demonstrated that the proposed technique has excellent radiometric accuracy, being capable of successfully differentiating the weak and strong levels of radiolabeling.
The FRCM results also highlight notable heterogeneity in cellular metabolism, as shown by the wide distribution of values in Fig. 6c. Using RLM, we previously found large heterogeneity in FDG uptake, even among cells from the same population(Sengupta et al. 2019). This heterogeneity reflects the tremendous metabolic plasticity of cancer cells, which can use a variety of different metabolic substrates such as glucose and glutamine to satisfy their energetic requirements. To quantify the level of heterogeneity in these cell lines, we computed the coefficient of variation for both cell population and found it to be 50% for the control cells and 46% for the GLUT1 knockdown cells. Another remarkable feature of the data is the biphasic distribution of FDG uptake for shGLUT1 cells. This unusual distribution suggests that this sample is likely composed of two different sub-populations of cells. The first subpopulation of cells shows almost no detectable FDG uptake based on the pulse-height signal. This may be because GLUT1 expression was efficiently suppressed. These cells likely exist in a state of metabolic quiescence or may rely on other metabolic fuels such as glutamine. The second subpopulation contains cells that have higher FDG uptake, which may be due to the variable efficiency of GLUT1 silencing. These cells may also transport FDG through other glucose transporters such as GLUT3.
4. CONCLUSIONS
We present a method of quantifying radiolabeled small molecules in single cells through the permanent activation of radiofluorogenic droplets. By converting stochastic radioactive decays into a continuous fluorescence signal, FRCM significantly reduced exposure time per cell to 100 ms/cell, down from the previous state of the art of 30 s/cell for RLM. This 300-fold reduction in exposure time per cell allowed rapid, high-throughput radiometry of single cells. FRCM successfully measured over 500 single cells in less than a minute. Another notable advantage is that the proposed platform is versatile and compatible with various fluorescent probes for multiplexing biological reporters with existing diagnostic or therapeutic radiotracers. In this proof of concept, we measured the metabolic flux of glucose in single cells using FDG as the tracer. The proposed FRCM can also employ other radiotracers to investigate, for instance, radiolabeled drug incorporation, biological substrate transport, or therapeutic isotope uptake in single cells. Furthermore, the continuous-flow platform also allows integration with downstream cell sorting for post-analysis such as RNA sequencing or directed evolution. We believe that the approach has potential applications ranging from analytical assays for cancer and other diseases to the development of small-molecule drugs.
Supplementary Material
Highlights.
First demonstration of high-throughput single-cell flow radiocytometry
An optimized radiofluorogenic preparation was developed to achieve optimal sensitivity for single-cell radioactivity measurements
Microfluidic and optofluidic devices were designed for efficient drop generation and read using a high-resolution 2-photon 3D lithographic process
A system was developed to minimize physical and chemical crosstalk between radiofluorogenic drops
As a proof of concept, we compared FDG uptake by control and GLUT1-knock-down cells, which successfully quantitated the difference in the metabolic flux of glucose in the two biologically different samples and assessed cellular heterogeneity on the level of single cells
ACKNOWLEDGEMENTS
We thank Kai Cheng for discussion on fluorescence chemistry. This work was supported in part by funding from the National Institutes of Health (R21CA193001) and from the Damon Runyon Cancer Research Foundation (DRR-36-15).
Footnotes
Publisher's Disclaimer: This is a PDF file of an unedited manuscript that has been accepted for publication. As a service to our customers we are providing this early version of the manuscript. The manuscript will undergo copyediting, typesetting, and review of the resulting proof before it is published in its final form. Please note that during the production process errors may be discovered which could affect the content, and all legal disclaimers that apply to the journal pertain.
COMPETING INTERESTS
G.P. is listed as inventor on a patent (US 20160025701 A1) related to this work. Other authors declare no conflict of interest.
Declaration of interests
The authors declare the following financial interests/personal relationships which may be considered as potential competing interests:
G.P. is listed as inventor on a patent (US 20160025701 A1) related to this work. Other authors declare no conflict of interest.
REFERENCES
- Cai L, Friedman N, Xie XS, 2006. Nature 440, 358–362. [DOI] [PubMed] [Google Scholar]
- Cantelmo AR, Conradi L-C, Brajic A, Goveia J, Kalucka J, Pircher A, Chaturvedi P, Hol J, Thienpont B, Teuwen L-A, 2016. Cancer cell 30, 968–985. [DOI] [PMC free article] [PubMed] [Google Scholar]
- Chattopadhyay A, Shrivastava S, Chaudhuri A, 2016., John Wiley & Sons, Inc
- Chen X, Zhong Z, Xu Z, Chen L, Wang Y, 2010. Free radical research 44, 587–604. [DOI] [PubMed] [Google Scholar]
- Conti M, Eriksson L, 2016. EJNMMI physics 3, 8. [DOI] [PMC free article] [PubMed] [Google Scholar]
- Cornell University, I., and WIPO, 2019. Analytical biochemistry 220(2), 360–366. [Google Scholar]
- Fritzsch FS, Dusny C, Frick O, Schmid A, 2012. Annual review of chemical and biomolecular engineering 3, 129–155. [DOI] [PubMed] [Google Scholar]
- Gallina ME, Kim TJ, Shelor M, Vasquez J, Mongersun A, Kim M, Tang SK, Abbyad P, Pratx G, 2017. Analytical chemistry 89, 6472–6481. [DOI] [PMC free article] [PubMed] [Google Scholar]
- Hamilton KE, Bouwer MF, Louters LL, Looyenga BD, 2021. Biochimie. [DOI] [PMC free article] [PubMed] [Google Scholar]
- Hartmann A, Krainer G, Schlierf M, 2014. Molecules 19, 13735–13754. [DOI] [PMC free article] [PubMed] [Google Scholar]
- Hu F, Chen Z, Zhang L, Shen Y, Wei L, Min W, 2015. Angewandte Chemie International Edition 54, 9821–9825. [DOI] [PMC free article] [PubMed] [Google Scholar]
- Hughes LD, Rawle RJ, Boxer SG, 2014. PloS one 9, e87649. [DOI] [PMC free article] [PubMed] [Google Scholar]
- Kalyanaraman B, Darley-Usmar V, Davies KJ, Dennery PA, Forman HJ, Grisham MB, Mann GE, Moore K, Roberts LJ II, Ischiropoulos H, 2012. Free radical biology and medicine 52, 1–6. [DOI] [PMC free article] [PubMed] [Google Scholar]
- Kim TJ, Türkcan S, Pratx G, 2017. Nature protocols 12, 1055. [DOI] [PMC free article] [PubMed] [Google Scholar]
- Kiru L, Kim TJ, Shen B, Chin FT, Pratx G, 2018. Molecular imaging and biology 20, 378–387. [DOI] [PMC free article] [PubMed] [Google Scholar]
- Lacroix A.l., Vengut-Climent E, De Rochambeau D, Sleiman HF, 2019. ACS central science 5, 882–891. [DOI] [PMC free article] [PubMed] [Google Scholar]
- LeBel CP, Ischiropoulos H, Bondy SC, 1992. Chemical research in toxicology 5, 227–231. [DOI] [PubMed] [Google Scholar]
- Li F-L, Liu J-P, Bao R-X, Yan G, Feng X, Xu Y-P, Sun Y-P, Yan W, Ling Z-Q, Xiong Y, 2018. Nature communications 9, 1–17. [DOI] [PMC free article] [PubMed] [Google Scholar]
- Liu Z, Lan XL, 2019. Lab on a Chip 19, 2315–2339. [DOI] [PubMed] [Google Scholar]
- Mazutis L, Gilbert J, Ung WL, Weitz DA, Griffiths AD, Heyman JA, 2013. Nature protocols 8, 870–891. [DOI] [PMC free article] [PubMed] [Google Scholar]
- Pratx G, Chen K, Sun C, Martin L, Carpenter CM, Olcott PD, Xing L, 2012. PloS one 7, e46285. [DOI] [PMC free article] [PubMed] [Google Scholar]
- Sengupta D, Mongersun A, Kim TJ, Mongersun K, von Eyben R, Abbyad P, Pratx G, 2019. Technology in cancer research & treatment 18, 1533033819841066. [DOI] [PMC free article] [PubMed] [Google Scholar]
- Sengupta D, Pratx G, 2016. Journal of Nuclear Medicine 57, 1136–1140. [DOI] [PMC free article] [PubMed] [Google Scholar]
- Sinclair LV, Barthelemy C, Cantrell DA, 2020. Immunometabolism 2. [DOI] [PMC free article] [PubMed] [Google Scholar]
- Sleiman M, Destaillats H, Gundel LA, 2013. Talanta 116, 1033–1039. [DOI] [PubMed] [Google Scholar]
- Smith TAD, Walton P, 2002. Nuclear medicine communications 23, 1085–1090. [DOI] [PubMed] [Google Scholar]
- Tao J, Diaz RK, Teixeira C.s.R., Hackmann TJ, 2016. Biochemistry 55, 2578–2589. [DOI] [PubMed] [Google Scholar]
- Türkcan S, Kiru L, Naczynski DJ, Sasportas LS, Pratx G, 2019. Cancer research 79, 410–419. [DOI] [PMC free article] [PubMed] [Google Scholar]
- Yoshioka K, Saito M, Oh K-B, Nemoto Y, Matsuoka H, Natsume M, Abe H, 1996. Bioscience, biotechnology, and biochemistry 60, 1899–1901. [DOI] [PubMed] [Google Scholar]
- Zanetti-Domingues LC, Martin-Fernandez ML, Needham SR, Rolfe DJ, Clarke DT, 2012. PloS one 7, e45655. [DOI] [PMC free article] [PubMed] [Google Scholar]
- Zanetti-Domingues LC, Tynan CJ, Rolfe DJ, Clarke DT, Martin-Fernandez M, 2013. PloS one 8, e74200. [DOI] [PMC free article] [PubMed] [Google Scholar]
- Zenobi R, 2013. Science 342. [DOI] [PubMed] [Google Scholar]
- Zhao H, Duan Q, Zhang Z, Li H, Wu H, Shen Q, Wang C, Yin T, 2017. Journal of cellular and molecular medicine 21, 2055–2067. [DOI] [PMC free article] [PubMed] [Google Scholar]
Associated Data
This section collects any data citations, data availability statements, or supplementary materials included in this article.