Abstract
Schizothorax o’connori (S. o’connori) is a representative tetraploid species in the subfamily Schizothoracinae and an important endemic fish in the Qinghai-Tibet Plateau. However, the domestication of S. o’connori remains challenging due to the lack of basic research. Here, we investigated the effects of artificial feeding on the oocytes and liver of S. o’connori by comparing the histological, metabolomic, and transcriptomic data. Histological results showed that the oocytes and liver of captive-reared S. o’connori had abnormal cell morphology. After comparison with the self-built database, a total of 233 metabolites were annotated. In oocytes, a total of 37 differentially accumulated metabolites (DAMs) were detected and two pathways were significantly enriched. There were obvious differences in the metabolites related to ovarian development, including pregnenolone and arachidonic acid. In liver, a total of 70 DAMs were detected and five pathways were significantly enriched. Based on the transcriptomic data, a total of 159 differentially expressed genes (DEGs) were significantly related with cell growth and death pathway in oocytes, while a total of 2841 DEGs were significantly related with 102 pathways in liver. Comparing the metabolomic and transcriptomic data showed that there were three common significant enrichment pathways in liver, including biosynthesis of unsaturated fatty acids, starch and sucrose metabolism, and fatty acid biosynthesis. These results showed that special attention should be given to the composition and intake of fatty acids during the artificial breeding of S. o’connori. In addition, many of metabolite-gene pairs were related to adenosine 5′-diphosphate, adenosine monophosphate, and pregnenolone. In summary, these data provide an overview of global metabolic and transcriptomic resources and broaden our understanding of captive-reared S. o’connori.
Keywords: Schizothorax o’connori, metabolome, transcriptome, liver, oocyte, captivity
Introduction
Schizothorax o’connori (S. o’connori) is an important subfamily of endemic tetraploid fish in the main streams and tributaries of the Yarlung Tsangpo River (YLTR) on the Qinghai-Tibet Plateau (QTP) (Qi et al., 2012). It is also an excellent model organism for investigations of genome evolution and Quaternary climatic oscillations on the population structure of species endemic to the QTP (Guo et al., 2016; Xiao et al., 2020). For example, the study of the S. o’connori genome provided new insights into early re-diploidization and high-altitude adaptation of the endemic fish (Xiao et al., 2020). However, due to human activities and overfishing, the wild resources of S. o’connori have been declining in recent years. S. o’connori has been classified as a threatened species according to a recent investigation of fishery resources in the YLTR (Ma et al., 2020).
Domestication of S. o’connori is considered as an effective tool for the utilization and protection of the fish resources. Artificial breeding and reproduction of S. o’connori have been performed in recent years (Jing et al., 2011; Zhang, 2011). However, the domestication of S. o’connori remains many challenges, such as the fish may exhibit important reproductive dysfunctions when raised in captivity (Zhang, 2011). The gene expression profile of S. o’connori gonads is poorly understood. Multiple studies have shown that fish reproductive dysfunction comes from comprehensive stress under artificial breeding conditions, especially nutritional factors including fatty acids and vitamins, which play vital roles in egg quality and reproductive function (Izquierdo et al., 2001; Schreck et al., 2001; Mylonas et al., 2010; Rodríguez-Barreto et al., 2014). In addition, vitellogenin synthesized in the liver also plays an important role in the development of oocytes (Guzmán et al., 2008). In most teleost, the zona pellucida proteins are synthesized in the liver and subsequently transported to the growing oocytes (Modig et al., 2007). In the carp ovary, pregnenolone is synthesized from cholesterol which is synthesized in the liver (Mukherjee et al., 1991). Both liver and ovarian tissues play an important role in the reproductive process of various fish (Shirai et al., 2001; Hammond, 2011; Nagler et al., 2012; Qiao et al., 2019). However, effects of artificial feeding on the oocyte and liver of S. o’connori remain poorly understood.
Therefore, the objective of this study was to investigate the effects of artificial feeding on the oocytes and liver of S. o’connori. This was achieved by comparing the histology, metabolome, and transcriptome of the liver and oocytes in wild and captive-reared S. o’connori. By integrating metabolomic and transcriptomic data, we further identified potential differentially accumulated metabolites (DAMs) and the corresponding differentially expressed genes (DEGs) at the biochemical and molecular levels.
Materials and Methods
Experimental Animals and Animal Care
Before the spawning season, wild female S. o’connori individuals were captured in the YLTR in Tibet, and cultivated S. o’connori individuals were collected at the Institute of Fisheries Science, Tibet Academy of Agricultural and Animal Husbandry Sciences (Tibet, China). Cultivated S. o’connori individuals were fed with a formula feed containing 35% crude protein and 8% lipids twice a day at 3% body weight each time for more than 1 year. A total of four wild-type and four cultured female S. o’connori individuals were randomly selected for the experiment. All experiments with fish in this study were conducted in accordance with the guidelines on the care and use of animals for scientific purposes, established by the College of Animal Science and Technology of Henan Agricultural University, Zhengzhou, China (approval number: No. 20190521). After euthanizing, the liver and oocyte were collected. Part of the tissues was rapidly snap-frozen in liquid nitrogen and stored at −80°C, while the other part was fixed in Bouin’s fluid overnight at 4°C.
Hematoxylin and Eosin Staining
The fixed samples were dehydrated in an alcohol gradient and xylene and then embedded in paraffin prior to being cut into 5-μm sections for HE staining. HE staining was performed as previously described (Feldman and Wolfe, 2014). Three discontinuous sections for each sample were selected and observed with a light microscope at 400X and 20X (Olympus, Japan).
Metabolomics Analysis
For each tissue, approximately 50 mg of powdered sample was vortexed in 400 μl of cold mix (acetonitrile:methanol:water, 4:4:2) and then incubated for 60 min at −20°C. After centrifugation at 14,000 g for 20 min at 4°C, the supernatant was collected and dried in a vacuum desiccator. To end derivatization, the sample was vortexed in 100 μl of an acetonitrile:water mixture (1:1) for 1 min. After centrifugation at 14,000 g for 15 min at 4°C, 2 μl of supernatant was immediately analyzed using liquid chromatography electrospray ionization tandem mass spectrometry (LC-ESI-MS/MS).
Chromatographic separation was implemented on an ultra-high performance Liquid Chromatography (Agilent 1290 Infinity, Waldbronn, Germany). The column oven was maintained at 25°C. The flow rate was 0.3 ml/min. The injection volume for each sample was 2 μl. The mobile phase consisted of solvent A (water + 25 mM aqueous ammonia + 25 mM ammonia) and solvent B (acetonitrile). Gradient elution conditions were set as follows: 0–1 min, 95% phase B; 1–14 min, 95–65% B; 14–16 min, 65–40% B; 16–18 min, 40% B; 18–18.1 min, 40–95% B; 18.1–23 min, 95% B. The samples were continuously analyzed in a 4°C autosampler. The quality control samples were inserted into the sample queue to evaluate system stability throughout the experiment.
The metabolites were then analyzed using a high-resolution tandem mass spectrometry TripleTOF 6600 (AB SCIEX, United States) with an electronic spray ionization (ESI) source, operated in both positive and negative ion modes. The ESI source operation parameters were as follows: source temperature, 600°C; IonSpray Voltage Floating (ISVF), ±5500 V; ion source gas I (GSI), gas II (GSII), and curtain gas (CUR), 60, 60, and 30 psi, respectively. The time-of-flight (TOF) mass range was from 60 to 1000 Da, and the scan time was 0.2 s/spectra. The product ion scan range was from 25 to 1000 Da, and the product ion scan time was 0.06 s/spectra. The operation parameters of the high-sensitivity mode were as follows: declustering potential, ±60 V; collision energy, 35 ± 15 eV; excluding isotopes, within 4 Da; and candidate ions to monitor per cycle, 6.
The raw data were converted into mzXML format by ProteoWizard. Peak identification, filtration, and alignment were performed using XCMS program. The ion peaks with >50% missing values. The identification of each metabolite was performed according to the chemical formula generated from the accurate mass, with an accuracy of <25 ppm and MS/MS spectrogram matching. Metabolite identification was performed using a self-built database (Personalbio Technology Co., Ltd., Shanghai, China).
Principal component analysis (PCA), partial least square discriminant analysis (PLS-DA), and orthogonal partial least squares discriminant analysis (OPLS-DA) were performed after pattern recognition and pareto-scaling using SIMCA-P 14.1 (Umetrics, Umea, Sweden). The variable influence on projection (VIP) values were obtained from the OPLS-DA. Differentially accumulated metabolites (DAMs) were defined according to the following criteria: a VIP value > 1 and a q-value < 0.05. Clustering analyses of DAMs were applied based on Euclidean distance. Metabolic pathway analyses were performed using the Kyoto Encyclopedia of Genes and Genomes (KEGG) database (http://www.kegg.jp/). KEGG pathways with FDR < 0.05 were considered to be significantly enriched.
Transcriptome Analysis
Total RNA was extracted using TRIzol reagent (Takara, Dalian, China) following the manufacturer’s instructions and treated with DNase I. RNA quantity and purity were assessed using the RNA Nano 6000 Assay Kit of the Bioanalyzer 2100 system (Agilent Technologies, CA, United States). Sequencing libraries were generated using the TruSeq RNA Sample Preparation Kit (Illumina, San Diego, CA, United States) following the manufacturer’s recommendations. The library was purified (AMPure XP system) and quantified using the Agilent high sensitivity DNA assay on a Bioanalyzer 2100 system (Agilent Technologies, CA, United States). The libraries were then sequenced on a HiSeq platform (Illumina, San Diego, CA, United States) by Shanghai Personal Biotechnology Cp. Ltd., and 150 bp paired reads were generated. The raw sequence files were deposited to the National Center for Biotechnology Information Sequence Read Archive with accession number SRP300881.
Raw reads were filtered to remove adaptor-containing reads, low quality reads (mean Q-value <20), and reads containing more than 5% ambiguous nucleotides using SOAPnuke (V2.0.7) (Chen et al., 2018). Clean reads were obtained and aligned to the Schizothorax o’connori genome (Xiao et al., 2020) using Bowtie2 v2.2.5 (Langmead and Salzberg, 2012). The gene expression level was estimated based on the unique mapped reads by the reads per kilobase million mapped reads (RPKM) method using RSEM v1.2.8 (Li and Dewey, 2011). Hierarchical clustering analyses were performed based on the Pearson correlation and average linkage method. Differentially expressed genes were identified by DESeq2 (v1.16) with a fold change (FC) > 2 and a false discovery rate (FDR) < 0.05 (Love et al., 2014). GO enrichment analysis was performed using Blast2GO software (Conesa et al., 2005). Pathway analysis of DEGs was performed using the KEGG PATHWAY database (http://www.kegg.jp) and Blast2GO (Conesa et al., 2005). GO and KEGG terms with FDR < 0.05 were considered to be significantly enriched. The Pathview package was used to visualize the results of association analysis of differential metabolites and related transcripts.
Quantitative Real-Time PCR Analysis
qRT-PCR analysis was performed by using the ChamQ SYBR qPCR Master Mix (Vazyme Biotec, Nanjing, China) on a Light Cycler 480 system (Roche, Basel, Switzerland). A total of 10 DEGs related to fatty acid biosynthesis, biosynthesis of unsaturated fatty acids, and starch and sucrose metabolism, which are three significantly enriched pathways, are selected. Specific primers are listed in Supplementary Table S5. The expression levels of genes were normalized to the expression of the ACTB1 and calculated by the 2−ΔΔCt method. All samples were carried out in three technical replicates on the same plate. Data were expressed as mean ± standard deviation. Pearson correlations were computed to evaluate the correlation between the RNA-seq and qRT-PCR data.
Results
Gross Morphology and Histology Analysis
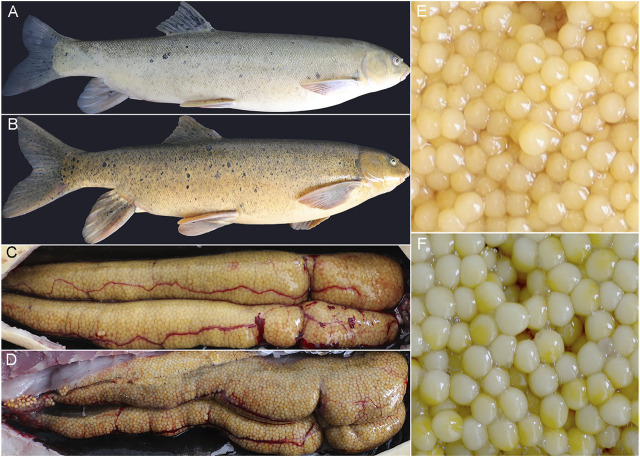
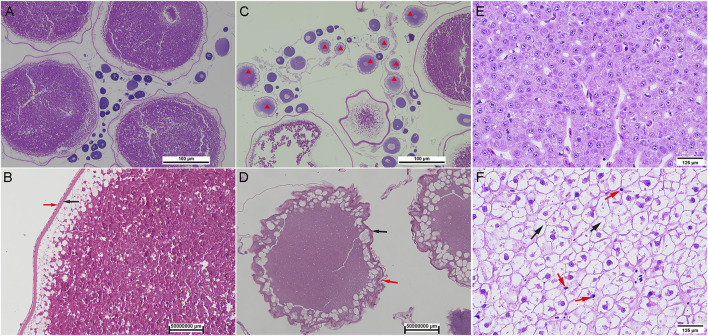
Compared with wild S. o’connori, captive-reared S. o’connori has a yellow body color and nonuniformly sized whitish ova (Figure 1). Histological examination further showed that compared with wild S. o’connori, there were many atresia oocytes in the ovaries of captive-reared S. o’connori. The chorion and follicular cell layer also showed irregular shrinkage and folding (Figures 2A–D). The liver cells were evenly distributed in wild S. o’connori, while the nucleus was absent or pushed to the edge of the cell (Figures 2E,F, red arrows), and the cytoplasm was liquefied in the liver of captive-reared S. o’connori (Figures 2E,F, black arrows).
FIGURE 1.
Gross morphology of S. o’connori, ovary, and ovum between wild and captive-reared group. (A) A photograph of wild S. o’connori. (B) A photograph of captive-reared S. o’connori. The ovary (C) and ovum (E) of wild S. o’connori. The ovary (D) and ovum (F) of captive-reared S. o’connori.
FIGURE 2.
Histology of oocyte and liver in wild and captive-reared S. o’connori. (A, B) The oocytes at stages IV in ovaries of wild S. o’connori. (C, D) The oocytes at stages IV in ovaries of captive-reared S. o’connori. Red star: atresia oocytes; Black arrow: chorion; Red arrow: follicular cell layer. The liver in wild (E) and captive-reared (F) S. o’connori. Black arrow: liquefied cytoplasm.
Metabolic Profile Analysis
Metabolites were further analyzed using a liquid chromatography electrospray ionization tandem mass spectrometry (LC-ESI-MS/MS) system. The retention time and peak intensities of the quality control (QC) samples were reproducible, indicating that LC-ESI-MS/MS was reliable (Supplementary Figure S1). After raw data were preprocessed, 5,129 metabolite peaks (2,671 peaks in ESI positive mode and 2,458 peaks in ESI negative mode) were obtained for further analysis. The results of PCA, PLS-DA, and OPLSDA showed that the wild and captive-reared groups were clearly different in both the liver and the oocytes, reflecting significant metabolic differences among the different groups (Table 1, Supplementary Figures S2, S3). All samples fell within the 95% confidence interval.
TABLE 1.
Multivariate analysis of metabolites in wild and captive-reared S. o’connori.
| Multivariate analysis | Group | Positive ion model | Negative ion model | ||||||||||
|---|---|---|---|---|---|---|---|---|---|---|---|---|---|
| A | R2X | R2Y | Q2 | R2 intercept | Q2 intercept | A | R2X | R2Y | Q2 | R2 intercept | Q2 intercept | ||
| PCA | QC | 3 | 0.507 | 0.219 | 3 | 0.532 | 0.243 | ||||||
| OD vs OW | 2 | 0.503 | 0.0346 | 2 | 0.529 | 0.0701 | |||||||
| LD vs LW | 2 | 0.495 | −0.043 | 2 | 0.542 | 0.0148 | |||||||
| PLS-DA | OD vs OW | 2 | 0.5 | 0.998 | 0.852 | 2 | 0.521 | 0.997 | 0.924 | ||||
| LD vs LW | 2 | 0.469 | 0.999 | 0.907 | 2 | 0.533 | 0.999 | 0.942 | |||||
| OPLS-DA | OD vs OW | 1 + 3 + 0 | 0.714 | 1 | 0.943 | 1 | 0.614 | 1 + 4 + 0 | 0.82 | 1 | 0.958 | 1 | 0.787 |
| LD vs LW | 1 + 3 + 0 | 0.725 | 1 | 0.921 | 1 | 0.633 | 1 + 3 + 0 | 0.752 | 1 | 0.961 | 1 | 0.53 | |
PCA, principal component analysis; PLS-DA, partial least squares-discriminant analysis; OPLS-DA, orthogonal partial least squares-discriminant analysis; QC, quality control; LW, liver from wild S. o’connori; LD, liver from domestic S. o’connori; OW, oocyte from wild S. o’connori; OD, oocyte from domestic S. o’connori.
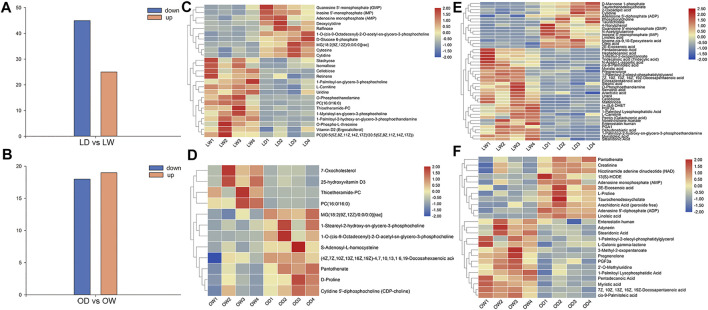
After comparison with the self-built database, a total of 233 metabolites were annotated. There were 12 and 25 differentially accumulated metabolites (DAMs) between oocyte from domestic S. o’connori (OD) and oocyte from wild S. o’connori (OW) in the ESI+ and ESI− modes, respectively (Supplementary Table S1). However, there were 25 and 45 DAMs between liver from domestic S. o’connori (LD) and liver from domestic S. o’connori (LW) in the ESI+ and ESI− modes, respectively (Supplementary Table S1). Of the 37 DAMs identified between OD and OW, 18 (48.65%) and 19 (51.35%) metabolites were downregulated and upregulated, respectively. These DAMs included many metabolites related to ovarian development, such as pregnenolone, prostaglandin F3a (PGF3a), arachidonic acid (ARA), adenosine 5′- diphosphate (ADP), and adenosine monophosphate (AMP). Of the 70 DAMs in LD compared to LW, 45 (64.29%) and 25 (35.71%) metabolites were downregulated and upregulated, respectively (Figures 3A,B). A hierarchical clustering analysis was further performed to assess the DAMs accumulation patterns (Figures 3C–F).
FIGURE 3.
Differentially accumulated metabolites (DAMs) between the wild and captive-reared S. o’connori in both liver and oocyte. Number of DAMs in liver (A) and oocyte (B). Hierarchical clustering analysis of DAMs using both positive (C, D) and negative (E, F) ionization mode in liver (C, E) and oocyte (D, F). LW, liver from wild S. o’connori; LD, liver from domestic S. o’connori; OW, oocyte from wild S. o’connori; OD, oocyte from domestic S. o’connori.
According to the previous KEGG analysis, only two pathways were significantly enriched between the OD and OW group. These included arginine and proline metabolism and linoleic acid metabolism. There were five significantly enriched pathways between LD and LW, including the biosynthesis of unsaturated fatty acids, pyrimidine metabolism, ABC transporters, starch and sucrose metabolism, and fatty acid biosynthesis (Supplementary Table S2).
General Analysis of Gene Expression Profiles Between Wild and Captive-Reared S. o’connori
To provide an overview of the system-wide changes in gene expression during artificial breeding, transcriptomic profiles were investigated using RNA-Seq. After data filtering, a total of 658.68 M clean reads were acquired, ranging from 39.4 to 45.1 M clean reads per sample. Among these, more than 88.56 and 72.16% were mapped to the S. o’connori genome and the exonic regions for each sample, respectively. However, the average percentage of uniquely mapped reads of exonic regions was only 21.10%, indicating large number of duplicated genes (Table 2). Saturation curve analysis showed that the results of gene quantification were reliable (Figure 4A). Correlation analysis and cluster analysis were performed to gain insight into the relationships among different samples. Almost all the biological duplicates were also clustered together, confirming the relevance of the samples (Figures 4B,C).
TABLE 2.
Summary of RNA-seq reads mapping to reference genome.
| Samples | Clean reads | Mapping to genome rate (%) | Mapping to exon rate (%) | Uniq-mapping exon rate (%) |
|---|---|---|---|---|
| LD1 | 39.85 | 89.81 | 77.04 | 18.81 |
| LD2 | 41.01 | 88.56 | 73.32 | 19.95 |
| LD3 | 41.16 | 89.31 | 75.26 | 20.34 |
| LD4 | 41.20 | 89.06 | 72.16 | 20.04 |
| LW1 | 41.41 | 92.26 | 78.28 | 19.73 |
| LW2 | 45.07 | 90.87 | 75.85 | 20.47 |
| LW3 | 41.53 | 92.86 | 80.00 | 19.68 |
| LW4 | 43.00 | 91.51 | 77.58 | 18.44 |
| OD1 | 40.48 | 92.09 | 80.80 | 22.33 |
| OD2 | 40.58 | 92.12 | 80.81 | 22.70 |
| OD3 | 40.22 | 92.01 | 80.68 | 21.92 |
| OD4 | 40.50 | 92.38 | 80.49 | 22.20 |
| OW1 | 41.03 | 93.04 | 82.48 | 22.19 |
| OW2 | 39.40 | 93.11 | 81.81 | 22.64 |
| OW3 | 41.01 | 93.40 | 81.81 | 23.31 |
| OW4 | 41.23 | 93.09 | 81.79 | 22.88 |
LW, liver from wild S. o’connori; LD, liver from domestic S. o’connori; OW, oocyte from wild S. o’connori; OD, oocyte from domestic S. o’connori.
FIGURE 4.
(A) Saturation curves analysis of all the biological samples. (B) Correlation analysis and hierarchical clustering of all the biological samples. LW, liver from wild S. o’connori; LD, liver from domestic S. o’connori; OW, oocyte from wild S. o’connori; OD, oocyte from domestic S. o’connori.
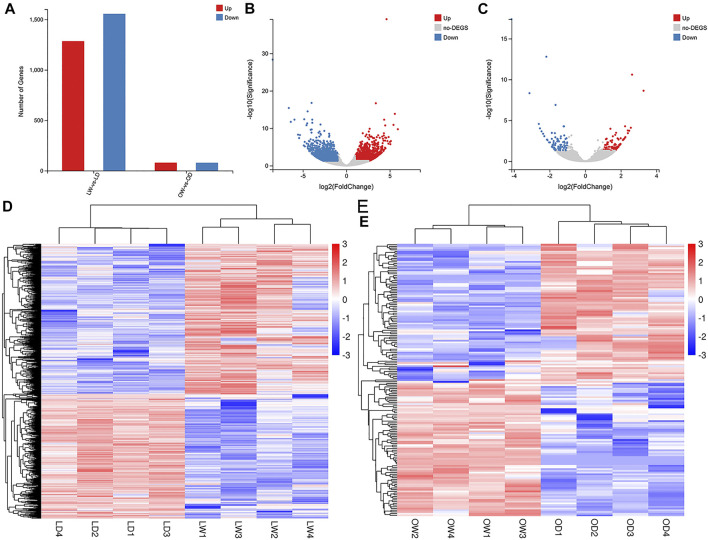
A total of 2,841 DEGs (1,285 upregulated and 1,556 downregulated) were found in LD compared with LW, and 159 DEGs (80 upregulated and 79 downregulated) were found in OD compared with OW (Figures 5A–C, Supplementary Table S3). All DEGs between the wild and captive-reared S. o’connori were classified using hierarchical clustering (Figures 5D,E).
FIGURE 5.
Analysis of differently expressed genes (DEGs) between the wild and captive-reared S. o’connori. (A) Number of DEGs in liver and oocyte between the wild and captive-reared S. o’connori. Volcano plot showing the DEGs in liver (B) and oocyte (C). Hierarchical clustering of DEGs in liver (D) and oocyte (E). Each row represents a gene and each column represents a sample. Each cell in the matrix corresponds to an expression level, with blue for under-expression, red for overexpression, and white for gene expression close to the median (see color scale). LW, liver from wild S. o’connori; LD, liver from domestic S. o’connori; OW, oocyte from wild S. o’connori; OD, oocyte from domestic S. o’connori.
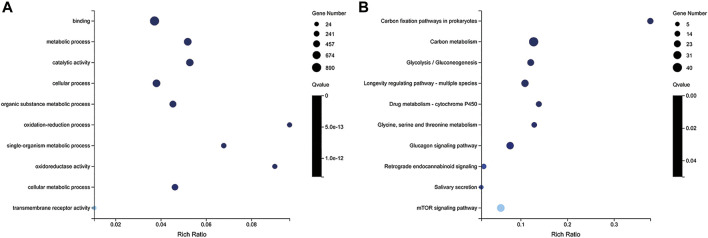
To further understand the functions of these DEGs, GO and KEGG analyses were performed. Between LD and LW, a total of 449 GO terms and 102 pathways were significantly enriched, respectively (Supplementary Table S4). The top 10 significantly enriched GO terms and pathways are shown in Figure 6, including carbon fixation pathways in prokaryotes, PPAR signaling pathway neuroactive ligand-receptor interaction, propanoate metabolism, and carbon metabolism. However, only one GO term and one pathway (cell growth and death) were significantly enriched between OD and OW.
FIGURE 6.
GO (A) and KEGG (B) enrichment analysis of differently expressed genes (DEGs) between LD and LW. The y-axis represents the enrichment pathway, while the x-axis represents the enrichment factor. The dot sizes represent the number of DEGs. LW, liver from wild S. o’connori; LD, liver from domestic S. o’connori.
Based on the DEG pathway enrichment results, qRT-PCR of 10 DEGs (ACACA, ELOV6, FADS2, FAS, PGM1, SCD5, LYAG, G6PC3, HXK2, and ACBG1) related to fatty acid biosynthesis, biosynthesis of unsaturated fatty acids, and starch and sucrose metabolism was performed to validate the differential gene expression obtained by RNA-seq. The results showed a strong correlation between the RNA-seq and qRT-PCR data (R2 = 0.90), indicating the reliability of the RNA-seq data (Figure 7).
FIGURE 7.
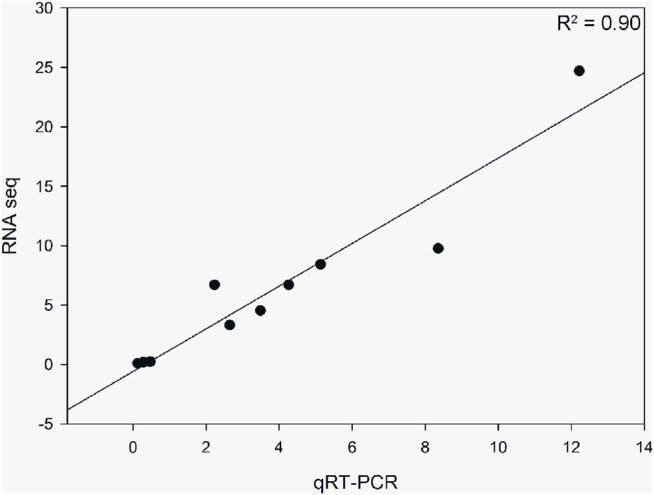
Correlation analysis of 10 differentially expressed genes obtained from RNA-seq and qRT-PCR. The qRT-PCR values were normalized relative to the expression levels of ACTB1 in the same sample. Data are expressed as the mean of three biological replicates.
Association Analysis of the Metabolomic and Transcriptomic Data
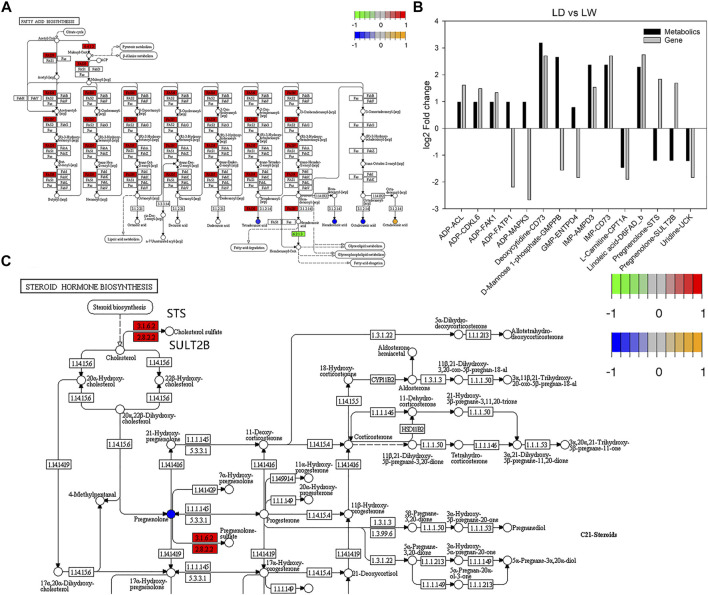
Comparing the metabolomic and transcriptomic data showed that there were three common significant enrichment pathways between LD and LW, including biosynthesis of unsaturated fatty acids, starch and sucrose metabolism, and fatty acid biosynthesis. The DAMs and DEGs related to the fatty acid synthesis pathway are shown in Figure 8A. However, no common pathway was detected between OD and OW. Notably, two DEGs (CDC25B and FZR1) in the progesterone-mediated oocyte maturation pathway were enriched, although the entire pathway was not significantly enriched. We further analyzed the metabolite-gene pairs using pathway-based integration method. Detailed information about the metabolite-gene pairs is shown in Supplementary Table S6. Top 15 metabolite-gene pairs between LD and LW are shown in Figure 8B. Of these, two metabolite-gene pairs including pregnenolone-STS and pregnenolone-SULT2B were negatively correlated (Figure 8B). These two metabolite-gene pairs are related to steroid hormone biosynthesis pathway (Figure 8C). In addition, the levels of pregnenolone and LDLR were all decreased in captive-reared S. o’connori.
FIGURE 8.
Integrated analysis of the accumulated metabolites (DAMs) and differently expressed genes (DEGs). (A) Fatty acid synthesis pathway. (B) Top 15 metabolite-gene pairs between LD and LW. (C) Part of steroid hormone biosynthesis pathway. The round nodes are metabolites, and the square nodes are the enzymes corresponding to the transcripts. The expression fold change of metabolites from low to high is represented by blue to yellow, and the expression fold change of transcripts from low to high is represented by green to red. ADP, adenosine monophosphate; GMP, guanosine 5′-monophosphate; IMP, inosine 5′-monophosphate; ACL, ATP-citrate synthase; AMPD3, AMP deaminase 3-like; CDKL6, cyclin-dependent kinase 6-like; CPT1A, carnitine O-palmitoyltransferase 1, liver isoform; D6FAD_b, delta-6 fatty acyl desaturase; ENTPD4, ectonucleoside triphosphate diphosphohydrolase 4-like; FAK1, focal adhesion kinase 1; FATP1, long-chain fatty acid transport protein 1; GMPPB, mannose-1-phosphate guanyltransferase beta; MAPK3, mitogen-activated protein kinase-activated protein kinase 3; STS, steryl-sulfatase; SULT2B, alcohol sulfotransferase; UCK, uridine-cytidine kinase; EC:2.8.2.2, SULT2B; EC:3.1.6.2, STS.
Discussion
S. o’connori is a representative tetraploid species in the subfamily Schizothoracinae and an important endemic fish in the QTP (Qi et al., 2012). However, its domestication remains challenging due to the lack of basic research. We report here the first histological, metabolomic, and transcriptomic analysis of liver and oocytes in wild and captive-reared S. o’connori.
Histological results showed that there were many atresia oocytes in captive-reared S. o’connori. Metabolomics data further revealed obvious differences in the metabolites related to ovarian development between the oocytes of wild and captive-reared S. o’connori, including pregnenolone, ARA, ADP, AMP, and PGF3a. Pregnenolone is an endogenous steroid and precursor/metabolic intermediate in the biosynthesis of most steroid hormones, such as estrogens, progestogens, glucocorticoids, androgens, and mineralocorticoids (Vallée, 2016). Studies in zebrafish, Scomber japonicus, and Pimephales promelas reported that pregnenolone plays an important role in the steroidogenesis pathway of the oocyte (Matsuyama et al., 2005; Petersen et al., 2015; Shang et al., 2019). ARA is a polyunsaturated fatty acid present in phospholipids and has an important role in reproduction (Tocher, 2003; Xu et al., 2016; Norberg et al., 2017). Oocyte maturation is inhibited by ADP and AMP (Miller and Behrman, 1986). Here, our data showed that the levels of pregnenolone and PGF3a decreased significantly in captive-reared S. o’connori, while the levels of ARA, ADP, and AMP increased significantly. Transcriptomic analysis also showed that the expression levels of CDC25B and FZR1, two genes related to progesterone-mediated oocyte maturation, were significantly different.
In addition, many studies have shown that the liver also plays important roles in the reproductive processes of various fish (Shirai et al., 2001; Nagler et al., 2012; Qiao et al., 2019). Here, HE staining showed that the cell morphology in the liver of captive-reared S. o’connori was abnormal. Based on the transcriptomic data between the livers of wild and captive-reared S. o’connori, a total of 2841 DEGs were significantly enriched in 102 pathways. Integrating the metabolomic and transcriptomic data revealed three common and significantly enriched pathways between the liver of wild and captive-reared S. o’connori, including biosynthesis of unsaturated fatty acids, starch and sucrose metabolism, and fatty acid biosynthesis. Fatty acids are not only the major source of metabolic energy in fish for growth, but are also very important in the reproduction of several fish species (Tocher, 2003; Tocher, 2010; Rodríguez-Barreto et al., 2014; Zupa et al., 2017). A report in gilthead seabream showed that dietary fatty acids were mostly incorporated into the ovary and liver (Harel et al., 1994). The biochemical composition of organs involved in reproduction is highly sensitive to the diet, which affects egg and larval quality (Harel et al., 1994). In Atlantic cod, ARA levels in both liver and ovary were correlated to dietary ARA levels (Norberg et al., 2017). In Asian seabass, the pathway of biosynthesis of unsaturated fatty acids was also significantly different when the fish were fed with different pelleted feeds (Ngoh et al., 2015).
The conversion of food habits is one of the greatest stresses for fish from wild to captive breeding. Nutrition is ultimately important in affecting egg quality and reproductive function (Schreck et al., 2001). Here, wild female S. o’connori individuals were captured in the YLTR before the spawning season. Diatom algae are the most important food for wild S. o’connori in the YLTR (Xie et al., 1994). Diatom algae store a high amount of fatty acids (Li et al., 2014; Tiwari et al., 2021). Cultivated S. o’connori individuals were fed with a formula feed containing 35% crude protein and 8% lipids for more than 1 year. Our results showed that special attention should be given to the composition and intake of fatty acids during the artificial breeding of S. o’connori.
Integrating the metabolomic and transcriptomic data also revealed kinds of metabolite-gene pairs. These metabolite-gene pairs contain 23 DAMs and 154 DEGs. Many of them were related to ADP, AMP, and pregnenolone. Here, we focused on the pregnenolone related metabolite-gene pairs, such as pregnenolone-STS, pregnenolone-SULT2B, and pregnenolone-LDLR. These metabolite-gene pairs are related to steroid hormone biosynthesis pathway which is a key pathway regulating ovarian development in fish species (Xu et al., 2016). STS and SULT2B catalyze the sulfonation of cholesterol and pregnenolone and have an important role in regulating the synthesis of estrogenic steroids (Ji et al., 2007; Purohit et al., 2011; Abunnaja et al., 2018). In Coilia nasus, SULT2B1 expression is significantly increased during ovary development (Xu et al., 2016). Our results revealed that the levels of pregnenolone and STS or SULT2B were negatively correlated in captive-reared S. o’connori. All steroid hormones including pregnenolone are synthesized from cholesterol, while cholesterol is endocytosed into the cell by LDLR (Go and Mani, 2012). Our results also showed the levels of pregnenolone and LDLR were all decreased in captive-reared S. o’connori.
In conclusion, the present work is the first comparative metabolomic and transcriptomic study of liver and oocyte between the wild and captive-reared S. o’connori. These data provide an overview of the global metabolic and transcriptomic changes in the liver and oocytes during artificial feeding. In oocytes, some DAMs and DEGs were annotated as related to progesterone-mediated oocyte maturation. In the liver, the DAMs and DEGs were significantly enriched in the pathways of biosynthesis of unsaturated fatty acids, starch and sucrose metabolism, and fatty acid biosynthesis, which indicated that these may be considered key metabolic pathways during artificial feeding. These results broaden our understanding of reproductive physiology in captive-reared S. o’connori.
Acknowledgments
We thank Personal Biotechnology Co., Ltd. Shanghai, China for providing the sequencing service.
Data Availability Statement
The data presented in this study are available on request from the corresponding author. The raw sequence files were deposited to the National Center for Biotechnology Information Sequence Read Archive with accession number SRP300881.
Ethics Statement
The animal study was reviewed and approved by College of Animal Science and Technology of Henan Agricultural University. Written informed consent was obtained from the owners for the participation of their animals in this study.
Author Contributions
Conceptualization: JZ, ML, and GS; Formal analysis: JZ; Funding acquisition: ML and GS; Methodology: ZL; Project administration: JZ, WW, ZL, and CZ; Resources: WW and CZ; Software: ZW and SS; Supervision: GS; Visualization: ZW and BZ; Writing—original draft: JZ; Writing—review and editing: ML and GS.
Funding
This work was supported by the Special Fund for Agro-Scientific Research in the Public Interest of China (Grant Number: 201403012) and the Natural Science Fund of Tibet of China (Grant Number: XZ2019ZRG-103).
Conflict of Interest
The authors declare that the research was conducted in the absence of any commercial or financial relationships that could be construed as a potential conflict of interest.
Publisher’s Note
All claims expressed in this article are solely those of the authors and do not necessarily represent those of their affiliated organizations, or those of the publisher, the editors and the reviewers. Any product that may be evaluated in this article, or claim that may be made by its manufacturer, is not guaranteed or endorsed by the publisher.
Supplementary Material
The Supplementary Material for this article can be found online at: https://www.frontiersin.org/articles/10.3389/fgene.2021.677066/full#supplementary-material
Differentially accumulated metabolites.
KEGG analysis of differentially accumulated metabolites.
Differentially expressed genes.
GO and KEGG analyses of differentially expressed genes between LD and LW.
Primers used for qRT-PCR analysis.
Metabolite-gene pairs.
References
- Abunnaja M. S., Alherz F. A., El Daibani A. A., Bairam A. F., Rasool M. I., Gohal S. A., et al. (2018). Effects of genetic polymorphisms on the sulfation of dehydroepiandrosterone and pregnenolone by human cytosolic sulfotransferase SULT2A1. Biochem. Cel Biol. 96 (5), 655–662. 10.1139/bcb-2017-0341 [DOI] [PubMed] [Google Scholar]
- Chen Y., Chen Y., Shi C., Huang Z., Zhang Y., Li S., et al. (2018). SOAPnuke: a MapReduce acceleration-supported software for integrated quality control and preprocessing of high-throughput sequencing data. Gigascience 7 (1), 1–6. 10.1093/gigascience/gix120 [DOI] [PMC free article] [PubMed] [Google Scholar]
- Conesa A., Götz S., García-Gómez J. M., Terol J., Talón M., Robles M. (2005). Blast2GO: a universal tool for annotation, visualization and analysis in functional genomics research. Bioinformatics 21 (18), 3674–3676. 10.1093/bioinformatics/bti610 [DOI] [PubMed] [Google Scholar]
- Feldman A. T., Wolfe D. (2014). “Tissue Processing and Hematoxylin and Eosin Staining,” in Histopathology: Methods and Protocols. Editor Day C. E. (New York, NY: Springer New York; ), 31–43. 10.1007/978-1-4939-1050-2_3 [DOI] [PubMed] [Google Scholar]
- Go G. W., Mani A. (2012). Low-density lipoprotein receptor (LDLR) family orchestrates cholesterol homeostasis. Yale J. Biol. Med. 85 (1), 19–28. [PMC free article] [PubMed] [Google Scholar]
- Guo X.-Z., Zhang G.-R., Wei K.-J., Yan R.-J., Ji W., Yang R.-B., et al. (2016). Phylogeography and population genetics of Schizothorax o'connori: strong subdivision in the Yarlung Tsangpo River inferred from mtDNA and microsatellite markers. Sci. Rep. 6, 29821. 10.1038/srep29821 [DOI] [PMC free article] [PubMed] [Google Scholar]
- Guzmán J. M., Norberg B., Ramos J., Mylonas C. C., Mañanós E. L. (2008). Vitellogenin, steroid plasma levels and spawning performance of cultured female Senegalese sole (Solea senegalensis). Gen. Comp. Endocrinol. 156 (2), 285–297. 10.1016/j.ygcen.2008.02.002 [DOI] [PubMed] [Google Scholar]
- Hammond G. L. (2011). Diverse roles for sex hormone-binding globulin in reproduction. Biol. Reprod. 85 (3), 431–441. 10.1095/biolreprod.111.092593 [DOI] [PMC free article] [PubMed] [Google Scholar]
- Harel M., Tandler A., Kissil G. W., Applebaum S. W. (1994). The kinetics of nutrient incorporation into body tissues of gilthead seabream (Sparus aurata) females and the subsequent effects on egg composition and egg quality. Br. J. Nutr. 72 (1), 45–58. 10.1079/bjn19940008 [DOI] [PubMed] [Google Scholar]
- Izquierdo M. S., Fernández-Palacios H., Tacon A. G. J. (2001). Effect of broodstock nutrition on reproductive performance of fish. Aquaculture 197(1), 25–42. 10.1016/S0044-8486(01)00581-6 [DOI] [Google Scholar]
- Ji Y., Moon I., Zlatkovic J., Salavaggione O. E., Thomae B. A., Eckloff B. W., et al. (2007). Human hydroxysteroid sulfotransferase SULT2B1 pharmacogenomics: gene sequence variation and functional genomics. J. Pharmacol. Exp. Ther. 322 (2), 529–540. 10.1124/jpet.107.122895 [DOI] [PubMed] [Google Scholar]
- Jing X., Cong X., Jian S., Hui-juan Z., Xue-Feng Y., Dawa G., et al. (2011). Embryonic and larval development of Oxygymnocypris stewartii in the Yarlungzangbo River. J. Hydroecology 32 (02), 86–95. [Google Scholar]
- Langmead B., Salzberg S. L. (2012). Fast gapped-read alignment with Bowtie 2. Nat. Methods 9 (4), 357–359. 10.1038/nmeth.1923 [DOI] [PMC free article] [PubMed] [Google Scholar]
- Li B., Dewey C. N. (2011). RSEM: accurate transcript quantification from RNA-Seq data with or without a reference genome. BMC Bioinformatics 12, 323. 10.1186/1471-2105-12-323 [DOI] [PMC free article] [PubMed] [Google Scholar]
- Li H.-Y., Lu Y., Zheng J.-W., Yang W.-D., Liu J.-S. (2014). Biochemical and genetic engineering of diatoms for polyunsaturated fatty acid biosynthesis. Mar. Drugs 12 (1), 153–166. 10.3390/md12010153 [DOI] [PMC free article] [PubMed] [Google Scholar]
- Love M. I., Huber W., Anders S. (2014). Moderated estimation of fold change and dispersion for RNA-seq data with DESeq2. Genome Biol. 15 (12), 550. 10.1186/s13059-014-0550-8 [DOI] [PMC free article] [PubMed] [Google Scholar]
- Ma B., Wang S., Shao J., Li D., Xie C., Liu X., et al. (2020). Population resources and fishery conversation policies of Schizothorax oconnori in the Yarlung Zangbo River. J. Fish. Sci. China 27 (01), 106–118. [Google Scholar]
- Matsuyama M., Shiraishi T., Sundaray J. K., Rahman M., Ohta K., Yamaguchi A. (2005). Steroidogenesis in ovarian follicles of chub mackerel, Scomber japonicus. Zoolog. Sci. 22 (1), 101–110. 10.2108/zsj.22.101 [DOI] [PubMed] [Google Scholar]
- Miller J. G., Behrman H. R. (1986). Oocyte maturation is inhibited by adenosine in the presence of follicle- stimulating hormone. Biol. Reprod. 35 (4), 833–837. 10.1095/biolreprod35.4.833 [DOI] [PubMed] [Google Scholar]
- Modig C., Westerlund L., Olsson P.-E. (2007). “Oocyte zona pellucida proteins,” in The Fish Oocyte: From Basic Studies to Biotechnological Applications. Editors Babin P. J., Cerdà J., Lubzens E. (Dordrecht: Springer Netherlands; ), 113–139. 10.1007/978-1-4020-6235-3_5 [DOI] [Google Scholar]
- Mukherjee D., Guha D., Kumar V., Chakrabarty S. (1991). Impairment of steroidogenesis and reproduction in sexually mature Cyprinus carpio by phenol sulfide under laboratory conditions. Aquat. Toxicol. 21(1), 29–39. 10.1016/0166-445X(91)90004-S [DOI] [Google Scholar]
- Mylonas C. C., Fostier A., Zanuy S. (2010). Broodstock management and hormonal manipulations of fish reproduction. Gen. Comp. Endocrinol. 165 (3), 516–534. 10.1016/j.ygcen.2009.03.007 [DOI] [PubMed] [Google Scholar]
- Nagler J. J., Cavileer T. D., Verducci J. S., Schultz I. R., Hook S. E., Hayton W. L. (2012). Estrogen receptor mRNA expression patterns in the liver and ovary of female rainbow trout over a complete reproductive cycle. Gen. Comp. Endocrinol. 178 (3), 556–561. 10.1016/j.ygcen.2012.06.010 [DOI] [PMC free article] [PubMed] [Google Scholar]
- Ngoh S. Y., Tan D., Shen X., Kathiresan P., Jiang J., Liew W. C., et al. (2015). Nutrigenomic and Nutritional Analyses Reveal the Effects of Pelleted Feeds on Asian Seabass (Lates calcarifer). PLoS One 10 (12), e0145456. 10.1371/journal.pone.0145456 [DOI] [PMC free article] [PubMed] [Google Scholar]
- Norberg B., Kleppe L., Andersson E., Thorsen A., Rosenlund G., Hamre K. (2017). Effects of dietary arachidonic acid on the reproductive physiology of female Atlantic cod (Gadus morhua L.). Gen. Comp. Endocrinol. 250, 21–35. 10.1016/j.ygcen.2017.05.020 [DOI] [PubMed] [Google Scholar]
- Petersen L. H., Hala D., Carty D., Cantu M., Martinović D., Huggett D. B. (2015). Effects of progesterone and norethindrone on female fathead minnow (Pimephales promelas) steroidogenesis. Environ. Toxicol. Chem. 34 (2), 379–390. 10.1002/etc.2816 [DOI] [PubMed] [Google Scholar]
- Purohit A., Woo L. W. L., Potter B. V. L. (2011). Steroid sulfatase: a pivotal player in estrogen synthesis and metabolism. Mol. Cell Endocrinol. 340 (2), 154–160. 10.1016/j.mce.2011.06.012 [DOI] [PubMed] [Google Scholar]
- Qi D., Chao Y., Guo S., Zhao L., Li T., Wei F., et al. (2012). Convergent, parallel and correlated evolution of trophic morphologies in the subfamily schizothoracinae from the Qinghai-Tibetan plateau. PLoS One 7 (3), e34070. 10.1371/journal.pone.0034070 [DOI] [PMC free article] [PubMed] [Google Scholar]
- Qiao Q., Djediat C., Huet H., Duval C., Le Manach S., Bernard C., et al. (2019). Subcellular localization of microcystin in the liver and the gonads of medaka fish acutely exposed to microcystin-LR. Toxicon 159, 14–21. 10.1016/j.toxicon.2018.12.006 [DOI] [PubMed] [Google Scholar]
- Rodríguez-Barreto D., Jerez S., Cejas J. R., Martin M. V., Acosta N. G., Bolaños A., et al. (2014). Ovary and egg fatty acid composition of greater amberjack broodstock (Seriola dumerili) fed different dietary fatty acids profiles. Eur. J. Lipid Sci. Technol. 116(5), 584–595. 10.1002/ejlt.201300462 [DOI] [Google Scholar]
- Schreck C. B., Contreras-Sanchez W., Fitzpatrick M. S. (2001). Effects of stress on fish reproduction, gamete quality, and progeny☆☆Oregon Agricultural Experiment Station Technical Report Number 11578. Aquaculture 197(1), 3–24. 10.1016/S0044-8486(01)00580-4 [DOI] [Google Scholar]
- Shang G., Peng X., Ji C., Zhai G., Ruan Y., Lou Q., et al. (2019). Steroidogenic acute regulatory protein and luteinizing hormone are required for normal ovarian steroidogenesis and oocyte maturation in zebrafish†. Biol. Reprod. 101 (4), 760–770. 10.1093/biolre/ioz132 [DOI] [PubMed] [Google Scholar]
- Shirai N., Suzuki H., Toukairin S., Wada S. (2001). Spawning and season affect lipid content and fatty acid composition of ovary and liver in Japanese catfish (Silurus asotus). Comp. Biochem. Physiol. B: Biochem. Mol. Biol. 129 (1), 185–195. 10.1016/s1096-4959(01)00378-5 [DOI] [PubMed] [Google Scholar]
- Tiwari A., Melchor-Martínez E. M., Saxena A., Kapoor N., Singh K. J., Saldarriaga-Hernández S., et al. (2021). Therapeutic attributes and applied aspects of biological macromolecules (polypeptides, fucoxanthin, sterols, fatty acids, polysaccharides, and polyphenols) from diatoms - A review. Int. J. Biol. Macromolecules 171, 398–413. 10.1016/j.ijbiomac.2020.12.219 [DOI] [PubMed] [Google Scholar]
- Tocher D. R. (2010). Fatty acid requirements in ontogeny of marine and freshwater fish. Aquac. Res. 41(5), 717–732. 10.1111/j.1365-2109.2008.02150.x [DOI] [Google Scholar]
- Tocher D. R. (2003). Metabolism and Functions of Lipids and Fatty Acids in Teleost Fish. Rev. Fish. Sci. 11 (2), 107–184. 10.1080/713610925 [DOI] [Google Scholar]
- Vallée M. (2016). Neurosteroids and potential therapeutics: Focus on pregnenolone. J. Steroid Biochem. Mol. Biol. 160, 78–87. 10.1016/j.jsbmb.2015.09.030 [DOI] [PubMed] [Google Scholar]
- Xiao S., Mou Z., Fan D., Zhou H., Zou M., Zou Y., et al. (2020). Genome of Tetraploid Fish Schizothorax o'connori Provides Insights into Early Re-diploidization and High-Altitude Adaptation. iScience 23 (9), 101497. 10.1016/j.isci.2020.101497 [DOI] [PMC free article] [PubMed] [Google Scholar]
- Xie C., Huo B., Wei K. (1994). Biology and Resource Conservation of Shizothoracinae Fishes in the Middle Reaches of the Yarlung Zangbo River. Beijing, China: Science Press. (Chinese). [Google Scholar]
- Xu G., Du F., Li Y., Nie Z., Xu P. (2016). Integrated application of transcriptomics and metabolomics yields insights into population-asynchronous ovary development in Coilia nasus. Sci. Rep. 6, 31835. 10.1038/srep31835 [DOI] [PMC free article] [PubMed] [Google Scholar]
- Zhang L. (2011). Study on the large scale artificial propagation of Schizothorax o’connori. Freshw. Fish. 41 (05), 88–91. [Google Scholar]
- Zupa R., Rodríguez C., Mylonas C. C., Rosenfeld H., Fakriadis I., Papadaki M., et al. (2017). Comparative Study of Reproductive Development in Wild and Captive-Reared Greater Amberjack Seriola dumerili (Risso, 1810). PLoS One 12 (1), e0169645. 10.1371/journal.pone.0169645 [DOI] [PMC free article] [PubMed] [Google Scholar]
Associated Data
This section collects any data citations, data availability statements, or supplementary materials included in this article.
Supplementary Materials
Differentially accumulated metabolites.
KEGG analysis of differentially accumulated metabolites.
Differentially expressed genes.
GO and KEGG analyses of differentially expressed genes between LD and LW.
Primers used for qRT-PCR analysis.
Metabolite-gene pairs.
Data Availability Statement
The data presented in this study are available on request from the corresponding author. The raw sequence files were deposited to the National Center for Biotechnology Information Sequence Read Archive with accession number SRP300881.


