

Abstract

Though copper is a capable electrocatalyst for the CO2 reduction reaction (CO2RR), it rapidly deactivates to produce mostly hydrogen. A current hypothesis as to why this occurs is that potential-induced morphological restructuring takes place, leading to a redistribution of the facets at the interface resulting in a shift in the catalytic activity to favor the hydrogen evolution reaction over CO2RR. Here, we investigate the veracity of this hypothesis by studying the changes in the voltammetry of various copper surfaces, specifically the three principal orientations and a polycrystalline surface, after being subjected to strongly cathodic conditions. The basal planes were chosen as model catalysts, while polycrystalline copper was included as a means of investigating the overall behavior of defect-rich facets with many low coordination steps and kink sites. We found that all surfaces exhibited (perhaps surprisingly) high stability when subjected to strongly cathodic potentials in a concentrated alkaline electrolyte (10 M NaOH). Proof for morphological stability under CO2RR-representative conditions (60 min at −0.75 V in 0.5 M KHCO3) was obtained from identical location scanning electron microscopy, where the mesoscopic morphology for a nanoparticle-covered copper surface was found unchanged to within the instrument accuracy. Observed changes in voltammetry under such conditions, we found, were not indicative of a redistribution of surface sites but of electrode fouling. Besides impurities, we show that (brief) exposure to oxygen or oxidizing conditions (i.e., 1 min) leads to copper exhibiting changing morphology upon cathodic treatment which, we posit, is ultimately the reason why many groups report the evolution of copper morphology during CO2RR: accidental oxidation/reduction cycles.
Keywords: copper, Cu, CO2RR, morphology, single crystal, Cu(111), Cu(100), Cu(110), reduction, CO2, stability, cathodic corrosion
Introduction
From an electrochemical perspective, the CO2 reduction reaction (CO2RR) is a potentially lucrative pathway for the valorization of a harmful waste product: CO2. Although catalyst selectivity and activity for this reaction are currently unfit for industrial application, many different types of functionalized carbon-containing products can be obtained via direct CO2 reduction on, for example, copper electrodes, where >2 electron products are of particular interest. However, besides having suboptimal selectivity and activity,1−5 copper is also prone to deactivation during CO2RR.6,7 There are various theories as to the source for this deactivation, ranging from electrode fouling by reaction products (e.g., graphitic carbon8) and solution impurities,6,7 to oxidation- and reduction-driven surface restructuring due to strain resulting from mismatching lattice parameters,9 to evolution of surface morphology due to dissolution of surface oxides,10,11 to cathodic corrosion (CC)12,13 and potential-induced surface restructuring,12,14−17 to dissolved copper species playing an active role in the catalytic process.18
Of these theories, changing surface morphology under purely cathodic CO2RR conditions12,14,16,17,19−21 has been gaining popularity. In this case, changes in the distribution of surface sites would be responsible for variability of the product spectrum. Experimental reports of platinum,13,22,23 rhodium,24,25 and gold24,26 surfaces undergoing massive restructuring at sufficient cathodic potentials through a process called CC provide credibility to this theory. Such restructuring during CC has been hypothesized to result from cathodic dissolution mediated by the formation of (ternary) metal hydrides.25 Given that CO2RR and carbon monoxide reduction (CORR) usually take place under conditions at which CC may occur (i.e., strongly negative potential, high local alkalinity, and high cation concentrations), CC could be a relevant deactivation mechanism for copper electrodes.
In this work, we investigate the (in-)stability of various different copper facets under strongly cathodically corrosive conditions by investigating the evolution in cyclic voltammetry (CV) after cathodization in a concentrated alkali electrolyte to determine if CC can explain the reported morphology changes of copper under cathodic (CO2RR) conditions. We compare those results with those of scanning electron microscopy (SEM) experiments conducted on a nanostructured surface prior to and after running CO2RR to provide relevance to the CO2RR community. Importantly, all experiments were carried out such that accidental surface oxidation was minimized. Both CV and SEM evidence reported herein indicate that copper is actually stable under purely reducing conditions, and we show that morphological changes as reported in literature12,14,16,17,19−21 are likely related to accidental oxidation/reduction cycles, as opposed to being the result of CC during CO2RR conditions.
Results and Discussion
Cathodic Surface Stability from CV Studies
To study if copper undergoes cathodic restructuring, experiments were conducted under literature-reported conditions that maximize the chance of cathodically induced morphological changes occurring—high alkalinity, high cation concentration, and strongly negative potentials.13,22−25 Stability studies were conducted in 10 M NaOH at the maximum cathodic potential that could be applied by our potentiostat with 85% iR correction turned on, being −1.75 V versus reversible hydrogen electrode (RHE). Furthermore, our experimental setup was carefully constructed such that it allowed us to fully prevent surface oxidation unless deliberately induced via electrochemical means. Experiments were performed in the absence and presence of surface oxides to determine the effect of oxidation on the apparent cathodic stability of copper. Where applicable, pre-oxidation was done at +0.50 V, considering that this potential is only a few millivolts positive of the open circuit potential (OCV) for copper in our electrochemical environment. Corrosion times (cathodic and anodic) were set at 1 min, so as to minimize any possible influences of contaminants and to prevent electrolyte heating from influencing the results. Boundaries for blank cyclic voltammograms for the mono- and multi-faceted copper surfaces in a hydroxide electrolyte were set to match with those reported in previous experimental literature, where lower (more cathodic) potential boundaries during blank measurements were avoided as surface restructuring and/or CV instability and decreased feature reversibility have been reported for the {111}27 and {100}15 faces, and (from our personal experience) the same also being true for the {110} face.28 Experiments for longer time periods, at different cathodic potentials, and under different electrolyte conditions are described in the second half of this work.
Characterization cyclic voltammograms (0.1 M NaOH) obtained after cathodization in both the absence (Figure 1) and presence (Figure 2) of surface oxides are compared to their initial characterization cyclic voltammograms (blank cyclic voltammograms), to study the cathodic stability of metallic copper and how the presence of a native oxide layer influences this stability. Reference inaccuracies resulted in upper potential limits varying by ca. 3 mV, which actually influences the results slightly, considering the upper potential we employ in this work is right at the onset of bulk copper oxidation. Therefore, depending on the exact situation, we may forego discussing changes in the negative going scan, especially if those differences are located close to the upper potential limit of the cyclic voltammogram. Considering that all surfaces exhibit comparable behavior under purely cathodic conditions, we shall discuss the results of cathodic-only experiments (1 min at −1.75 V in 10 M NaOH) first, depicted in Figure 1, where the initial blank cyclic voltammogram for the various surfaces is shown in black and that obtained after cathodization in red.
Figure 1.
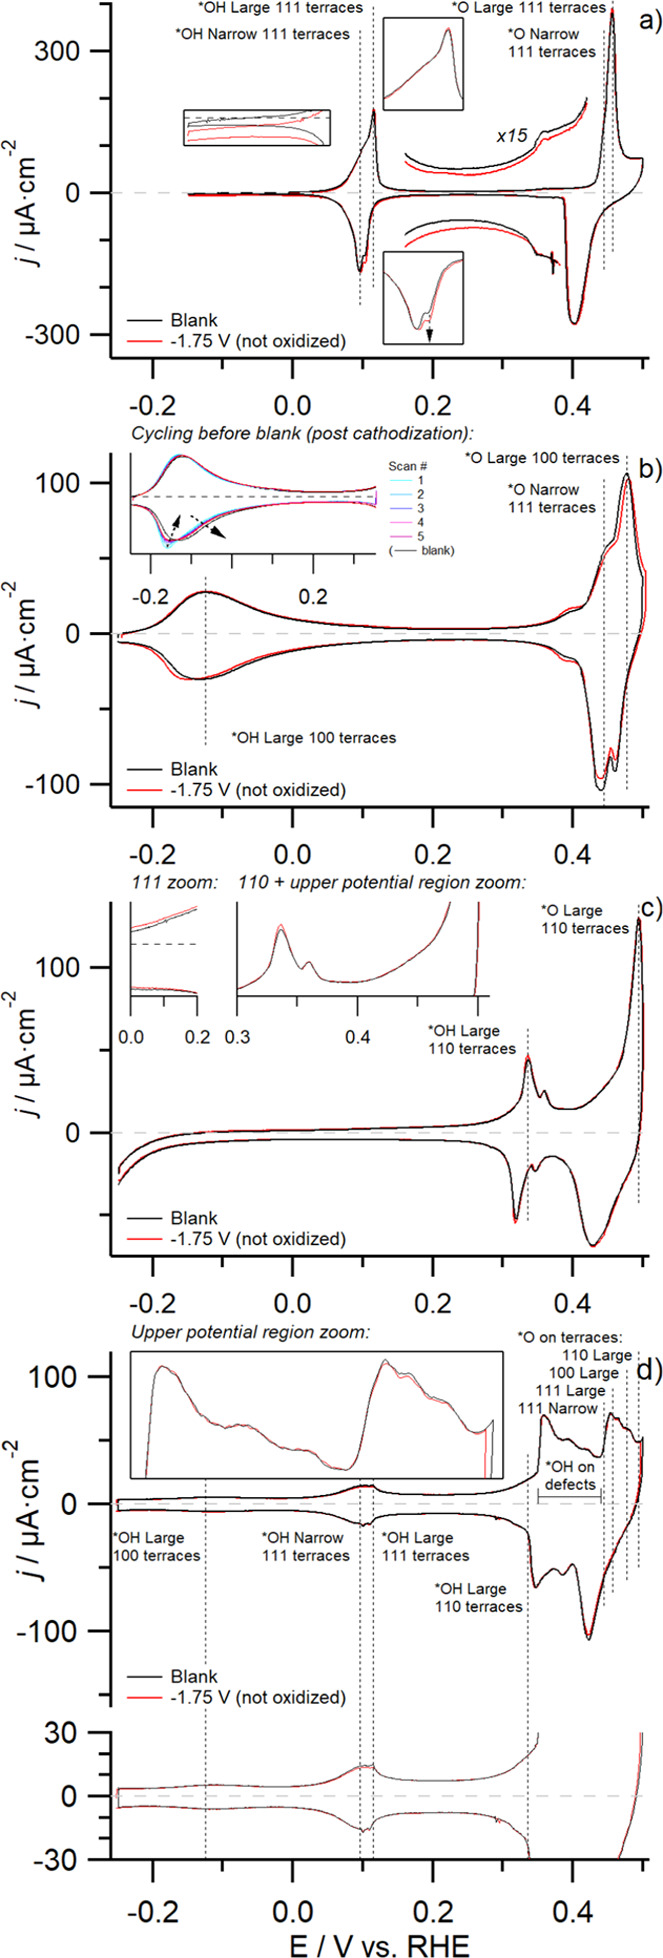
Effect of applying a cathodization period on the characterization cyclic voltammogram (0.1 M NaOH, ν = 50 mV s–1) of copper surfaces of various orientations devoid of initial surface oxides. (a–d) Voltammograms obtained prior to (black) and after (red) a cathodization period (1 min at −1.75 V, 85% iR-corrected) in 10 M NaOH for the (a) Cu(111), (b) Cu(100), (c) Cu(110), and (d) Cu(poly) surfaces.
Figure 2.

Effect of applying a pre-oxidation period followed by a cathodization period on the characterization cyclic voltammogram (0.1 M NaOH, ν = 50 mV s–1) of copper surfaces of various orientations devoid of initial surface oxides. (a–d) Voltammograms obtained prior to (black) and after (red) a pre-oxidation period (1 min at +0.50 V, 85% iR-corrected) followed by a cathodization period (1 min at −1.75 V, 85% iR-corrected) in 10 M NaOH for the (a) Cu(111), (b) Cu(100), (c) Cu(110), and (d) Cu(poly) surfaces. More positive oxidation potentials were also investigated for the Cu(110) (+0.55 V only) and Cu(poly) electrodes, which are depicted in orange, blue, and cyan for 1 min of oxidation at +0.55, +0.65, and +0.70 V, respectively.
The cyclic voltammogram of a Cu(111) surface after 1 min of cathodization is depicted in Figure 1a. Various insets depicting magnifications of the double layer regions and the main OH-adsorption feature are included for clarity. We find that the cyclic voltammograms before (black) and after (red) cathodization are strikingly similar if we ignore a minor cathodic offset of the cyclic voltammogram between −0.15 V < E < +0.30 V as that can be attributed to trace amounts of oxygen in the electrolyte (not actually influencing the cyclic voltammogram shape, only resulting in a cathodic offset). Such an offset (on the order of several hundreds of nanoamperes of absolute current) resulting from trace amounts of oxygen in the system was only present for this particular data point and was found to be sufficiently minor to not significantly influence the results considering that the cyclic voltammogram remains virtually static. Only one difference is observed for the Cu(111) characterization cyclic voltammogram post-cathodization, namely, the twinned cathodic OH-adsorption feature for the {111}-terraces at +0.1 V, showing a minute increase in charge for the more positively located peak (denoted by an arrow in the inset), though this effect is virtually absent in the anodic feature. In our previous work,28 we hypothesize that the split nature of the {111}-specific OH-adsorption feature is a function of the terrace length, with a broader adsorption feature located at more negative potentials being related to relatively smaller terraces and a sharp feature located at slightly more positive potentials being related to (very) large terraces. If the narrower {111}-specific feature indeed relates to larger terraces, as we propose, then the cyclic voltammogram we obtain after applying cathodic potentials denotes an increase in the number of such larger terraces. This minor increase in surface crystallinity is very likely a result of the fact that we reanneal the surface prior to conducting cathodization experiments, having resulted in a marginally smoother surface. From the (absence of) observed differences, we conclude that the copper {111} facet is stable against purely cathodic conditions.
The same experiment was also conducted on Cu(100) and is depicted in Figure 1b, where the black curve denotes the blank and the red one the cyclic voltammogram after cathodization. An inset depicting the “pre-cycling” phase is included as we found that {100} terraces reconstruct during this period if the surface had been treated cathodically (but not after induction annealing, i.e., before the blank). During this phase (inset Figure 1b), we find that the {100}-specific OH-adsorption feature at −0.125 V is initially fairly asymmetrical but becomes increasingly symmetrical with successive cycling (e.g., going from the blue to the purple cyclic voltammogram) although the initial level of symmetry is never regained, even if the number of cycles during this period is increased (not depicted).
These observations for pre-cycling carry over to the full-window post-cathodization characterization cyclic voltammogram (red), where it can be seen that the cathodic peak at −0.125 V is shifted to slightly more negative potentials, thus resulting in decreased reversibility of the overall feature. Additionally, it can be seen that the reversible defect-related peak located at +0.38 V exhibits increased charge, signifying an increase in defect sites. As a third difference we find that the {100}-specific O-adsorption feature at +0.477 V shifts to slightly more positive potentials while slightly decreasing in maximum intensity, resulting in decreased current in the region +0.42 < E < +0.48 V and increased current for E > +0.48 V. We believe that the positive shifting of this feature signifies a decrease in the average {100} terrace width, which matches with the observed increase in defect density. These minor cyclic voltammogram changes for Cu(100) could possibly be the result of (partially) irreversible potential-induced surface reconstruction at negative potentials. Such cathodic reconstruction of the {100} facet has been reported by Matsushima et al.15 who showed via in situ scanning tunneling microscopy that, under sufficiently negative potentials in 0.1 M HClO4, a fraction of the atoms at the Cu(100) surface form rows that are slightly elevated with respect to the rest of the surface. If this so-called hydrogen-induced reconstruction15 is not fully reversible, it can reasonably explain the minor differences observed in our CV, considering that the CV changes we discuss represent an overall decrease in surface crystallinity. Although we find that the {100} facet is not perfectly stable under cathodic-only conditions, the changes are still relatively minor.
Cyclic voltammograms of a Cu(110) surface before (black) and after (red) cathodic polarization are shown in Figure 1c. Post-cathodization voltammetric behavior similar to that of a Cu(111) surface is observed, that is, mostly an absence of change. One minute difference can be observed by looking at the amount of anodic and cathodic charge associated with the {110}-feature located at ca. +0.33 V, which is found to increase slightly—signifying a small increase in surface crystallinity. This minor increase in crystallinity is not so strange, considering that the methodology we employ for generating a stable {110} surface involves evolving large amounts of hydrogen at very negative potentials, similar to the cathodic treatment we use for the results depicted in this figure. No other deviations are observed and thus we arrive at the same conclusion as for the other two facets: the {110} facet is stable under cathodically corrosive conditions.
Finally, we depict cyclic voltammograms of Cu(poly) in Figure 1d. By their nature, polycrystalline surfaces contain a higher fraction of undercoordinated sites such as step and kink defects. This is evident from the presence (and intensity) of a number of additional features between +0.35 V < E < +0.44 V. Due to the different sizes of crystallites present on the surface, it will also contain a wider gamut of terrace sizes. Hence, experiments on a Cu(poly) electrode can provide additional insights into the cathodic stability of more reactive, and therefore generally assumed more catalytically active, sites. Investigation of the cyclic voltammogram after the experiment (red) shows very little change compared to the initially obtained blank one (black). Scrutinizing closely, small deviations can be seen around +0.1 V and between 0.44 V < E < 0.48 V, which relate to the changes in {111} terrace sites and {100} terrace sites, respectively. The small decrease in OH-adsorption on {111} terraces (+0.1 V) can actually be attributed to the fact that we sweep the potential to E < −0.15 V, which has been reported in literature to result in suppression of the associated anodic feature.27 Taking into consideration that the negative potential limit was slightly more negative after cathodization due to reference inaccuracies, the minor difference at ca. +0.1 V is likely caused by the slight variation in lower CV boundaries. This leaves a diminutive difference in O-adsorption related to {100}-terrace sites (+0.477 V), which is in line with what we discussed previously for Cu(100), namely, that likely some irreversibility is associated with lifting the hydrogen-induced reconstruction of this face. Therefore, we conclude that also a defect-rich Cu(poly) surface is stable under strongly cathodic conditions, with mostly {100} terrace sites being impacted mildly.
A second set of experiments was conducted based on the notion that it is challenging to guarantee oxygen-free, non-oxidizing conditions when utilizing default literature procedures, surface preparation methodologies, and prevalent experimental setups. To this end, a pre-oxidation step (1 min at +0.50 V, close to the OCV of Cu in our system) prior to cathodization was purposely included in a set of control experiments, to compare the cathodic stability of copper in the presence of a native oxide film with our results in the absence of surface oxides. Pre-oxidation investigations at more positive potentials were also investigated for Cu(110) and Cu(poly) surfaces, considering that they exhibited very mild changes at +0.50 V. The results are depicted in Figure 2, where initially obtained blank cyclic voltammograms (black) for the various surfaces under investigation are compared to the characterization cyclic voltammogram obtained after pre-oxidation cathodization experiments in 10 M NaOH (red) where the surface was first pre-oxidized (1 min at +0.50 V), prior to stepping the potential to cathodic potentials (1 min at −1.75 V).
The effect of adding a pre-oxidation step on the cathodic stability of a Cu(111) surface can be determined by comparing the cyclic voltammograms in Figure 1a (in the absence of oxidation) with those in Figure 2a (in the presence of oxidation). To determine this effect, we first have to analyze the CV changes that occur for a surface that has been pre-oxidized before cathodization by comparing the initial cyclic voltammogram (black) to the one obtained after the experiment (red) in Figure 2a. A first difference can be seen at the negative potential limit of the cyclic voltammogram (E < 0 V), where excess cathodic charge is observed after pre-oxidation plus cathodization treatment. Considering that this current is not related to the ORR (its onset being at too negative a potential for that—e.g., compare it to the more positive onset for the ORR-related current in the red trace in Figure 1a) or the reduction of adventitious copper oxides (considering both onset and current remain stable for successive cycles, not depicted), we tentatively attribute it to the hydrogen evolution reaction (HER) instead. Second, we see that the oxidative {111}-terrace peak at +0.1 V shows reduced peak intensity which looks to be associated with increased charge at slightly more positive potentials (ca. +0.105 V). Additionally, a new anodic feature is observed to develop at ca. +0.235 V. Furthermore, we find that the reversible defect-related feature around +0.35 V grows in intensity. None of these effects were observed in the absence of a pre-oxidation treatment. Lastly, we observe increased charge of the more positive peak of the cathodic feature at +0.1 V. This is in agreement with what we observe in the absence of surface oxidation, though in that instance the anodic charge did not decrease.
The increased HER activity of a pre-oxidized and subsequently cathodized Cu(111) surface, combined with the appearance of a new, irreversible anodic feature at +0.235 V and an increase in charge of the feature at +0.35 V all indicate additional defect sites. This is corroborated by the fact that we observe the peak intensity of the {111}-specific OH-adsorption feature at +0.1 V going down while simultaneously seeing an increase in charge in the region located at slightly more positive potentials. We hypothesize that this represents a decrease in the average terrace width, considering that a literature-reported Cu(211) cyclic voltammogram (denoting a 3(111) × (100) surface) exhibits a similar broad charge contribution at potentials positive of +0.1 V.29 We realize that it is peculiar that the increase in oxidative charge at E > +0.1 V that we attribute to small-width {111} terraces is not matched by a similar increase in cathodic charge in the negative-going scan, as is the fact that the suppression of charge of the anodic feature at +0.1 V is (mostly) absent for the cathodic feature. A possible explanation for this would revolve around the irreversible nature of O-adsorption on {111} terrace sites, as evidenced by the asymmetry of the feature at +0.457 V. Possibly, shorter (i.e., defect-rich) terraces are influenced more strongly by oxygen desorption, resulting in reconstruction of these sites in the reverse scan direction. Overall, by comparing the respective cyclic voltammogram changes of Cu(111) when it has been cathodized either in the absence or in the presence of a pre-oxidation step, it is clear that surface oxides negatively impact the stability of {111} terrace sites under cathodic conditions—and thus, by association, are likely to result in changing their morphology.
Next, we study the effect of the presence of surface oxides on the cathodic stability of Cu(100). The characterization cyclic voltammograms of this facet after cathodization in the absence and presence of a pre-oxidation period are shown in Figures 1b and 2b, respectively. Once again, an inset with the pre-cycling cyclic voltammograms is provided in Figure 2b with the initial blank cyclic voltammogram and that recorded after pre-oxidation plus cathodization treatment depicted in black and red in the submain figure, respectively. In line with our initial discussion on this facet, already during the pre-cycling phase surface reconstruction is apparent. Specifically, for the pre-oxidized and subsequently cathodized electrode, we observe the following behavior during this initial phase (inset of Figure 2b). First, similar to a non-oxidized surface, we observe that the feature at −0.125 V starts off asymmetrically but becomes more symmetrical with successive cycling (going from the blue to the purple line), with the cathodic peak shifting to more positive potentials. Again, the initial symmetry of the feature is not fully recovered. In contrast with cathodic-only treatment, a number of additional changes are observed during this pre-cycling period in the case of pre-oxidation. Aside from the cathodic peak at ca. −0.125 V shifting, the oxidative peak is actually observed to shift slightly as well. Furthermore, the total charge of the {100} adsorption feature is observed to diminish. Additionally, an anodic shoulder grows in at ca. +0.075 V, relatively close to where one would expect {111} terraces to contribute the charge (+0.1 V) although no associated cathodic peak is observed. Finally, the HER activity at negative potentials (E < −0.2 V) increases with successive cycling.
All of these effects carry over when we compare the full-window characterization cyclic voltammogram (red) with the initial blank cyclic voltammogram (black): excess cathodic charge is observed for E < −0.2 V, the {100} adsorption feature at −0.125 V is overall less symmetrical and exhibits suppressed charge, and an oxidative “bump” near +0.075 V is visible. The suppression of the overall charge of the OH-adsorption feature was not observed in the case of a cathodic-only treated Cu(100) crystal (Figure 1b) nor the formation of a feature near +0.075 V. Additional observed changes for the full-window cyclic voltammogram are that more crystal defects are present, as indicated by increases in charge for both the step-related feature at ca. +0.38 V and the {111}-terraces related shoulder near +0.445 V. Increases in the number of step sites were also observed without surface oxidation but increases in {111} terrace sites were not. Finally, the {100} O-adsorption feature (+0.477 V) is observed to both decrease in intensity and shift toward more positive potentials. This agrees with what we observed in the absence of surface oxidation but is more pronounced after pre-oxidation.
From the combination of increased HER activity, the appearance of a new feature at +0.075 V, an increase in the charge of the reversible defect-related feature near +0.38 V, and the growth of the shoulder at ca. +0.445 V (likely related to the formation of small {111} terrace sites28), it is clear that additional defects are being formed on the surface. Similar to the previous discussion this is corroborated by the loss of symmetry and decrease in intensity of the {100}-related feature near −0.125 V, for which we know from a literature-reported Cu(911) cyclic voltammogram (denoting a 5(100) × (111) surface)30 that the OH-feature for shorter {100} terraces is located at more negative potentials. We also observe the {100}-specific O-adsorption feature at +0.475 V to shift to more positive potentials (making it overall less reversible) and decrease in intensity, both of which can be similarly interpreted as the behavior observed for the main OH-adsorption feature at −0.125 V: a decrease in surface crystallinity. Considering that these changes are more numerous and more pronounced than for the cathodic-only experiment, it is clear that the presence of surface oxides results in decreased stability of {100} terrace sites and thus increases the likelihood of morphological evolution taking place.
Next, we investigate the effect of pre-oxidation on the cathodic stability of Cu(110), with Figures 1c and 2c showing the cyclic voltammograms obtained before (black) after (red) cathodization in the absence and presence of a pre-oxidation period at +0.50 V, respectively. Due to the very small differences observed for a pre-oxidation potential of +0.50 V, an additional experiment was conducted at +0.55 V (orange). When carefully scrutinized, both samples exhibit the same CV changes, but we will discuss the latter since the changes are more prominent. When comparing the orange trace to the initial blank (black), we observe the following. First, we find increased HER activity at potentials E < −0.1 V. Second, a reversible feature near +0.1 V develops, being a clear indication of the formation of {111}-terrace sites. Third, the amount of charge of the {110}-specific OH-adsorption feature at +0.33 V is found to increase slightly, similar to the non-oxidized sample. However, we see an additional change for this feature, being a shift to slightly more negative potentials. Further differences are observed in the form of increased charge for the symmetrical, defect-related feature at ca. +0.35 V, which is additionally observed to also shift to slightly more negative potentials. Finally, we observe increased charge in the potential range 0.375 V < E < 0.46 V, where both defect sites and {111} terraces exhibit adsorption behavior.
Compared to Cu(111) and Cu(100), Cu(110) exhibits less prominent changes when pre-oxidized, necessitating an increase in the oxidation potential from +0.50 to +0.55 V to observe changes of similar magnitude as seen for pre-oxidized {111} and {100} surfaces. However, the overall conclusion after comparison of CV behavior in the absence and presence of surface oxides is in agreement with previously discussed faces: oxidation negatively impacts the cathodic stability of Cu(110).
Lastly, we also investigated the behavior of a Cu(poly) electrode, depicted in Figures 1d and 2d, for cathodization in the absence and presence of pre-oxidation, respectively. Considering such a surface is easily remade if irreversible surface damage is observed, a wider range of pre-oxidation potentials was investigated. Specifically, depicted in Figure 2d in red, orange, blue, and cyan are +0.50, +0.55, +0.65, and +0.70 V respectively, (with +0.60 V falling in-between +0.55 and +0.65 V, not depicted). At the bottom of the figure, a narrower current range is provided, giving a clearer view of the changes in the region between −0.25 V < E < +0.35 V. Considering that the voltammetric behavior we observe is (almost) identical up to a pre-oxidation potential of +0.65 V (blue), we shall discuss that particular data point.
Similar to the principal faces, we find that a pre-oxidized and subsequently cathodized polycrystalline copper surface exhibits increased HER activity at E < −0.1 V. This increase is likely related to an increase in defect density, although it may also signify an increase in the number of {110} terrace sites or a combination of the two. Due to the increased HER current, it becomes difficult to ascertain if the {100} OH-adsorption feature at −0.125 V changes or not because of convolution effects. However, clear changes are observed for OH-adsorption on {111} terraces, with the anodic peak at +0.1 V exhibiting decreased current density, although this is not reflected in a decrease of the associated cathodic peak (which stays equal for +0.50 and +0.55 V and conversely increases in the case of +0.65 V). Concomitant with the decrease of the anodic peak at +0.1 V, an increase in anodic (but not cathodic) charge is observed in the potential window that directly follows between ca. +0.1 V < E < +0.3 V. Similar behavior was observed for Cu(111), where we hypothesized it represents a decrease in the average terrace width, while the mismatch between anodic and cathodic charge trends is possibly related to the irreversibility of oxygen adsorption resulting in reconstruction of the (defect-rich) terraces.
Increased charge at +0.33 V is also observed, signifying that additional {110} terraces are present. Then, between +0.35 V < E < +0.44 (where OH adsorbs on defects), we find increased charge centered around +0.356 V, while the rest of the window remains equal (+0.42 V < E < +0.44 V) or decreases in charge (+0.37 V < E < +0.42 V). Taken together, this represents anisotropic surface restructuring with some types of defects increasing and other types of defect sites decreasing in abundance. In the upper potential region of the cyclic voltammogram (*O region, E ≥ +0.44 V), we see the following. Between +0.44 V < E < +0.458 V (O-adsorption on {111} terraces), a small decrease in charge is observed for pre-oxidation at +0.50 and +0.55 V. However, from +0.65 V onward, the charge starts increasing. The initial decrease can readily be explained by anisotropic effects, with the (originally fully reduced) {111} terrace sites being lost as they interconvert into other types of sites when oxidized and subsequently reduced. However, as a reversal in behavior is observed with the peak charge increasing for E ≥ +0.65 V, a secondary process operating in parallel with the first mechanism must exist via which new terrace sites form. Likely, this additional pathway has to do with the creation of pits in the surface through dissolution and/or the formation of deposits through electroplating of (in operando-generated) Cu ions. The last section of the cyclic voltammogram (E > +0.458 V) exhibits a monotonous increase in charge as a function of pre-oxidation potential, representing increases in the number of both {100} and {110} terrace sites.
Clearly, oxidation and the subsequent reduction of copper are anisotropic, with some types of defect and terrace sites decreasing and other types of defect and terrace sites increasing, representing their interconversion. However, as the pre-oxidation potential is increased, the initial stages of surface roughening can be observed, as evidenced by the reversal of the behavior of O-adsorption on {111} terraces (decreasing to increasing as the oxidation potential is increased). This roughening of the surface becomes more pronounced as the pre-oxidation potential is increased to +0.70 V (Figure 2d, cyan), with the entirety of the cyclic voltammogram exhibiting increased current density. This represents an increase in the number of every type of site, which can only be valid if the overall surface area is increasing (i.e., roughening of the surface). Such roughening (i.e., changing morphology) can be explained if we either start forming pits in the surface via dissolution10 and/or start forming particles atop the surface (e.g., due to redeposition phenomena). Roughening of copper in the absence and presence of a pre-oxidation period is further investigated in the following section, where we use SEM to investigate various locations on a spherical single crystal.
Microscopy Study of Surface Roughening in the Absence and Presence of Copper Oxides
So far, we employed CV studies to investigate the (absence of) change in surface morphology of various copper substrates under purely cathodic conditions. Supporting evidence for the voltammetric behavior observed in the presence and absence of a pre-oxidation period is provided in the form of (near) identical location SEM imaging. For this study, a spherical single crystal was used as a model catalyst considering that it allows for comparison of substrates of (initially) comparable crystallographic orientation. The exact procedure is as follows. First, a single crystal was pre-oxidized in 10 M NaOH at +0.70 V for 1 min prior to being cathodized at −1.75 V for 1 min (equal electrochemical treatment to the cyan trace in Figure 2d), whereafter it was rinsed, dried under a H2 atmosphere, and moved to the scanning electron microscope for investigating the morphology. Exact imaging locations were documented to allow for re-visiting them later on. Then, the crystal was (mostly) recovered to its initial state by flame annealing it in a H2/O2 flame for ca. 30 min near the melting point of copper (at ca. 900 °C, CV reproducibility is depicted in Figure S1). Next, a cathodic-only experiment was conducted by applying −1.75 V for 5 min in 10 M NaOH, where the experiment duration was intentionally increased 5-fold (from 1 to 5 min) as preliminary results indicated no discernible roughening after 1 min of cathodization (not depicted). After rinsing and drying, the crystal was then moved to the scanning electron microscope and manually positioned to match as best as possible its orientation during the previous experiment based on the visible (static) locations of the {100} and {111} planes. Then, previously investigated locations were revisited and imaged again. As the orientation of the crystal in the scanning electron microscope chamber was manually adjusted between experiments, the angle of incidence of the electron beam with respect to the surface normal was not exactly equal between corresponding sets of images nor was the beam necessarily always exactly perpendicular to the surface. Furthermore, slight mismatches in the incidence angle between corresponding sets of images are exacerbated by the fact that the surface has a curvature in all directions, considering that the study was conducted on a spherical single crystal. The micrographs obtained for both conditions are depicted in Figure 3 in the form of numbered pairs (e.g., 1 and 1), for which we estimate that the respective sets of images between the different experiments were located within <100 μm of each other on the surface (yielding comparable initial substrates).
Figure 3.

Comparison of close-proximity location SEM images for an identical spherical single crystal that was either subjected to a cathodic-only period (−1.75 V for 5 min) or first pre-oxidized (+0.7 V for 1 min) before applying a cathodic period (−1.75 V for 1 min) in 10 M NaOH. Overview images for the pre-oxidized and cathodic-only treated crystal are given in (a,c), respectively. Close-ups of the basal planes (represented by the following symbols: □ for {100}, Δ for {110}, and ○ for {111}) are provided in (g), where only two out of three need to be visible for accurate determination of the location of a stereographic triangle. Approximate imaging locations along the vertices of the stereographic triangle as defined by the three respective basal planes are represented by the numbers in orange in (e). High-magnification micrographs of the locations matching the numbering in (e) are depicted in (b,d,f,h), with the number matching the location given in the top-left corner where side-by-side sets represent micrographs obtained in matching locations for either CC in the presence of a pre-oxidation step (left-hand side, with underscored numbering) or in the absence of pre-oxidation (right-hand side, with normal numbering).
By imaging various spots along the vertices of a stereographic triangle, we were able to investigate a wide variety of substrates and obtain results that should be representative of the overall behavior of a polycrystalline surface. Moreover, as we employ a spherical single-crystalline surface, we can compare locations on the crystal for different experiments that were initially of the same crystallographic orientation. Hence, we can relate changes in morphology to changes in experimental conditions in an unbiased manner as substrate-directing effects are mitigated (contrary to if similar experiments were to be conducted on polycrystalline surfaces). We compare the final morphology of a surface that was treated purely cathodically (−1.75 V, 5 min) with that of a surface that was first oxidized (+0.7 V, 1 min) and then treated cathodically (−1.75 V, 1 min) to determine the influence of surface oxidation on the morphological restructuring of copper.
In Figure 3a,c, we show the overall profile of the crystal after cathodization (−1.75 V) in the presence of pre-oxidation at +0.70 V and in the absence of pre-oxidation, respectively. In these subfigures, the contrast and brightness of the {111} plane were adjusted independently to enhance its visibility. The original single-crystalline nature of the crystal is clear from Figure 3a, considering that the anisotropic oxidation resulted in distinct regions on the surface that repeat as expected of the symmetry of the FCC unit cell (see, e.g., ref (31) for further information). In Figure 3c (in the absence of oxidation), no such distinct regions are observed, but the {100} and {111} basal planes (denoted by the symbols □ and ○, respectively) could be located, which then allowed for determination of the location of the {110} plane, completing the stereographic triangle. “Proof” that the main facets, as indicated by the symbols, are indeed located where we claim is provided in the form of close-ups of those regions in Figure 3g, where the top row was obtained in the presence of pre-oxidation and the bottom row in the absence of pre-oxidation. In Figure 3e, a rotated and magnified view of Figure 3a is presented, with numbering added to represent the approximate locations where micrographs were obtained.
Having established the crystallinity of the surface and determined the location of one of the stereographic triangles, we now investigate a number of locations along the vertices of the triangle to represent the cathodic stability of copper of various crystallographic orientations in Figure 3b,d,f,h. In each of these subfigures, the morphologies of two different spots on the surface in the presence of pre-oxidation (left-hand side) are compared with those of representative locations without oxidation (right-hand side), with numbers in the top-left corner of the respective images matching the locations given in Figure 3e. Comparing the surface morphologies in Figure 3b,d,h, we find that surface roughening is below the detection limit of the SEM in the case of cathodic-only treatment (−1.75 V, 5 min), requiring random traces of dust for focusing. However, clear anisotropic roughening is present if a pre-oxidation step (+0.70 V, 1 min) is included prior to cathodization (−1.75 V, 1 min). An exception to this is seen in Figure 3f, wherein locations close to the {111} facet are depicted. In this case, some (albeit less) roughness is also observed in the case of cathodic-only treatment. This actually agrees with the small changes in voltammetry (Figure S1) observed after recovery of the surface via H2/O2 annealing, considering that the {111} terrace-related OH-adsorption peak (+0.1 V) exhibited a slightly increased charge after flame annealing compared to the cyclic voltammogram obtained prior to the pre-oxidation experiment. As such, we are unsure if the roughness we observe by SEM near the {111} facet is because of the cathodic treatment or because the annealing treatment failed to fully recover the surface to its initial state.
The key takeaway from this measurement is that a partially oxidized surface results in significant roughening during cathodization, whereas a fully reduced surface yields no observable roughening. Furthermore, the roughening under pre-oxidized conditions is anisotropic, in agreement with CV results (Figure 2d). Although we realize that the spatial resolution of SEM is limited, the results we obtain are in line with what we observe also from voltammetry: high stability of copper with respect to purely cathodic conditions that is negatively impacted by the presence of surface oxides.
(Absence of) Time-Dependent Morphological Change
Until now, the results reported here have been regarding the stability of copper under aggressively cathodic potentials (−1.75 V vs RHE) in strongly alkaline medium (10 M NaOH) for relatively brief periods of time (1 min, except for the cathodic-only SEM data reported in Figure 3; 5 min). We realize that such conditions may not represent the reported morphological instability of copper during CO2RR operation, considering that electrolyte composition and experiment duration differ significantly, implying that possible effects by, for example, (adsorption of) carbonaceous species are not included. To this end, we performed voltammetric studies before and after the following experiments: i) equal conditions as discussed so far (−1.75 V in 10 M NaOH) but for increased reaction times (5, 15, and 60 min, Figure 4a,b, respectively) and ii) employing CO2RR-representative conditions (60 min at −0.75 V in 0.5 M KHCO3, Figure 4c). The upper boundary of 60 min was chosen based on literature-reported chronoamperometry data exhibiting a clear trend of decreasing CO2RR activity of various copper surfaces on this timescale by multiple authors.7,11,21,32,33
Figure 4.

Changes in the characterization cyclic voltammograms (0.1 M NaOH, ν = 50 mV s–1) of Cu(poly) surfaces after being subjected to purely cathodic conditions (5–60 min) under various conditions. Cyclic voltammograms obtained after cathodization at −1.75 V in 10 M NaOH for (a) 5 (orange) and 15 min (blue) and (b) after 1 h (red), in comparison with their respective blank cyclic voltammograms (0.1 M NaOH, ν = 50 mV s–1) (black). (c) Characterization cyclic voltammograms (0.1 M NaOH, ν = 50 mV s–1) obtained before (blank, in black) and after (red) 1 h of CO2 reduction at −0.75 V in 0.5 M KHCO3. Reported potentials are 85% iR-corrected.
Blank cyclic voltammograms (0.1 M NaOH) obtained prior to and after extended cathodization periods in either 10 M NaOH or 0.5 M KHCO3 are depicted in Figure 4, where close-ups of relevant regions are provided as insets and trends discussed in text are denoted by arrows. Figure 4a depicts cyclic voltammograms obtained initially (i.e., the blank) and after 5 and 15 min of cathodization (−1.75 V) in 10 M NaOH in black, yellow, and blue, respectively. Unlike for 1 min of reaction time (Figure 1d) under otherwise identical conditions, minor changes in voltammetry can be observed in this instance. Specifically, a small increase in HER activity (denoted by increased cathodic current for E < −0.1 V), suppression of the anodic (but not cathodic) {111} OH-adsorption feature at +0.1 V, and suppressed current density (both anodic and cathodic) between +0.35 V < E < +0.50 V. Here, the suppressed charge for E > +0.35 V denotes, from a concerted electrochemical and copper-centric perspective, a decrease in the total number of electrochemically addressable copper sites, considering every type of site contributes charge somewhere in this region. Although certain situations involving surface restructuring might lead to an overall decrease in the number of active sites (see the Supporting Information), they are unlikely.
Reasonably, if surface morphology indeed changes to the degree as reported in literature, one would expect to see certain types of sites increasing in relative abundance with other types of sites decreasing in abundance, while simultaneously observing an increase in the total number of surface sites as changes in morphology bring about a shift in the site distribution and furthermore lead to (reportedly) overall smaller surface deposits. Exactly, such behavior can be seen in, for example, Figure 2d where irreversible oxidation and reduction results in changes in relative site abundances and (for increasingly positive oxidation potentials) increases in the overall surface area. However, this “common sense” scenario is in disagreement with the voltammetry results in Figure 4a.
Increasing the reaction time to 60 min (−1.75 V, 10 M NaOH, Figure 4b) provides us with additional information: all CV changes observed for 5 and 15 min become more prominent after 60 min, although suppression of the anodic feature at +0.1 V cannot be ascertained since this region is now masked by the new features that develop. These additional features comprise, specifically, three new anodic peaks at ca. −0.125, +0.05, and +0.2 V, and two new cathodic features near +0.1 and −0.1 V (where the latter is actually a convolution of two peaks). The locations of these new features do not match with where the various types of possible copper sites are known to adsorb, considering that a Cu(poly) surface contains all kinds of possible sites and yet these newly developing features do not match in their location with any of the adsorption features observed for such a surface. Neither does their asymmetrical nature agree with the reversibility of OH adsorption on copper sites. Interestingly, when we use CV to investigate what happens to a polycrystalline copper surface under CO2RR-representative conditions (60 min at −0.75 V in 0.5 M KHCO3 + CO2 (g), Figure 4c), similar CV behavior is observed as after 60 min at −1.75 V in 10 M NaOH, though it is less pronounced. We also found the same behavior in a less concentrated bicarbonate electrolyte (−0.75 V in 0.1 M KHCO3, Figure S2) for various reaction times, with CV changes already evident within 1 min and becoming more pronounced with increased reaction duration. This apparent independence on reaction conditions was further verified from CV studies after performing CO reduction in 10 M NaOH at both −0.75 and −0.40 V (Figures S4 and S5, respectively) for reaction times between 1 and 30 min (e.g., comparable conditions to Figures 1d and 4a). Also in this instance, near-identical CV trends were observed after reaction in the absence and presence of CO, irrespective of the exact applied potential (−1.75 vs −0.75 and −0.40 V). Namely, an absence of change in voltammetry after 1 min, and CV suppression effects plus increased HER after extended reaction duration.
In summary, voltammetric studies for longer timeframes (5–60 min) under various different reaction conditions resulted in comparable cyclic voltammogram trends. Specifically, studies employing strong (−1.75 V, without CO) and weak (−0.75 and −0.40 V, with CO) cathodic potentials in 10 M NaOH showed independence of the potential and presence of CO. Similar results (apparent independence of exact reaction conditions) were also obtained when investigating reduction (−0.75 V) in different concentrations of bicarbonate electrolyte: 0.1 M and 0.5 M KHCO3. Because of the similar voltammetry results obtained under these various conditions, which were furthermore difficult to reconcile with the expected behavior of clean copper, we started doubting the applicability of this cyclic voltammetry-centric approach for studying copper stability for extended duration experiments.
To verify if the voltammetric data were representative of changing copper morphology or otherwise, extended time control experiments that did not rely on CV were performed by conducting identical location SEM studies on a micro-roughened copper surface prior to and after 60 min of CO2RR at −0.75 V in 0.5 M KHCO3. Taking into consideration the considerable changes observed in voltammetry after 60 min of cathodization (both in 10 M NaOH and 0.5 M KHCO3, Figure 4b,c) we would reasonably expect to be able to see such changes via SEM, if indeed the changes in voltammetry are representative of the redistribution of copper sites at the interface resulting from changing morphology. For example, CV changes of similar magnitude were observed in Figure 2d, which resulted in easily identifiable roughening by SEM (Figure 3). The basis for this study was an anisotropically (Figure S3) roughened spherical single crystal (see the halide-induced roughening procedure described in the Experimental Section) that retained its macroscopic anisotropy resulting from its initial single crystallinity but exhibited facet-dependent nanoscale morphology after roughening.
After the roughening procedure, the crystal was rinsed and dried under a reducing atmosphere and moved to the scanning electron microscope, where multiple easily identifiable spots of various morphologies were imaged. Next, it was transferred to the electrochemical setup where it was subjected to −0.75 V in 0.5 M KHCO3 for 60 min under constant CO2 bubbling. Deactivation on this timescale for this electrode is evident from the current response of the system (Figure S6). Copper-catalyst deactivation under similar conditions, ca. 1 h of CO2RR at potentials between −1 V < E < −0.7 V in the bicarbonate electrolyte between 0.1 and 0.5 M for both unpurified and pre-purified electrolytes has also been observed by other authors. For example, see current traces reported by Kuhl et al.,32 Wang et al.,33 and Wuttig et al.7 Additionally, Popovic et al.11 wrote about the morphological evolution of copper on a similar timescale and under similar conditions (i.e., 50 min at −0.70 V in 0.1 M KHCO3). After conducting CO2RR, the electrode was rinsed, dried, and moved to the scanning electron microscope once again. As described in a previous section (accompanying Figure 3), the crystal was manually positioned to match as best as possible its previous orientation using the surface anisotropy. Because of this manual step, the angle of incidence of the electron beam with respect to the surface normal will deviate slightly between the two data sets, with this mismatch being exacerbated by the curvature of the surface. Previously imaged sites were re-located and a follow-up set of micrographs was taken for each location.
The results of this experiment are shown in Figure 5, where micrographs of various spots on the surface exhibiting different morphologies on the mesoscale (ca. 50–200 nm range) obtained before (left-hand side) and after (right-hand side) CO2RR are depicted. Mesoscale surface stability after 1 h of reaction time can be investigated by comparing Figure 5a,c,e,g with 5b,d,f,h for micrographs of the surface prior to and after CO2RR, respectively. Insets show a magnification of a region located within the associated full-sized images. The discussion for this particular experiment is straightforward: the surface was found to be virtually unchanged to within the detection limits for our system. The overall shapes and locations of the variously sized and oriented microparticles located in these images remain static. If anything, there can be one difference observed between Figure 5e,f; an additional particle being located near the bottom-middle for Figure 5f, which we believe is likely dust. Though the resolution of the scanning electron microscope is limited, a copper surface is commonly believed to undergo significant changes under CO2RR conditions on the length scale we investigate and should be easily visible in the insets provided in Figure 5.21 However, as we are very careful to minimize surface oxidation at every step of the experiment, we find that deposits of tens of nanometers in size (i.e., highly reactive and therefore unstable) exhibit high stability within the timeframe and resolution of our system.
Figure 5.

Identical location SEM images of an electrochemically roughened spherical single crystal electrode before (left-hand: a, c, e, and g) and after (right-hand: b, d, f, and h) 60 min of CO2RR at −0.75 V vs RHE in 0.5 M KHCO3 for various locations on the crystal.
Although SEM is incapable of resolving the (distribution of) facets at the interface (one would need atomically resolved and preferably in situ techniques for such information), CV evidence (which is structure sensitive) for short timeframes under cathodic conditions in 10 M NaOH on the three basal planes and defect-rich polycrystalline copper indicated no discernible surface changes, which is in good qualitative agreement with the SEM data provided in both Figure 3 (5 min at −1.75 V in 10 M NaOH) and Figure 5 (60 min at −0.75 V in 0.5 M KHCO3), as we also observe no morphological differences within the limits of our instrument in the absence of surface oxidation. However, the SEM data in Figure 5 evidently disagree with the CV data obtained for such longer time periods (Figure 4c), based on which we would expect, at a minimum, an identifiable change in morphology on the ca. 50 nm scale, if indeed the CV evolution is representative of a changing distribution of facets at the interface. From these results, we believe that the CV results obtained after 5–60 min of reduction are not related to changes in the surface morphology as induced by the negative interfacial potential, neither can we attribute the observed CV trends to unintended oxidation, considering the behavior is very different from the changes we see when comparing cyclic voltammograms obtained for pre-oxidized surfaces (Figure 2) and cathodic-only treated surfaces (Figure 1). This observation also has implications for a recently proposed oxidation-/reduction-driven CO2RR mechanism for copper,34 as this would be expected to yield similar CV behavior as our pre-oxidation experiments. However, no typical signs indicative of surface oxidation and subsequent reduction (Figure 2) are observed from the voltammetry after CO2RR experiments. Furthermore, if indeed (interfacial) copper atoms go through such successive redox cycles during CO2RR, one would also reasonably expect surface dissolution to occur during the reduction phase,10 which has been reported to lead to clear and large-scale morphological changes,11 which are also absent in our measurements. Hence, we posit that the changes in voltammetry after an extended reaction duration must be related to something other than cathodically induced and/or anodically induced morphological surface evolution. We suggest the changes may instead be related to the blocking of copper sites with foreign species, as that would agree with the appearance of non-copper features in the cyclic voltammogram which become more prominent as a function of time, together with the suppression of adsorption charge of known copper sites.
To investigate this hypothesis, we conducted the following experiment. First, a Cu(poly) bead-type electrode was grown and cleaned as per steps (i−iii) of single-crystal growth described in the Experimental Section. After the final HNO3 etching and Milli-Q rinsing steps, it was not re-melted. Rather, it was briefly (ca. 10 s) annealed inductively in pure hydrogen to remove the oxide layer, but at much lower temperatures than used normally (i.e., decreased instrument power) so as to prevent the migration of bulk contaminants to the surface. The crystal was cooled down in hydrogen, moved to the scanning electron microscope and had its elemental composition investigated via energy-dispersive X-ray spectroscopy (EDX) for various locations to verify that the surface was devoid of contaminants to within the accuracy of the apparatus. Thereafter, the crystal was moved to our controlled-atmosphere electrochemical setup, and CO2RR was carried out in a saturated KHCO3 solution (with sufficient KHCO3 added to nominally reach 2 M) under constant CO2 bubbling at −0.75 V for ca. 5 h. Finally, the surface was rinsed under reducing conditions, dried in hydrogen, and moved back to the scanning electron microscope where EDX was performed once more. Results representative of the overall observed behavior are depicted in Figure 6 with additional locations provided in Figures S7 and S8.
Figure 6.

Surface morphology and elemental analysis results before and after ca. 5 h of CO2RR at −0.75 V in saturated KHCO3 solution under constant CO2 (g) purging for an arbitrary location on a nitric acid-cleaned polycrystalline bead electrode. (a,c) EDX spectrum obtained prior to and after CO2RR and (b,d) accompanying SEM micrographs for which EDX was performed.
Although more convincing proof and a more detailed discussion of the morphological stability of copper are provided in the previous section, the respective micrographs shown in Figure 6b,d (before and after CO2RR, respectively) agree with those data: little to no change in surface morphology can be seen.
However, elemental analysis shows a different story: EDX showing no iron prior to CO2RR (Figure 6a) but iron being clearly visible after (Figure 6c). Identical observations were made for various regions on the crystal located hundreds of micrometers apart and having differing morphologies (see e.g., Figures S7 and S8), all exhibiting no distinguishable changes in morphology but with traces of iron present after the experiment. Hence, we believe that the changes in CV that we observe when the reaction time is increased (Figure 4) are most probably related to fouling by solution impurities rather than the changes in the distribution of facets at the surface resulting from morphological evolution.
Conclusions
The cathodic stability of various principal surfaces of copper, together with a defect-rich polycrystalline surface, was investigated under known highly cathodically corrosive conditions13,22 as well as under commonplace CO2RR conditions. The stability of these surfaces was found to be exquisite under purely cathodic potentials, so long as oxide formation was entirely avoided (Figure 1). However, allowing the surface to partially oxidize resulted in rapid changes in the distribution of active sites at the surface (Figure 2). The morphological stability under cathodic-only conditions for both HER at −1.75 V in 10 M NaOH and CO2RR at −0.75 V in 0.5 M KHCO3 + CO2 (g) for prolonged times was corroborated by SEM, with no surface roughening observed to within the accuracy of the equipment for both instances when surface oxidation was absent (Figures 3 and 5, respectively). Voltammetric data after such prolonged reaction times (Figure 4) proved to be unreliable, showing very different behavior from the CV results obtained for shorter periods of time (Figure 1, no changes), exhibiting instead the development of features unrelated to copper, where various different electrolytes and reaction conditions all yielded comparable results. We show that the mismatch between CV data and SEM data after cathodization for extended periods of time is related to electrode fouling as determined via SEM + EDX, where surface morphology was found static, but elemental analysis showed iron to be present after the reaction (Figures 6 and S7/S8).
Our findings are in contradiction with current literature, wherein it is often proposed that the catalyst deactivation observed for Cu surfaces is possibly due to changes in the surface morphology resulting in facet redistribution,12,16,19−21,35 as induced in some manner by the reaction environment (e.g., due to the applied potential,12,14,17 or due to (CO2RR intermediate-related) adsorbates,36 or due to the local pH,35,37 or other factors). However, a comparatively much simpler explanation underlying reported changes in surface morphology exists: accidental surface oxidation and subsequent anisotropic (Figures 2 and 3) reduction of the surface (likely in concert with dissolution and redeposition), as also proposed by Popovic et al.,11 where the rate of reduction of these oxides is likely to influence the final morphology. Such unintended (partial) surface oxidation is easily achieved, considering that the OCV for copper falls within the region where surface oxidation takes place10 and with increasingly complicated setups becoming more prevalent, also increasing the likelihood of minor experimental errors. In agreement with this theory, we show that brief oxidation (1 min) at potentials very close to the OCV of copper (+0.50 V vs RHE), resulted in appreciable differences in CV (Figure 2) denoting anisotropic surface restructuring. Thus, we conclude that oxidation–reduction cycles are the basis of the reported morphological changes for copper, with the thickness of such (accidentally formed) oxide layers, their subsequent (rate of) reduction, and the number of such oxidation/reduction cycles yielding the various (changes in) morphologies reported. This agrees well with Speck and Cherevko10 who reported the absence of copper dissolution at negative potentials down to −1 V versus RHE, stating that “...but further oxidation at open circuit potential results in dissolution.”.
As a final consideration, we would like to point out that the conclusions we draw in this work may contradict with conclusions of other authors on this topic; however, the data on which we base our (and others their) conclusions are not necessarily in disagreement with previous data. This is best illustrated by two recent works by Simon et al.12 and Popovic et al.11 In the former, in situ EC-AFM images were presented, showing that a Cu(100) surface imaged at OCV in 0.1 M KHCO3 changes its morphology once CO2RR conditions are applied, with the resulting surface morphology being a function of the applied potential. However, it was also stated that “...[We] performed CO2RR... over extended periods of time [..., but AFM] images reveal no obvious morphological changes on the surface over the reaction times studied...”.12 Hence, the change in morphology occurred after stepping from the OCV to their potential of interest, which agrees well with our proposed mechanism of oxidation-induced morphological change, which in the case of Simon et al.12 would be the result of starting at OCV. Similarly, Popovic et al.11 showed degradation of a ca. 500 nm radius Cu nanoparticle, but their study also contained periods at open circuit translating to successive oxidation and reduction cycles. In our work, we employed extremely cathodic potentials, resulting in the electrolyte near the surface being supersaturated with hydrogen when we disconnected the electrical circuit. Thereafter, we rinsed briefly under a strong hydrogen flow and dried our electrodes in an isolated environment under a high hydrogen flow. Hence, we minimized such oxidation that would occur at OCVs and could show that the cyclic voltammogram did not change after brief periods of cathodization. Though contamination effects prohibited us from providing the same type of proof for prolonged periods of time, identical location SEM measurements served to show that the morphology is stable, at least on the length scale reported by Popovic et al.11
Experimental Section
Chemicals and Electrochemistry
Single-compartment electrochemical cells were made out of fluorinated ethylene propylene bottles (FEP) with appropriately sized machined inlets and outlets for the working electrode, counter electrode (CE) (Pt, 99.99+%), reference electrode (RE, Gaskatel Hydroflex), and ethylene tetrafluoroethylene gas tubes. All electrochemical experiments were conducted in such cells. All potentials in this work are reported versus the RHE unless otherwise specified. Because of reference accuracy limits in the hydroxide environment in combination with high flow rates of argon, the cyclic voltammograms were found to be accurate to within ±3 mV, which was manually corrected for post-measurement. A standalone annealing compartment made from borosilicate glass and quartz described elsewhere28 was mounted on top of the electrochemical cell to enable the annealing of copper crystals in oxygen-free conditions. Argon (Linde, 5.0) was passed through the electrolyte to remove any gases and switched to blanket the solution during electrochemical measurements, unless otherwise specified. In the instances where experiments were conducted in a differing electrolyte (e.g., 10 M NaOH and bicarbonate solution) than in the blank electrolyte (0.1 M NaOH), the working cell was switched by unmounting the standalone annealing compartment (with the electrode located inside of it, protected against oxidation by isolating the compartment by closing a key and purging with hydrogen), removing the previous cell and mounting a new cell. After switching the working cell, the electrolyte of the newly connected cell was purged for ca. 5 min to remove any oxygen that was introduced by having to open the cell prior to mounting the annealing compartment on top.
Electrolyte solutions were prepared by dissolving appropriate amounts of chemicals used as received in Milli-Q water (Millipore; resistivity ≥18.2 MΩ cm). Blank voltammograms were recorded in 0.1 M NaOH (99.99%, trace metals basis, Sigma-Aldrich); CC experiments were conducted in 10 M NaOH (30.4%, Suprapur, Supelco); CO2RR experiments were conducted in 0.5 M KHCO3 (99.95%, trace metals basis, Sigma-Aldrich) purged with CO2 (Linde, 4.7) for at least half an hour. Glassware, plasticware and other relevant parts were oxidatively cleaned in acidic (0.5 M H2SO4, 96%, ACS reagent, Honeywell) and permanganate (1 g L–1 KMnO4, 99%, ACS reagent, Sigma-Aldrich) solutions overnight. Before starting the experiments, the permanganate solution was poured out and leftover traces of the solution removed via rinsing with Milli-Q water and washing in a dilute sulfuric acid/peroxide (H2O2, 35%, Ph. Nord, Merck) mix. After washing, residues of the acid washing process were removed by boiling in Milli-Q water five times.
Platinum CEs were stored in concentrated piranha solution (3:1 v/v H2SO4/H2O2) after disassembly of the electrochemical cell to prevent copper contamination/alloying. Prior to use, Pt electrodes were rinsed with Milli-Q water and flame-annealed with a butane torch. Copper electrodes were cleaned via induction annealing under a reducing atmosphere, with the full details described elsewhere.28 Disk-type electrodes were measured in a hanging meniscus configuration, whereas spherical bead-type electrodes were inserted into the electrolyte in their entirety up until where the bead connected with the wire. Cut disk-type electrode cyclic voltammograms were normalized to the geometric surface area, and spherical bead-type Cu(poly) electrodes were normalized to their OH-adsorption charge (determined between −0.25 V < E < +0.44 V) using 128.1 μC·cm–2.28 Exact crystal pre-treatment and measurement methodologies, including information on cyclic voltammogram peak assignments, are described in a separate work.28
Notably, our experimental setup does not allow for determining CO2RR product distributions, considering that such measurements require, for example, small electrolyte and headspace volumes, inclusion of a membrane, and constant CO2 purging while making sure only the intended (i.e., monocrystalline) part of the crystal is whetted, all of which are not possible. Because setups that do allow for product quantification generally do not allow for (a) the absence of exposure to ambient conditions for at least brief periods and (b) the absence of periods where the crystal is at open circuit voltage, nor (c) accommodate crystals without introducing surface stress (an important consideration for single crystals) or leakage issues (in the case of our purified spherical polycrystals), we believe that making use of such alternative setups to determine the CO2RR performance would yield results not indicative of the actual behavior of the surfaces as measured in this work.
Spherical Single-Crystal Growth
Spherical single crystals used as is, or as the substrate for the anisotropically roughened electrodes used during identical location SEM investigations, were prepared via the methodology described by Arulmozhi and Jerkiewizc,38 albeit with an alternate nozzle type that allowed for a central hydrogen–oxygen flame surrounded by an inert argon column.39,40 A brief summary of the growth process is as follows.
-
i)
A copper bead was grown from a high-purity Cu wire (99.9999%, metals basis, Puratronic) via induction annealing in an oxygen-free environment.28
-
ii)
Impurities that migrated from the bulk to the surface were removed by dissolution in concentrated HNO3 (65%, Ph Eur., Boom), after which the bead was thoroughly rinsed with Milli-Q water.
-
iii)
The bead was briefly re-melted (but not grown larger) and allowed to solidify again as per step (i), and additional impurities that migrated to the surface were removed as per step (ii). Re-melting and subsequent surface dissolution/cleaning steps were repeated approximately five times.
-
iv)
The high-purity bead electrode was then mounted a few millimeters above the nozzle in a duplicate of the crystal-growing setup as described in ref (38). The nozzle, however, was replaced by a different type that allowed for a central flame surrounded by an outer flame, but instead of supplying fuel for an outer flame, argon was fed—resulting in a central flame surrounded by a “protective” argon blanket.
-
v)
A flame comprising hydrogen and oxygen in a ratio that was just barely hot enough for melting copper (for our setup, 500:57 sccm H2/O2) was used in conjunction with an argon blanket (800 sccm) and positioned such that ca. 75% of the copper bead was molten.
-
vi)
After a brief stabilization period (ca. 5–15 min), the nozzle was then gradually decreased in height (0.3 μm·s–1) via a computer-controlled micro-actuator located at the base of the micro-torch, allowing for the copper melt to slowly solidify.
-
vii)
After the entirety of the (now single-crystalline) bead had solidified, the flow rate of the Ar blanket was increased to 1500 sccm in one step, and the oxygen content of the flame was lowered in ca. 20% increments until reaching zero over a period of ca. 30 s.
-
viii)
Subsequently, the hydrogen flow rate was gradually reduced in ca. 1% increments, while the argon flow rate was increased in 1% increments until the hydrogen flame extinguished from a lack of oxygen (coming from the ambient air, diffusing through the argon blanket). Decreasing the hydrogen flow rate to ca. 100 sccm resulted in the flame being unable to persist for our system.
-
ix)
Then, the crystal was allowed to cool to room temperature in the reducing atmosphere of ca. 2000:100 Ar/H2 for ca. 10–15 min.
Anisotropic Roughening
Creation of anisotropic roughness with microscale morphology was done in a controlled manner by using a strategy reported by Sloan et al.41 Briefly, we cycled the electrode in a CO2-purged bicarbonate (0.1 M) electrolyte with 4 mM KCl from −0.75 to +0.70 V and back down to −1.5 V at a scan rate of 5 mV/s. Then, −1.5 V was applied for another ca. 5 min. The exact potentials and number of cycles (i.e., 1) were adjusted from the original work so as to prevent losing anisotropic effects due to over-oxidation, with a period at highly reducing potentials included to guarantee full reduction of the surface.
Interfacing between Electrochemistry and SEM
In the case of post-electrochemical treatment investigation of the surface via SEM, the following methodology was employed to limit surface oxidation of the crystals. It is very important to make sure the surface is completely dry prior to exposure to air where it cannot be avoided, so as to decrease the rate at which the surface oxidizes.
-
i)
Finish the electrochemical experiment (but maintain potential control, either at e.g., the last applied potential, or some non-oxidizing standby potential such as −0.25 V vs RHE).
-
ii)
Break electrical contact while still under potential control (thereby going to OCV) and increase the hydrogen flow to several L·min–1 (adjusted manually; exact flow rate is unknown).
-
iii)
Move the electrode up, to where the annealing compartment of the setup is connected to the electrochemical cell (see ref (28))
-
iv)
Move the entirety of the annealing compartment containing the electrode up, breaking the link with the electrochemical cell. This action creates an opening where the annealing compartment is now exposed to ambient conditions, but as this location is the path of least resistance for the hydrogen to flow, the crystal is still under reducing conditions, provided the hydrogen flow is sufficiently high.
-
v)
Move the crystal slightly down, so that it is sticking out of the annealing compartment a few millimeters.
-
vi)
Thoroughly rinse the crystal with Milli-Q water (ca. 30 s), being careful to only wet the crystal surface and not allow water to flow up to (and down from) where the connecting wire of the crystal is attached to the electrode holder.
-
vii)
Move the crystal up through the keyhole to inside of the annealing compartment and close the key, creating a water-locked isolated environment.
-
viii)
Decrease the hydrogen flow to several hundred sccm (exact flow rate unknown), making sure that the gas is exiting through the water lock.
-
ix)
Dry the electrode in the annealing compartment under active hydrogen flow for ca. 15–30 min.
-
x)
Stop the hydrogen flow and take the electrode out of the setup. Fixate the electrode in a SEM holder and place the holder in a desiccator or other type of vessel that can be depressurized. Attach the desiccator with a crystal inside to a pump and depressurize to ca. 1–5 mbar and close off the desiccator. Total exposure of the (dry) crystal to (1 atm of) air during this period is ca. 45–60 s.
-
xi)
Move the desiccator to where the scanning electron microscope is located and place the crystal in its chamber, close it off, and start pumping down. During this period, the (dry) crystal is exposed to (1 atm of) air for another ca. 30–45 s.
Identical Location SEM Methodology
SEM imaging of identical surface locations was performed as follows. First, copper surfaces with clear surface anisotropy were employed, either in the form of spherical single crystals (with the various basal planes being visually different from one another and orderly distributed over the surface) or in the form of roughened polycrystalline surfaces with directional features on the surface that could be used for orientation. Low-magnification surface overview images were obtained and saved (ca. 50× magnification) during the pre-experiment surface characterization, and based on this (these) image(s), the surface was oriented (by rotating and tilting the scanning electron microscope platform) after the experiment to match the initial orientation as visible from those overview images. This methodology works only because the surfaces were found to not change significantly, with the exception of experiments involving pre-oxidation of spherical single-crystal copper surfaces, in which cases the surface changed, but the locations of the basal planes still allowed for the determination of previously imaged locations. For each location that was investigated via SEM, besides high-magnification images, various images of decreasing zoom level were used to pinpoint the exact location based on the macroscale and mesoscale features of the surface.
Instruments and Software
All electrochemical experiments were conducted with a VSP-300 potentiostat from BioLogic, controlled with their proprietary software EC-Lab. Where applicable, gas flow rates were controlled via mass flow controllers from Brooks (SLA5850) via their proprietary software. Data editing and plotting were done using the software Igor. The scanning electron microscope was operated under high vacuum (≤8 × 10⁻⁶ mbar), with micrographs collected with beam settings of 15 kV and 0.40 nA utilizing an Everhart–Thornley detector. SEM images have been subjected to post-acquisition editing in Photoshop, possibly having been (a) rotated, (b) cropped, and/or (c) having had their contrast and brightness adjusted.
Acknowledgments
This project was part of the Solar-to-Products program financed by The Netherlands Organization for Scientific Research (NWO) and by Shell Global Solutions International B.V. This work also received partial support from Hitachi High-Tech Corporation.
Supporting Information Available
The Supporting Information is available free of charge at https://pubs.acs.org/doi/10.1021/acsami.1c13989.
CV proof for spherical single-crystal recovery and for evolution of a Cu surface after being subjected to various timeframes of CO2RR in 0.1 M KHCO3; SEM micrograph as proof of anisotropic roughening upon oxidation and reduction of a copper spherical single crystal in 0.1 M KHCO3 in the presence of minute amounts of chloride; CV evolution of a Cu surface after being subjected to various timeframes of CORR in 10 M NaOH at −-0.75 V and −-0.40 V; time-dependent current deactivation for the roughened spherical single-crystal electrode during CO2RR at −0.75 V in 0.5 M KHCO3; and copper stability for various morphologies after being subjected to prolonged CO2RR conditions, together with electrode fouling effects, as determined from EDX (PDF)
Author Contributions
S.J.R. and N.A. contributed equally. All authors have given approval to the final version of the manuscript. N.A. and M.T.M.K. conceived the project. N.A. pioneered copper single-crystal growth procedures. N.A. adapted reported induction annealing equipment to decouple the electrochemical cell from the annealing environment and established non-precious metal annealing procedures. N.A. proposed identical location-based microscopy experiments. S.J.R. and N.A. conducted SEM measurements on roughened single crystalline surfaces. S.J.R. and N.A. established electrochemical procedures. S.J.R. performed the experiments. S.J.R., N.A. and M.T.M.K. analyzed the data.
The authors declare no competing financial interest.
Supplementary Material
References
- Jouny M.; Luc W.; Jiao F. General Techno-Economic Analysis of CO2 Electrolysis Systems. Ind. Eng. Chem. Res. 2018, 57, 2165–2177. 10.1021/acs.iecr.7b03514. [DOI] [Google Scholar]
- Verma S.; Kim B.; Jhong H.-R. M.; Ma S.; Kenis P. J. A. A Gross-Margin Model for Defining Technoeconomic Benchmarks in the Electroreduction of CO2. ChemSusChem 2016, 9, 1972–1979. 10.1002/cssc.201600394. [DOI] [PubMed] [Google Scholar]
- Kibria M. G.; Edwards J. P.; Gabardo C. M.; Dinh C. T.; Seifitokaldani A.; Sinton D.; Sargent E. H. Electrochemical CO2 Reduction into Chemical Feedstocks: From Mechanistic Electrocatalysis Models to System Design. Adv. Mater. 2019, 31, 1807166. 10.1002/adma.201807166. [DOI] [PubMed] [Google Scholar]
- Sisler J.; Khan S.; Ip A. H.; Schreiber M. W.; Jaffer S. A.; Bobicki E. R.; Dinh C.-T.; Sargent E. H. Ethylene Electrosynthesis: A Comparative Techno-Economic Analysis of Alkaline Vs Membrane Electrode Assembly Vs CO2–CO–C2H4 Tandems. ACS Energy Lett. 2021, 6, 997–1002. 10.1021/acsenergylett.0c02633. [DOI] [Google Scholar]
- Song J.; Song H.; Kim B.; Oh J. Towards Higher Rate Electrochemical CO2 Conversion: From Liquid-Phase to Gas-Phase Systems. Catalysts 2019, 9, 224. 10.3390/catal9030224. [DOI] [Google Scholar]
- Hori Y.; Konishi H.; Futamura T.; Murata A.; Koga O.; Sakurai H.; Oguma K. “Deactivation of Copper Electrode” in Electrochemical Reduction of CO2. Electrochim. Acta 2005, 50, 5354–5369. 10.1016/j.electacta.2005.03.015. [DOI] [Google Scholar]
- Wuttig A.; Surendranath Y. Impurity Ion Complexation Enhances Carbon Dioxide Reduction Catalysis. ACS Catal. 2015, 5, 4479–4484. 10.1021/acscatal.5b00808. [DOI] [Google Scholar]
- DeWulf D. W.; Jin T.; Bard A. J. Electrochemical and Surface Studies of Carbon Dioxide Reduction to Methane and Ethylene at Copper Electrodes in Aqueous Solutions. J. Electrochem. Soc. 1989, 136, 1686–1691. 10.1149/1.2096993. [DOI] [Google Scholar]
- Ren D.; Wong N. T.; Handoko A. D.; Huang Y.; Yeo B. S. Mechanistic Insights into the Enhanced Activity and Stability of Agglomerated Cu Nanocrystals for the Electrochemical Reduction of Carbon Dioxide to N-Propanol. J. Phys. Chem. Lett. 2016, 7, 20–24. 10.1021/acs.jpclett.5b02554. [DOI] [PubMed] [Google Scholar]
- Speck F. D.; Cherevko S. Electrochemical Copper Dissolution: A Benchmark for Stable CO2 Reduction on Copper Electrocatalysts. Electrochem. Commun. 2020, 115, 106739. 10.1016/j.elecom.2020.106739. [DOI] [Google Scholar]
- Popovic S.; Bele M.; Hodnik N. Reconstruction of Copper Nanoparticles at Electrochemical CO2 Reduction Reaction Conditions Occurs Via Two-Step Dissolution/Redeposition Mechanism. ChemElectroChem 2021, 8, 2634. 10.1002/celc.202100387. [DOI] [Google Scholar]
- Simon G. H.; Kley C. S.; Roldan Cuenya B. Potential-Dependent Morphology of Copper Catalysts During CO2 Electroreduction Revealed by in Situ Atomic Force Microscopy. Angew. Chem., Int. Ed. 2021, 60, 2561–2568. 10.1002/anie.202010449. [DOI] [PMC free article] [PubMed] [Google Scholar]
- Yanson A. I.; Rodriguez P.; Garcia-Araez N.; Mom R. V.; Tichelaar F. D.; Koper M. T. M. Cathodic Corrosion: A Quick, Clean, and Versatile Method for the Synthesis of Metallic Nanoparticles. Angew. Chem., Int. Ed. 2011, 50, 6346–6350. 10.1002/anie.201100471. [DOI] [PMC free article] [PubMed] [Google Scholar]
- Phan T. H.; Banjac K.; Cometto F. P.; Dattila F.; García-Muelas R.; Raaijman S. J.; Ye C.; Koper M. T. M.; López N.; Lingenfelder M. Emergence of Potential-Controlled Cu-Nanocuboids and Graphene-Covered Cu-Nanocuboids under Operando CO2 Electroreduction. Nano Lett. 2021, 21, 2059–2065. 10.1021/acs.nanolett.0c04703. [DOI] [PubMed] [Google Scholar]
- Matsushima H.; Taranovskyy A.; Haak C.; Gründer Y.; Magnussen O. M. Reconstruction of Cu(100) Electrode Surfaces During Hydrogen Evolution. J. Am. Chem. Soc. 2009, 131, 10362–10363. 10.1021/ja904033t. [DOI] [PubMed] [Google Scholar]
- Kim Y.-G.; Baricuatro J. H.; Javier A.; Gregoire J. M.; Soriaga M. P. The Evolution of the Polycrystalline Copper Surface, First to Cu(111) and Then to Cu(100), at a Fixed Co2rr Potential: A Study by Operando Ec-Stm. Langmuir 2014, 30, 15053–15056. 10.1021/la504445g. [DOI] [PubMed] [Google Scholar]
- Scholten F.; Nguyen K. L. C.; Bruce J. P.; Heyde M.; Roldan Cuenya B. Identifying Structure-Selectivity Correlations in the Electrochemical Reduction of CO 2 : A Comparison of Well-Ordered Atomically Clean and Chemically Etched Copper Single-Crystal Surfaces. Angew. Chem., Int. Ed. 2021, 60, 19169. 10.1002/anie.202103102. [DOI] [PMC free article] [PubMed] [Google Scholar]
- Arán-Ais R. M.; Scholten F.; Kunze S.; Rizo R.; Roldan Cuenya B. The Role of in Situ Generated Morphological Motifs and Cu(I) Species in C2+ Product Selectivity During CO2 Pulsed Electroreduction. Nat. Energy 2020, 5, 317–325. 10.1038/s41560-020-0594-9. [DOI] [Google Scholar]
- Kim Y.-G.; Javier A.; Baricuatro J. H.; Torelli D.; Cummins K. D.; Tsang C. F.; Hemminger J. C.; Soriaga M. P. Reprint Of: Surface Reconstruction of Pure-Cu Single-Crystal Electrodes under CO-Reduction Potentials in Alkaline Solutions: A Study by Seriatim Ecstm-Dems. J. Electroanal. Chem. 2017, 793, 113–118. 10.1016/j.jelechem.2017.04.037. [DOI] [Google Scholar]
- Kim Y.-G.; Baricuatro J. H.; Soriaga M. P. Surface Reconstruction of Polycrystalline Cu Electrodes in Aqueous Khco3 Electrolyte at Potentials in the Early Stages of CO2 Reduction. Electrocatalysis 2018, 9, 526–530. 10.1007/s12678-018-0469-z. [DOI] [Google Scholar]
- Popović S.; Smiljanić M.; Jovanovič P.; Vavra J.; Buonsanti R.; Hodnik N. Stability and Degradation Mechanisms of Copper-Based Catalysts for Electrochemical CO2 Reduction. Angew. Chem., Int. Ed. 2020, 59, 14736–14746. 10.1002/anie.202000617. [DOI] [PubMed] [Google Scholar]
- Yanson A. I.; Antonov P. V.; Rodriguez P.; Koper M. T. M. Influence of the Electrolyte Concentration on the Size and Shape of Platinum Nanoparticles Synthesized by Cathodic Corrosion. Electrochim. Acta 2013, 112, 913–918. 10.1016/j.electacta.2013.01.056. [DOI] [Google Scholar]
- Hersbach T. J. P.; Yanson A. I.; Koper M. T. M. Anisotropic Etching of Platinum Electrodes at the Onset of Cathodic Corrosion. Nat. Commun. 2016, 7, 12653. 10.1038/ncomms12653. [DOI] [PMC free article] [PubMed] [Google Scholar]
- Hersbach T. J. P.; Mints V. A.; Calle-Vallejo F.; Yanson A. I.; Koper M. T. M. Anisotropic Etching of Rhodium and Gold as the Onset of Nanoparticle Formation by Cathodic Corrosion. Faraday Discuss. 2016, 193, 207–222. 10.1039/c6fd00078a. [DOI] [PubMed] [Google Scholar]
- Hersbach T. J. P.; McCrum I. T.; Anastasiadou D.; Wever R.; Calle-Vallejo F.; Koper M. T. M. Alkali Metal Cation Effects in Structuring Pt, Rh, and Au Surfaces through Cathodic Corrosion. ACS Appl. Mater. Interfaces 2018, 10, 39363–39379. 10.1021/acsami.8b13883. [DOI] [PubMed] [Google Scholar]
- Raaijman S. J.; Arulmozhi N.; Koper M. T. M. Anisotropic Cathodic Corrosion of Gold Electrodes in the Absence and Presence of Carbon Monoxide. J. Phys. Chem. C 2020, 124, 28539–28554. 10.1021/acs.jpcc.0c08574. [DOI] [Google Scholar]
- Sebastián-Pascual P.; Sarabia F. J.; Climent V.; Feliu J. M.; Escudero-Escribano M. Elucidating the Structure of the Cu-Alkaline Electrochemical Interface with the Laser-Induced Temperature Jump Method. J. Phys. Chem. C 2020, 124, 23253–23259. 10.1021/acs.jpcc.0c07821. [DOI] [Google Scholar]
- Raaijman S. J.; Arulmozhi N.; Koper M. T. M. Clean and Reproducible Voltammetry of Copper Single Crystals with Prominent Facet-Specific Features Using Induction Annealing. J. Electrochem. Soc. 2021, 168, 096510. 10.1149/1945-7111/ac24b9. [DOI] [Google Scholar]
- Tiwari A.; Heenen H. H.; Bjørnlund A. S.; Hochfilzer D.; Chan K.; Horch S. Electrochemical Oxidation of CO on Cu Single Crystals under Alkaline Conditions. ACS Energy Lett. 2020, 5, 3437–3442. 10.1021/acsenergylett.0c01751. [DOI] [Google Scholar]
- Schouten K. J. P.; Gallent E. P.; Koper M. T. M. The Electrochemical Characterization of Copper Single-Crystal Electrodes in Alkaline Media. J. Electroanal. Chem. 2013, 699, 6–9. 10.1016/j.jelechem.2013.03.018. [DOI] [Google Scholar]
- Arulmozhi N.; Esau D.; Lamsal R. P.; Beauchemin D.; Jerkiewicz G. Structural Transformation of Monocrystalline Platinum Electrodes Upon Electro-Oxidation and Electro-Dissolution. ACS Catal. 2018, 8, 6426–6439. 10.1021/acscatal.8b00319. [DOI] [Google Scholar]
- Kuhl K. P.; Cave E. R.; Abram D. N.; Jaramillo T. F. New Insights into the Electrochemical Reduction of Carbon Dioxide on Metallic Copper Surfaces. Energy Environ. Sci. 2012, 5, 7050–7059. 10.1039/c2ee21234j. [DOI] [Google Scholar]
- Wang L.; Nitopi S. A.; Bertheussen E.; Orazov M.; Morales-Guio C. G.; Liu X.; Higgins D. C.; Chan K.; Nørskov J. K.; Hahn C.; Jaramillo T. F. Electrochemical Carbon Monoxide Reduction on Polycrystalline Copper: Effects of Potential, Pressure, and Ph on Selectivity toward Multicarbon and Oxygenated Products. ACS Catal. 2018, 8, 7445–7454. 10.1021/acscatal.8b01200. [DOI] [Google Scholar]
- Chang C.-J.; Lin S.-C.; Chen H.-C.; Wang J.; Zheng K. J.; Zhu Y.; Chen H. M. Dynamic Reoxidation/Reduction-Driven Atomic Interdiffusion for Highly Selective CO2 Reduction toward Methane. J. Am. Chem. Soc. 2020, 142, 12119–12132. 10.1021/jacs.0c01859. [DOI] [PubMed] [Google Scholar]
- Luo W.; Hu L.; Xv Y.; Zhou J.; Xv W.; Yan M. Electrochemical Corrosion Behavior and Surface Passivation of Bulk Nanocrystalline Copper in Alkaline Solution. Anti-Corros. Methods Mater. 2020, 67, 465–472. 10.1108/acmm-05-2020-2306. [DOI] [Google Scholar]
- De Luna P.; Quintero-Bermudez R.; Dinh C.-T.; Ross M. B.; Bushuyev O. S.; Todorović P.; Regier T.; Kelley S. O.; Yang P.; Sargent E. H. Catalyst Electro-Redeposition Controls Morphology and Oxidation State for Selective Carbon Dioxide Reduction. Nat. Catal. 2018, 1, 103–110. 10.1038/s41929-017-0018-9. [DOI] [Google Scholar]
- Zhao Y.; Chang X.; Malkani A. S.; Yang X.; Thompson L.; Jiao F.; Xu B. Speciation of Cu Surfaces During the Electrochemical CO Reduction Reaction. J. Am. Chem. Soc. 2020, 142, 9735–9743. 10.1021/jacs.0c02354. [DOI] [PubMed] [Google Scholar]
- Arulmozhi N.; Jerkiewicz G. Design and Development of Instrumentations for the Preparation of Platinum Single Crystals for Electrochemistry and Electrocatalysis Research. Part 1: Semi-Automated Crystal Growth. Electrocatalysis 2016, 7, 507–518. 10.1007/s12678-016-0331-0. [DOI] [Google Scholar]
- Schuett F. M.; Esau D.; Varvaris K. L.; Gelman S.; Björk J.; Rosen J.; Jerkiewicz G.; Jacob T. Controlled-Atmosphere Flame Fusion Single-Crystal Growth of Non-Noble fcc, hcp, and bcc Metals Using Copper, Cobalt, and Iron. Angew. Chem., Int. Ed. 2020, 59, 13246–13252. 10.1002/anie.201915389. [DOI] [PMC free article] [PubMed] [Google Scholar]
- Liao W.; Lin X.-y.; Chen Y.-w.; Yau S.; Shyue J.-J. Fabricating copper and copper/nickel alloy single crystal bead electrodes with a hydrogen-oxygen torch in ambient air. Electrochem. Commun. 2019, 109, 106563. 10.1016/j.elecom.2019.106563. [DOI] [Google Scholar]
- Roberts F. S.; Kuhl K. P.; Nilsson A. High Selectivity for Ethylene from Carbon Dioxide Reduction over Copper Nanocube Electrocatalysts. Angew. Chem. 2015, 127, 5268–5271. 10.1002/ange.201412214. [DOI] [PubMed] [Google Scholar]
Associated Data
This section collects any data citations, data availability statements, or supplementary materials included in this article.