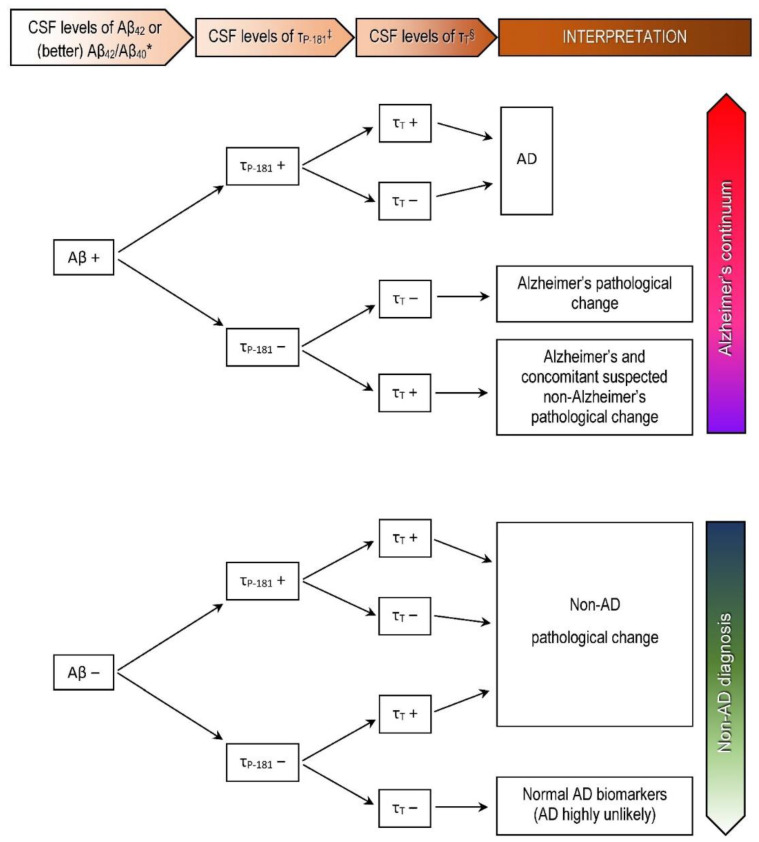
Figure 1.
Biomarker levels in the CSF and interpretation of results for clinical purposes in our departments according to the AT(N) classification system, using the classical CSF biomarkers and structural imaging (MRI or CT) [18]. * Abnormal have decreased levels (positive result). ‡ Abnormal have increased levels (positive result). § Abnormal have increased CSF levels or atrophy in structural neuroimaging (positive result). Negative results indicate normal findings. AD: Alzheimer’s disease.

