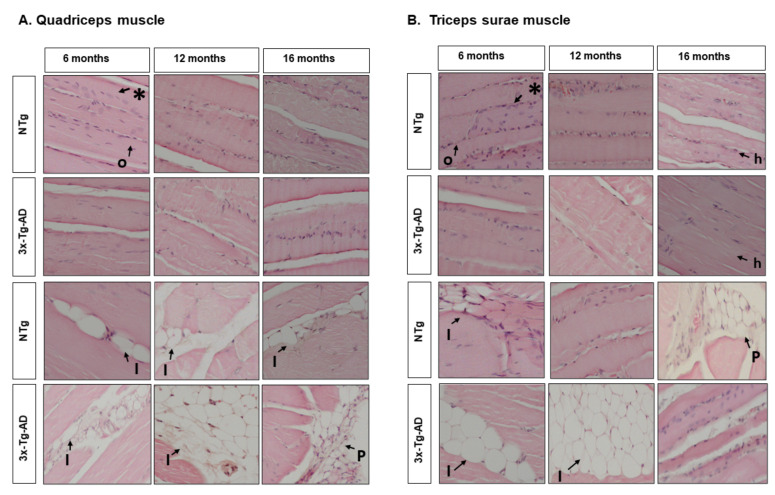
Figure 6.
Morphological comparison of muscle tissue in normal and AD-pathological aging. Hematoxylin and eosin-stained horizontal sections of muscles. (A) Quadriceps muscle; (B) Triceps surae muscle. Representative H&E images of longitudinal skeletal muscle at 6, 12, and 16 months. Symbols indicate the morphological features, as follows: *—Peripheral nuclei; o—homogeneous fibre distribution; h—heterogeneous fibre distribution; I—intramuscular adipose tissue; P—peripheral adipose tissue. The images were taken with 20× objective lens; the scale bar represents 0.32 µm.

