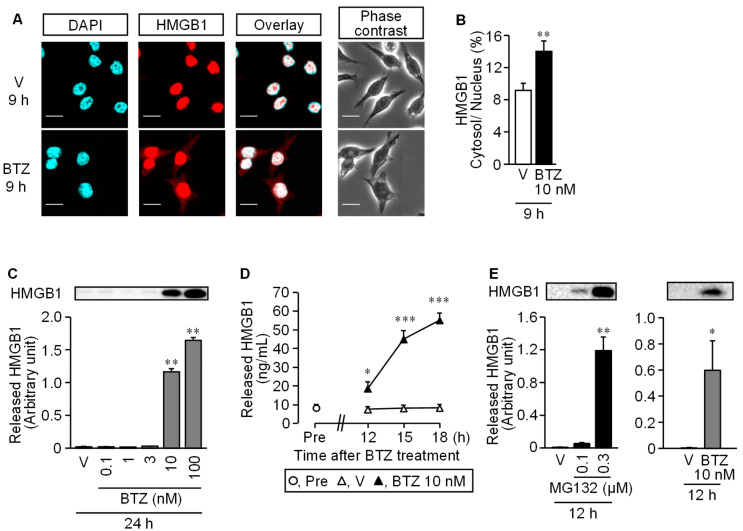
Figure 6.
Cytoplasmic translocation and extracellular release of nuclear HMGB1 in RAW264.7 macrophages stimulated with bortezomib. (A,B) Translocation of HMGB1 from the nucleus to the cytoplasm in RAW264.7 cells. The cells were stimulated with bortezomib at 10 nM for 9 h, and HMGB1 was detected by immunofluorescence staining. Blue, DAPI (nucleus); red, HMGB1; Scale bar, 50 μm (A). (B) Proportion (%) of fluorescence signal of HMGB1 in the cytoplasm to that in the nucleus. (C) Extracellular release of HMGB1 from RAW264.7 cells stimulated with bortezomib at 0.1–100 nM for 24 h, as assessed by Western blotting. Typical photographs are shown on the top above columns. (D) Time-dependent HMGB1 release from RAW264.7 cells stimulated with bortezomib at 10 nM for 12, 15, or 18 h, as assessed by ELISA. (E) MG132, another well-known proteasome inhibitor, as well as bortezomib causes HMGB1 release from RAW264.7 cells. The cells were stimulated with MG132 at 0.1 or 0.3 µM or bortezomib at 10 nM for 12 h, and the extracellular HMGB1 was determined by Western blotting. Typical photographs are shown on the top above columns. Data show the mean with S.E.M for 5 different experiments (B,C,D,E). V, vehicle; BTZ, bortezomib. * p < 0.05, ** p < 0.01, *** p < 0.001 vs. V.

