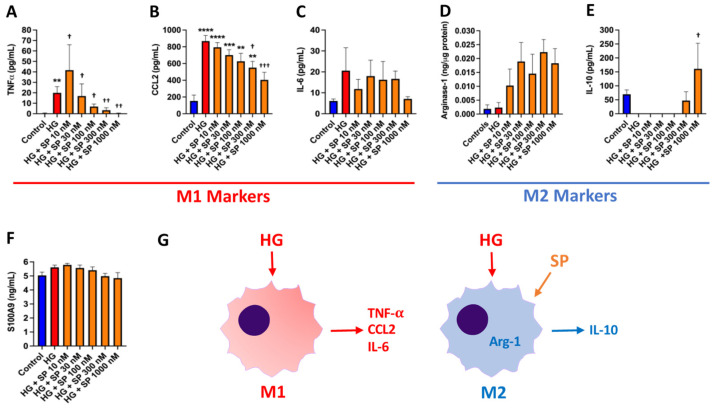
Figure 4.
SP promotes an M2 macrophage phenotype in vitro. Macrophage M1 phenotype markers (A) TNF-α; (B) CCL2; and (C) IL-6 in cultured BMMF culture media in response to normal glucose (control, 5 mM), high glucose (HG, 25 mM), and HG with increasing concentrations of SP (10 to 1000 nM). M2 macrophage phenotype markers (D) arginase-1; and (E) IL-10 in cultured BMMF lysates and media, respectively, in response to normal glucose (control, 5 mM), high glucose (HG, 25 mM), and HG with increasing concentrations of SP (10 to 1000 nM); (F) S100A9 levels in cultured BMMF culture media in response to normal glucose, HG, and HG with increasing concentrations of SP; and (G) Schematic showing the M1 and M2 macrophage phenotype and markers in response to HG, as well as the effect of SP on macrophage phenotype. Data are expressed as mean ± SEM and were analyzed by one-way ANOVA with Tukey post hoc test; ** p < 0.01 vs. control, *** p < 0.001 vs. control, **** p < 0.0001 vs. control, † p < 0.05 vs. HG, †† p < 0.01 vs. HG, ††† p < 0.001 vs. HG. n = 4–6 for control and n = 5–6 for all other groups.

