Figure 5.
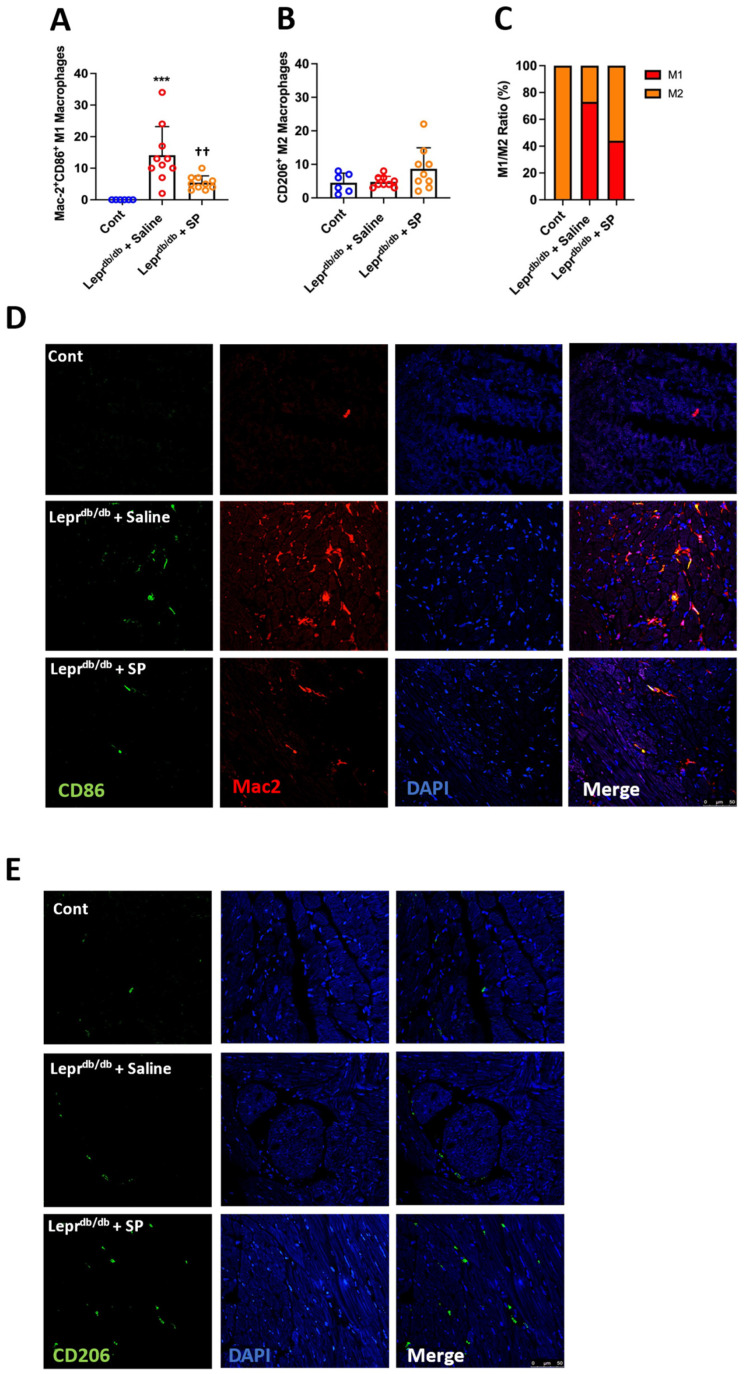
SP promotes a shift towards an M2 macrophage phenotype in vivo. (A) Number of M1 macrophages (Mac-2+CD86+) per LV section; (B) number of M2 macrophages (CD206+) per LV section; and (C) ratio of M1 to M2 macrophages per LV section for Cont (n = 6), Leprdb/db + saline (n = 10), and Leprdb/db + SP mice (n = 10). (D) Representative images for M1 macrophages (Mac-2+CD86+); and (E) Representative images for M2 macrophages (CD206+). Data are expressed as mean ± SD and were analyzed by one-way ANOVA with Tukey post hoc test. *** p < 0.001, †† p < 0.01.

