Figure 2.
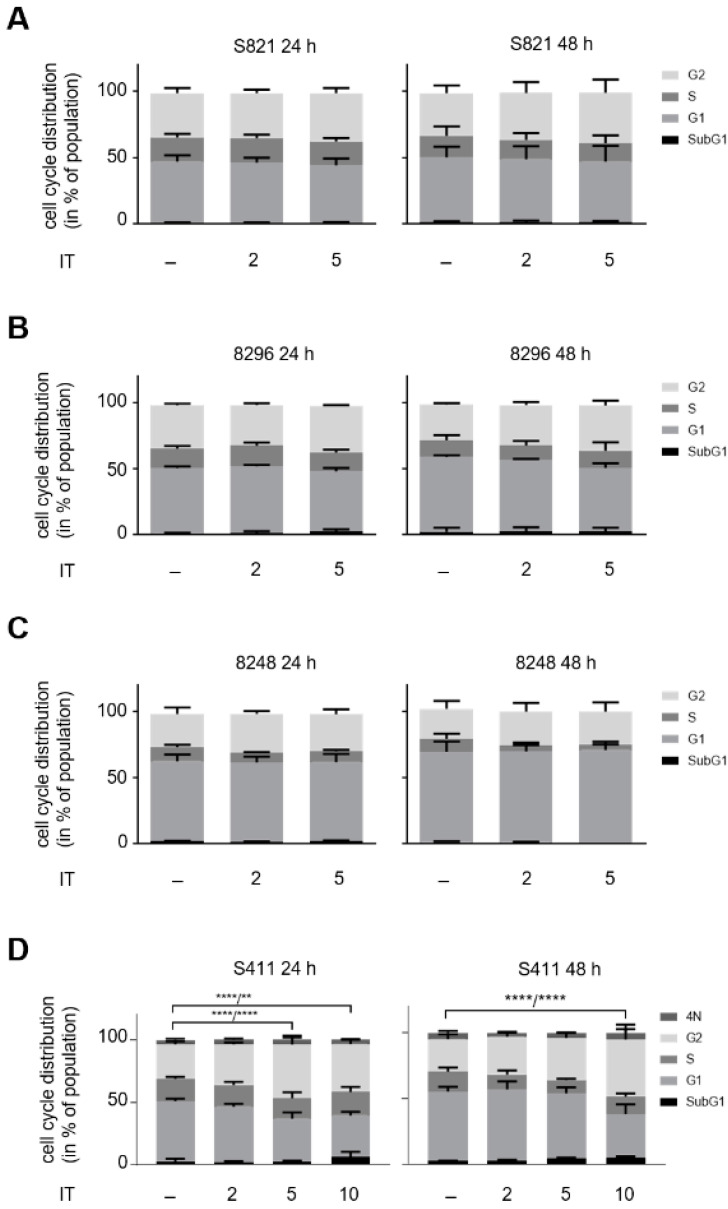
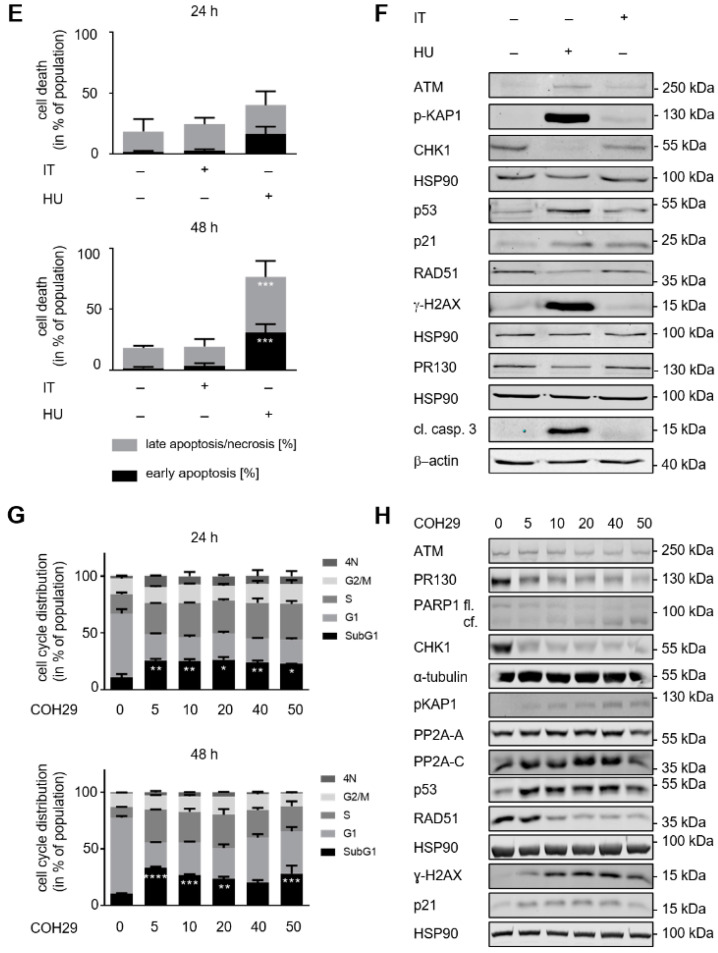
Hydroxyurea induces apoptosis and DNA damage in PDAC cell lines. PDAC cell lines were treated with irinotecan (IT) or hydroxyurea (HU). Cell cycle distributions and subG1 phases of (A) S821, (B) 8296, (C) 8248, and (D) S411 cells after incubation with 2, 5, and 10 µM irinotecan for 24 h and 48 h. The data were collected by flow cytometry of PI-stained cells and are shown as mean ± SD (n = 3; one-way ANOVA, * p < 0.05, ** p < 0.01, *** p < 0.001, **** p < 0.0001). The first p-values refer to G1 phase, the second p-values to G2/M phase. (E) Apoptosis analysis of S411 cells that were treated with 5 µM irinotecan or 1 mM hydroxyurea for 24 h and 48 h. Results were determined by flow cytometry by using annexin-V-FITC staining and are shown as mean ± SD (n = 3). Hydroxyurea induces significantly higher levels of apoptosis than irinotecan (apoptosis: 31% (p = 0.0005), late apoptosis/necrosis: 45% (p = 0.0005). Statistical analysis was done with two-way ANOVA (* p < 0.05, ** p < 0.01, *** p < 0.001, **** p < 0.0001). (F) S411 cells were treated with 5 µM irinotecan or 1 mM hydroxyurea for 24 h. The levels of ATM, p53, p21, RAD51, cleaved caspase-3 (cl. casp. 3) and PR130, as well as the phosphorylation of KAP1 and H2AX were measured by immunoblot. HSP90 and β-actin served as loading controls; n = 3. (G) A total of 5–50 µM COH29 were applied to S411 cells for 24–48 h. Flow cytometry determined cell cycle distributions and cells in subG1 phase; n = 2. (H) S411 cells were treated with 5–50 µM COH29 for 24 h. Immunoblot was done as indicated (fl., full-length PARP1; cf., cleaved form of PARP1). HSP90 and α-tubulin served as loading controls; n = 2.


