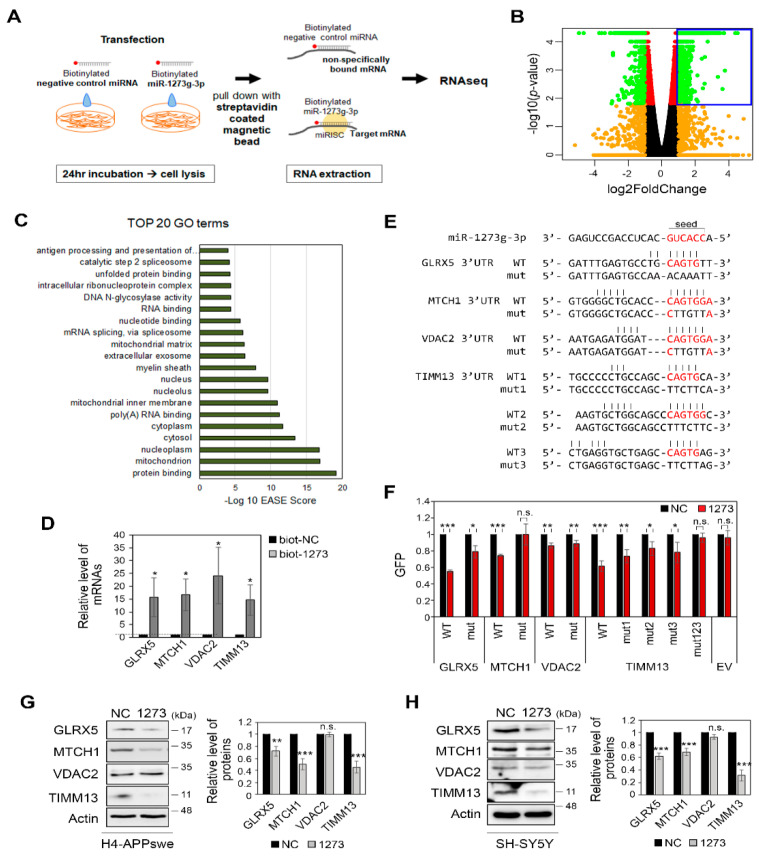
Figure 5.
Identification of target genes for miR-1273g-3p. (A) Experimental scheme of pull-down assays performed using biotinylated-miR-1273g-3p or negative control (miR-cel-39-3p) in H4-APPswe cells. mRNAs interacting with biotinylated-miR-1273g-3p or negative control were pulled down by streptavidin beads and analyzed by high-throughput RNA sequencing (RNAseq). (B) Volcano plot indicates the log2fold change versus the –log10 p-value of the genes that interacted more strongly with biotinylated-miR-1273g-3p relative to the negative control. Blue box indicates 1539 genes whose mRNAs were significantly enriched in pull-down samples of biotinylated-miR-1273g-3p (n = 3, fold change > 2, p > 0.05, Student’s t-test). (C) Top 20 Gene Ontology (GO) terms of the 1539 gene transcripts that interacted with biotinylated-miR-1273g-3p. Bar graph presents the –log10 EASE scores. (D) Validation that the top 4 genes among 192 mitochondrial genes interacted with biotinylated-miR-1273g-3p, as assessed by qPCR analysis of the pull-down samples. Bar graph shows the level of each mRNA relative to the negative control. Data were normalized by GAPDH in the supernatant of each pull-down sample (n = 4). (E) The putative target sequences of miR-1273g-3p in 3′UTRs of GLRX5, MTCH1, VDAC2 and TIMM13. Sequences in 3′UTR of each gene complementary to the seed sequence of miR-1273g-3p (red) were mutated as indicated. (F) Reporter gene assays were performed using WT or mutant GFP reporter vector with the 3′UTRs of GLRX5, MTCH1, VDAC2, and TIMM13. Bar graph shows densitometric results of GFP normalized by actin (n = 3). (G,H) Western blotting for GLRX5, MTCH1, VDAC2, and TIMM13 in H4-APPswe cells (G) (n = 6) and SH-SY5Y cells (H) (n = 5) transfected with miR-1273g-3p mimic or negative control. All data are presented as mean ± SEM. * p < 0.05, ** p < 0.01, *** p < 0.001 (Student’s t-test). biot-NC, biotinylated-negative control; biot-1273, biotinylated-miR-1273g-3p; NC, mimic negative control; 1273, miR-1273g-3p mimic; EV, empty vector; mut, mutant.

