Figure 2.
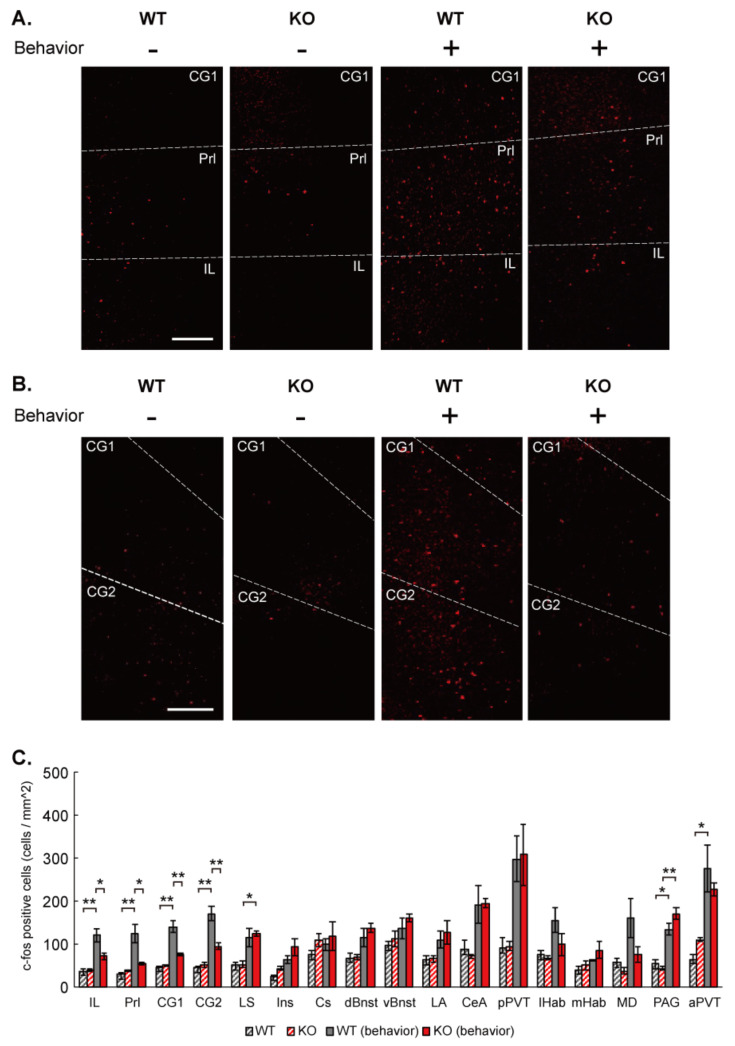
Elevated c-Fos expression in the mPFC by social stimulation is diminished in IQSEC2 KO mice. (A,B) Representative images for c-Fos immunostaining in the brain slices containing mPFC Figure 2. KO (KO) mice with and without imposing social behavior. Scale bar = 0.2 mm. (C) Summary graph for c-Fos expression in wild-type (WT) and IQSEC2 KO (KO) mice with and without imposing social behavior in different brain regions. The number of c-Fos positive neuron/mm2 is shown in the bar graph. c-Fos expression is up-regulated in IL, Prl, CG1, CG2, LS, PAG, aPVT in wild-type mice after social behavior. The up-regulation is diminished in IL, Prl, CG1, CG2. Abbreviations; IL: infralimbic cortex, Prl: prelimbic cortex, CG1: cingulate area 1, CG2: cingulate area 2, LS: lateral septum, Ins: insula, Cs: cingulate sulcus, dBnst: dorsal bed nucleus of the stria terminalis, vBnst: ventral bed nucleus of the stria terminalis, LA: lateral amygdala, CeA: central amygdala, pPVT: posterior paraventricular thalamus, lHaB: lateral habenula, mHaB: medial habenula, MD: medial dorsal thalamus, PAG: periaqueductal gray, aPVT: anterior paraventricular thalamus. Data in the graph are means ± SEM. Statistical analyses were performed by One-way ANOVA followed by Tukey’s post-hoc test (* p < 0.05; ** p < 0.01. Data values used in graphs are shown in Table S3.

