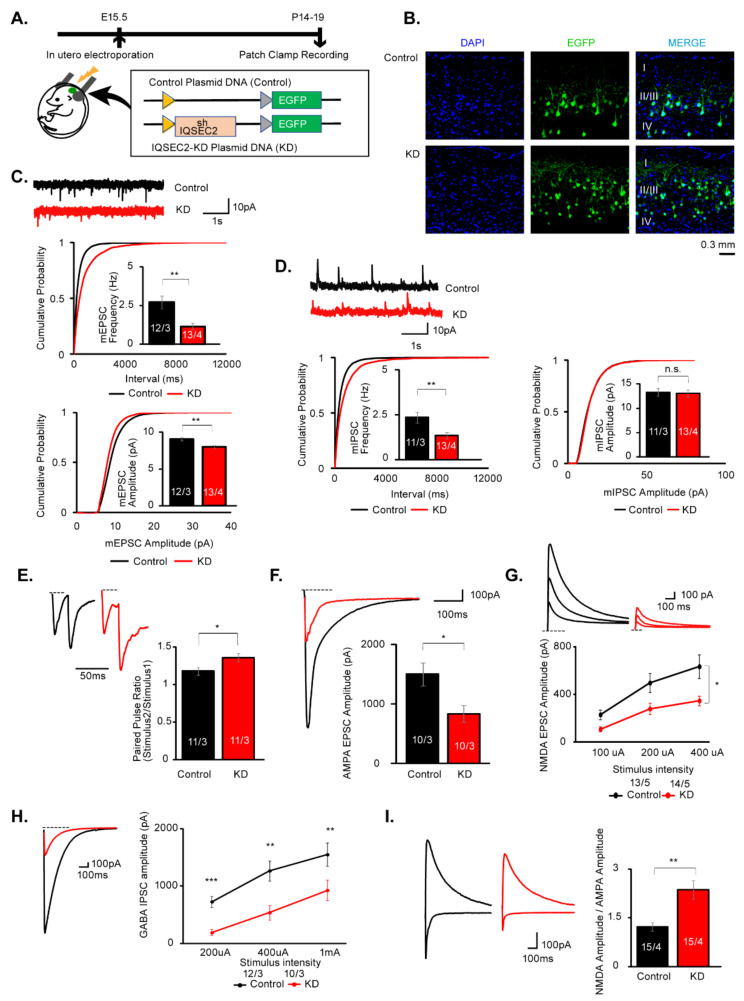
Figure 4.
AMPAR, NMDAR, and GABAR-mediated synaptic transmissions are decreased in IQSEC2 KD pyramidal neurons in layer 2/3 of the somatosensory cortex. (A) Schematic diagrams for the experimental design and plasmid DNAs for Control and IQSEC2-KD used for the IQSEC2 KD experiment. (B) Confocal microscopic images for control and IQSEC2-KD plasmid transfected mouse brain sections. EGFP signals are observed sparsely in pyramidal neurons in layer 2/3 somatosensory cortex. Scale bar = 0.3 mm. (C) Sample traces and summary graphs for mEPSCs in control (Control) and IQSEC2 KD (KD) neurons. Both frequency and amplitude of mEPSCs are decreased in IQSEC2 KD neurons. (D) Sample traces and summary graphs for mIPSCs in control (Control) and IQSEC2 KD (KD) neurons. The frequency, but not amplitude, of mEPSCs is decreased in IQSEC2 KD neurons. (E) Sample traces and summary graph for the paired-pulse ratio of evoked EPSCs in control (Control) and IQSEC2 KD (KD) neurons. The paired-pulse ratio is increased in IQSEC2 KD neurons, suggesting release probability is decreased by suppression of IQSEC2 gene expression. (F) Sample traces and summary graphs for evoked AMPA EPSC in control (Control) and IQSEC2 KD (KD) neurons. The amplitude of evoked AMPA EPSC is decreased in IQSEC2 KD neurons. (G) Sample traces and summary graph for evoked NMDA EPSC in control (Control) and IQSEC2 KD (KD) neurons. The amplitude of evoked NMDA EPSC is decreased in IQSEC2 KD neurons. (H) Sample traces and summary graph for evoked GABA IPSC in control (Control) and IQSEC2 KD (KD) neurons. The amplitude of evoked GABA IPSC is decreased in IQSEC2 KD neurons. (I) Sample traces and summary graph for the NMDA/AMPA ratio in wild-type (WT) and IQSEC2 KD (KD) neurons. The NMDA/AMPA ratio is significantly increased in IQSEC2 KD neurons. Data are means ± SEM (numbers of neurons/independent animals examined are shown in graphs). Statistical analyses were performed by Student’s t-test (* p < 0.05; ** p < 0.01; *** p < 0.001; n.s. = not significant). Data values used in graphs are shown in Table S2.

