

Abstract
Single-cell RNA sequencing (scRNA-Seq) is an emerging strategy for characterizing immune cell populations. Compared to flow or mass cytometry, scRNA-Seq could potentially identify cell types and activation states that lack precise cell surface markers. However, scRNA-Seq is currently limited due to the need to manually classify each immune cell from its transcriptional profile. While recently developed algorithms accurately annotate coarse cell types (e.g. T cells versus macrophages), making fine distinctions (e.g. CD8+ effector memory T cells) remains a difficult challenge. To address this, we developed a machine learning classifier called ImmClassifier that leverages a hierarchical ontology of cell type. We demonstrate that its predictions are highly concordant with flow-based markers from CITE-seq and outperforms other tools (+15% recall, +14% precision) in distinguishing fine-grained cell types with comparable performance on coarse ones. Thus, ImmClassifier can be used to explore more deeply the heterogeneity of the immune system in scRNA-Seq experiments.
Keywords: deep learning, immune cell classification, machine learning, single-cell RNA-Seq
Introduction
Single-cell RNA sequencing (scRNA-Seq) has emerged as a powerful technique to catalog cell types [1–3], including immune cells, that play critical roles in a wide range of diseases. In cancer, they have been shown to impact survival, drug resistance and evolution [4, 5]. However, annotation of the cells based on their transcriptional profiles remains a challenge [6, 7] due both to the diversity of cell types as well as ambiguous distinctions along the developmental lineage and activation states [8]. That is, while myeloid and lymphoid cells have drastically different transcriptional profiles and are trivial to distinguish, the differences within each lineage are more subtle. For instance, specific types of T cells are difficult to identify [9].
Currently, the most commonly used approach to annotate cell types is to start with an unsupervised clustering algorithm (like t-SNE [10] or UMAP [11]) to group cells with similar profiles, and then to manually inspect each cluster for the expression of marker genes that distinguish specific cell types [12]. While conceptually straightforward, using these markers is challenging in practice due to poor expression or dropout [13, 14], low conservation of markers across studies [15], ambiguity of markers [16], lack of reliable markers [17] and transcriptional similarity of cell types [18]. Further, cell type annotations are not yet easily transferred between different datasets, and therefore, each dataset needs to be manually annotated by experts with an understanding of both immunology and the idiosyncrasies of scRNA-Seq data. As a final complication, cell type annotation is an iterative procedure where the clustering influences the immune cell classifications, which then reveals discrepancies (e.g. a memory T cell cluster that contains both CD4+ and CD8+ T cells) that need to be resolved by refining the clusters (e.g. by clustering with different genes) [19].
To simplify and automate the process of identifying cell types, several bioinformatics methods have recently been developed. Correlation-based methods such as scmap [20] and SingleR [21] correlate the query cells to a predefined set of reference cell types and assign the label of the type with maximum correlation. Hierarchy-based methods such as Garnett [22] and CHETAH [23] construct a reference cell type hierarchy and search for the optimal cell type from a generic root node to increasingly more specific types. CellAssign [24] utilizes a Bayesian statistical framework to model cell types, marker gene expression and other covariates such as processing batches. SCINA [25] trained a semi-supervised model that adopts an expectation–maximization algorithm using predefined gene signatures. SciBet [26] used an E-test to select cell type markers from training datasets and constructed pretrained models to predict query cells with maximum likelihood estimation. While these methods have been successful and some quickly adopted into scRNA-Seq pipelines, approaches with improved ability in identifying fine-grained cell types are still needed.
To increase prediction accuracy on fine-grained cell types, we have developed a method that includes an explicit knowledge-based and hierarchical model of immune cell types. ImmClassifier (Immune cell Classifier) integrates the biology of immune cells from a hierarchical ontology and synthesizes heterogeneous reference datasets using a two-step machine learning and deep learning process. Using each reference dataset, the first step trains a random forest classifier to assign probabilities according to the cell types of the dataset, which preserves the intra-dataset cell type relations and avoids batch effects when pooling the cells from different reference datasets. To resolve the differences in reference annotations, cell types from all reference datasets were mapped to a unified and nonredundant cell ontology hierarchy. The second step employs a deep learning approach to integrate numerous reference datasets and directly learn the cell ontology hierarchy, assigning the optimal annotation based on the distribution of probabilities across the hierarchy. This enables ImmClassifier to synthesize cell type assignments across reference datasets. Evaluating on a number of independent scRNA-Seq datasets and against CITE-Seq, ImmClassifier accurately classified and outperformed existing methods over a range of immune cells collected from different tissues. ImmClassifier is available as a Docker container at https://github.com/xliu-uth/ImmClassifier.
Materials and methods
ImmClassifier
An outline of ImmClassifier is shown in Figure 1a. ImmClassifier employs a machine learning paradigm that takes as input a vector of the expression of n genes of a cell and returns an m length vector of the probabilities that the cell is from one of the m cell types. However, it also deviates from a classical machine learning setup to handle the complexity of the immune cell types and resultant idiosyncrasies in the training sets. Because no single training set includes all desired cell types, multiple ones must be integrated. Furthermore, the cell type labels are frequently inconsistent, using not only different labels, but also labeling at different granularities of the cell type hierarchy. For example, Zheng et al. [27] classified T cells into αβ and γδ T cells, Azizi et al. [8] , Hay et al. [28] and Oetjen et al. [29] classified T cells as CD4+ and CD8+ T cells and Zilionis et al. [19] labeled T cells by numeric cluster ID, without an explicit cell type. To resolve these differences, ImmClassifier takes a stepwise approach where independent classifiers are developed for each training set, and the outputs for each training set are resolved by a final classifier that determines the ultimate cell type assignment. Specifically, the input goes through a random forest classifier for each training set (currently, seven). The output matrices are concatenated and processed by 10 independently trained deep neural network (DNN) classifiers so that a robust estimate of the average performance can be estimated. The mean and standard deviation of the scores for each query cell in each cell type were calculated and projected to a cell ontology hierarchy. The cell type with maximum entropy change, relative to its child nodes, was assigned to each query cell.
Figure 1 .
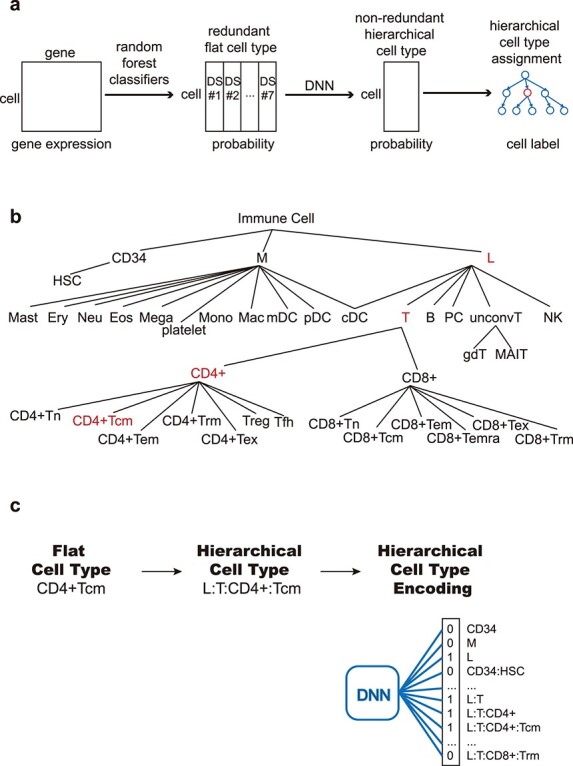
ImmClassifier Architecture. (a) ImmClassifier takes a matrix containing the gene expression of immune cells from a single-cell RNA-Seq experiment (far left). Using feature genes pre-calculated from multiple training datasets, ImmClassifier predicts the probability that each cell corresponds to a cell type annotated in the original training datasets using random forest models (mid left). Here, ‘DS #1’ refers to the first training dataset. This probability matrix is further converted to a hierarchical cell type probability matrix using DNN classifiers. The mean and standard deviation of probabilities from the DNN models is incorporated into a cell ontology hierarchy. Traversing the cell ontology hierarchy, the cell type with maximum entropy change is assigned. (b) Depiction of the cell types derived from the EBI Cell Onotology to enable machine learning probabilities. Types of immune cells are represented according to granularity, from coarse cell types at the root, to fine-grained ones in the leaf nodes. There are 37 cell types in all. (c) Each flat cell type is converted to hierarchical cell type based on the path from root to the flat cell type. The hierarchical cell type is encoded in a 37-bit binary vector by marking the flat cell types on the path 1 and 0 otherwise. The binary vector is used as a target in the DNN training and output in prediction.
Reference datasets
To address the heterogeneity of immune cell types and sequencing platforms, seven independent scRNA-Seq datasets covering a wide range of cell types, sources and sequencing platforms were used for training (Table S1). Seven independent test datasets were used. Each reference dataset was divided into a training set and a test set. The reference datasets are normalized to logarithm of counts per million reads (log2 CPM). Nonimmune cells were excluded.
Dataset-specific classification
Feature genes are obtained for each reference dataset. If the cluster-associated marker genes are provided by the original publication, the top 20 marker genes are used, since this was previously shown to work well across a number of algorithms [30] . Otherwise, the cell type markers are called by Seurat [31] using the gene expression count and provided cell type annotations. To account for dropout in scRNA-Seq data, only genes expressed in the query dataset are used. To reduce the bias introduced by cluster size, a balanced training set is generated by randomly selecting 500 cells per cell type (without replacement for abundant cell types (>1000 cell) and with replacement for rare cell types (<1000 cell)). Batch correction is performed between the query dataset and a reference dataset on feature genes using ComBat [32]. The original cell type labels from the reference dataset were used as the target variable. A random forest classifier is trained using default parameters and evaluated for each reference dataset using MLR [33].
Hierarchical immune cell annotations
To integrate annotations and resolve differences across datasets, we developed a hierarchical set of cell types (Figures 1b, S1 and Table S2). The cell types are found from Ontobee [34] (matching based on names and marker genes) and organized using the EBI Cell Ontology [35]. In this hierarchy, the top or root node represents the coarsest cell type, and successive levels describe increasingly finer ones. More precisely, child nodes are related to their parents via ‘is-a’ relationships. This provides a framework to synthesize annotations from the reference datasets provided at different levels of granularity. Using this hierarchy, the 171 cell types (including redundancies) from the seven reference datasets are unified to a set of 37 nonredundant and hierarchical cell types (Figure S1).
Integrating annotations using a DNN
We predict the types in the hierarchy as a multi-class classification problem, leveraging the ability of DNNs to learn complex structure [36]. Cells were subsampled per cell type to avoid the dominance by cell number (Table S3). For each cell, the input layer takes the concatenation of the probability vectors from the dataset-specific classifiers and the output layer returns a vector of 37 probabilities associated with hierarchical cell types (Figure 1c). The position of each cell type in the hierarchy is encoded as a 37-bit vector that traces the path from the cell type to the root. We performed 3-fold cross-validation to evaluate the hyper-parameters (Figure S2). Based on the cross-validation, the number of nodes in hidden layers were set to 200, 400 and 200, respectively, and the dropout rate is 0.2, a topology that worked well in the training set (Figure S2a). The DNN is implemented as a multi-label multi-class classification model using keras [37] and tensorflow [38]. We used 10 trained DNN classifiers (epochs = 5 and batch_size = 4096) with identical hyper-parameters to estimate the mean and standard deviation of the probabilities for the cell types. To assess the impact of the number of classifiers on the accuracy, we tested classifiers with 1–10 DNNs by cross-validation on the training dataset (Figure S2b). The F1 score increased with the number of DNNs and reached a plateau at about five.
Hierarchical cell type assignment
The deep level classes are more ambiguous and harder to distinguish. Reflecting this uncertainty, the predicted probabilities of the correct cell type drop drastically deeper down the hierarchy. However, despite the lower absolute probabilities, they can still distinguish the correct cell type, and thus are still helpful. Therefore, rather than choosing the cell type with the highest probability (which will favor the top of the hierarchy), the task is to choose a cell type that has a reasonably high probability for its depth. To accomplish this, we compare the probabilities of each cell type against those of its siblings (on the same level), and select the sibling with the highest probability. This yields a set of cell types across the hierarchy that has relatively high probability for their depth. Then, to choose the best cell type among those, intuitively, we desire the one that has the highest probability relative to its descendants. We found empirically that this can be quantified using the change in entropy, which has an advantageous property in that it favors cell types where the descendants have probabilities close to zero. In detail, for each node (cell type) c on the cell type hierarchy, the entropy is calculated as [39, 40, 41, 42]:
 |
where p is the mean probability of that the query cell belongs to cell type c from the 10 DNN models above. Entropy is 0 when p equals to 0, by definition.
We calculated the entropy change as:
 |
where c is the cell type and desc(c) is the set of child nodes of c. To penalize for leaf nodes, we applied a pseudo child with probability equal to the mean of probability across the 37 cell types to each leaf node when the entropy change is calculated. To break ties in ranking, the cell type with the smallest ratio of standard variation to mean is chosen.
Cell type prediction tools
We ran SingleR [43] using default parameters, except using normalize.gene.length = T when analyzing data with full length transcript sequencing. We ran Garnett [22] in extended mode using the hsPBMC pretrained classifier. We ran the SCINA [25] R package using its pre-compiled immune cell signatures from RCC patients. We generated SciBet [26] annotations online using its pre-compiled 30 major human cell types. The ImmClassifier annotation was generated using default parameters. Annotations were mapped across algorithms, as shown in Table S4.
UMAP clustering and alluvial plots
The spatial coordinates of the cells were obtained using UMAP for each of the four test datasets (brca3p, brca5p, hcc and pbmc68k in Table S5). The UMAP clustering of test datasets was performed using BETSY [44]. For dataset brca3p, brca5p and hcc, the top 500 most variable genes were used for PCA. Top 1000 most variable genes were chosen for dataset pbmc68k. Top 10 principle components, the nearest 50 neighbors and resolution = 0.8 were used to generate the tSNE-plots. Alluvial plots were generated using ggalluvial [45].
Results
ImmClassifier predicts immune cell populations
We developed a computational tool ImmClassifier to annotate immune cells in gene expression data (Methods, Figure 1). We evaluated the performance of ImmClassifier on three test datasets (not included in the training) [18, 46, 47]. We first calculated the recall and precision and used F1 score, which is the weighted average of precision and recall to demonstrate the overall performance. We began by analyzing the microarray profiles of purified cell populations, which lacks some of the technical challenges, such as dropout, that would be seen in the scRNA-Seq data. In this situation, ImmClassifier recovered 12 out of 15 original cell types and distinguished CD4 from CD8 T cells accurately, recovering 100% of CD4 T cells and 92% of CD8 T cells. 81% of the cells identified under the CD4 T hierarchy were CD4 T cells in the original annotation (Figure 2a). A more challenging situation was seen in the myeloid lineage, where there was less overall coverage in the reference datasets. None of the five eosinophil samples were identified exactly as eosinophils, although three were correctly placed in the myeloid lineage (monocytes and dendritic cells). It is likely that greater coverage of this cell type will be needed to improve its accuracy.
Figure 2 .
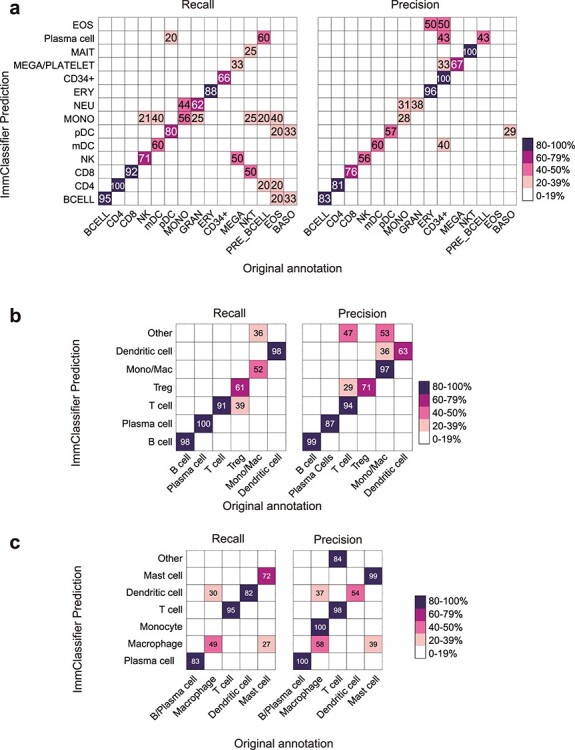
ImmClassifier predicts immune cell types. These heatmaps compare the cell types from the original publication (rows) to those inferred by ImmClassifier (columns). The color represents the recall and precision score (as a percent) of each original cell type predicted by ImmClassifier. Recall and precision scores no less than 20 are labeled. Three datasets tested are (a) purified immune populations sequenced by microarray platform [18]. (b) SKCM [46]. The Other row includes a small number of cells predicted to cell types not included the original annotated ones. (c) HNSCC [47]. The Other row includes a small number of cells predicted to cell types not included the original annotated ones. Since ImmClassifier has finer annotation granularity than the original annotation, for the purpose of comparison, the annotation terms of equivalent granularity to the original annotation were used.
To assess its ability to classify scRNA-Seq data, we ran ImmClassifier on tumor-infiltrating immune cells from two distinct cancer types. ImmClassifier achieved an overall precision of 85% and 82% (Figure 2b and c). Again, the highest rate of misclassification was made across closely related lineages. 30% of the macrophages were predicted to be dendritic cells (Figure 2c), which highlights the challenges in distinguishing closely related cell types.
To assess the performance of ImmClassifier using existing tools as baseline, we also tested two recent tools SCINA [25] and SciBet [26] that can accept normalized expression data as input since only normalized expression data are available for the three test datasets. We chose SCINA as it was shown to have the overall best performance in a comparison of 22 methods [30], and SciBet as it was a recently developed approach that benchmarked well against prior methods. Here, both SCINA and SciBet showed less concordance with original publication than ImmClassifier in all three datasets (Figures 2 and S3). In addition, SCINA left 95% plasma cells unlabeled (Figure S3b), while SciBet falsely assigned 3, 5 and 1 nonimmune cell types to the three immune datasets (Figure S3).
ImmClassifier better recovers fine-grained immune cell types
To further determine whether the performance we observe is comparable to related methods, we compared ImmClassifier against Garnett (extended mode) [22], SingleR [21], SCINA [25] and SciBet [26], which are commonly used representatives for the hierarchy- and correlation-based methods. We applied each method to four scRNA-Seq datasets from three independent publications and visualized the predictions using UMAP clustering. These four datasets cover a variety of sequencing specifications including InDrop 3′ sequencing, 10X 5′ sequencing, 10X 3′ sequencing, Smart-Seq2 Full-length (Table S5). In addition, those datasets covered a wide range of immune populations, collected from cancer patients and healthy donors.
We first quantified the performance of those methods by recall and precision for four different depths across our cell hierarchy (Figure 3a). (Finer cell types are at greater depth). Across all conditions, recall and precision decrease with increasing depth, reflecting the difficulty in distinguishing closely related cell types. For coarse cell types (e.g. myeloid versus lymphoid cells) (depth 1), all methods performed well with ImmClassifier, and SingleR achieved over 95% performance overall. However, the performance dropped with finer types (depth 4) (e.g. central versus effector memory T cells). ImmClassifier achieved an average precision of 88%, 76%, 62% and 30% for depths 1–4, respectively. At depths 1–2, the recall was comparable to that of SingleR, with only a +4% difference (Figure 3b). However, at depths 3–4, the recall was improved by +15%. The difference in precision followed a similar pattern, with a +3% difference at depths 1–2, and a +14% at depths 3–4. Thus, while all methods performed well with coarse cell types, ImmClassifier was considerably more accurate at higher depths, although challenges still remain.
Figure 3 .
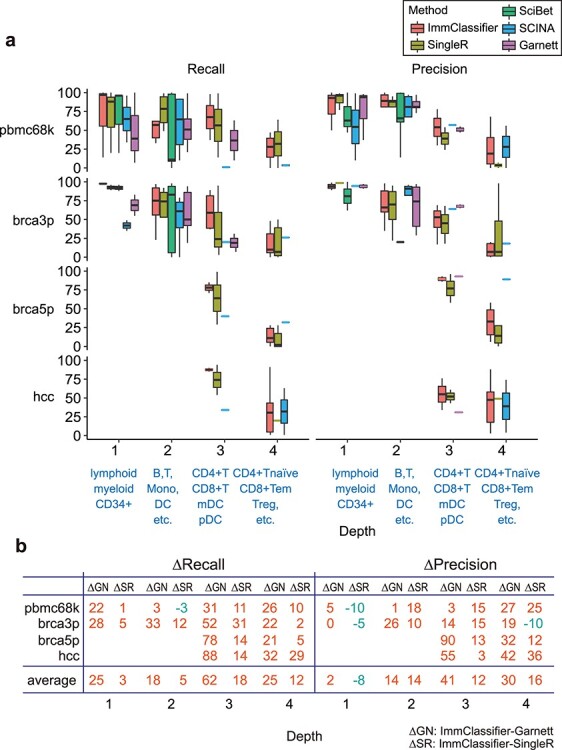
Classification accuracy at different annotation granularities. (a) These boxplots show the recall and precision score across cell types, organized by depth. Depth 1 includes CD34+, M and L; depth 2 includes Dendritic, Macrophage, Monocyte, Neutrophil, Mast, T, NK, B; depth 3 includes CD4 + T, CD8+ T, mDC, pDC and depth 4 includes CD4 + Tn, CD4 + Tcm, CD4 + Tem, CD4 + Tex, CD4+ Treg, CD4+ Tfh, CD8 + Tn, CD8 + Tcm, CD8 + Tem, CD8 + Tex and MAIT. (b) This table shows the average of performance ImmClassifier compared to Garnett and SingleR. The median value of F1 score across different cell types at each depth for each method was calculated. The difference of median F1 score (∆SR, ∆GN) between ImmClassifier and Garnett and SingleR, respectively, was calculated. Comparisons in which ImmClassifier has higher accuracy are shown in red, and those with lower accuracy are blue.
We also compared the methods with respect to (1) spatial concordance with original annotation, (2) frequency of matched and mismatched cell types to the original annotation and (3) the distance between the centroids of the predicted and original cell types. We used a dataset comprised of a complex mixture of 12 immune cell types, including lymphoid and myeloid cells collected from four tissues [8]. Here, ImmClassifier achieved a higher mean recall and precision across all cell types (62.4% and 57.3%) than SingleR (44.9% and 54.8%), Garnett (28.7% and 42.3%) and SciBet (54.4% and 20.2%) with high visual concordance to original annotations in a UMAP plot (Figure 4a). SCINA (49.2% and 72.5%) has a higher mean precision than ImmClassifier on the labeled cells, however, SCINA left the 49% of query cells unlabeled (Figure 4a). Overall, ImmClassifier, SingleR and Garnett have higher concordance with the original publication than SCINA and SciBet. To assess the overall similarity of the expression profiles of each predicted cell type, we averaged the expression profiles of all cells of each type and computed the Euclidean distance between the averaged profiles with those of the original cells (Figure 4b). This revealed that the overall profiles of the cell types from ImmClassifier were most similar to those of the original data type. Furthermore, ImmClassifier could recover 11 of the 12 cell types, in contrast to SingleR (eight cell types, Figure 4b and c), Garnett (six cell types), SCINA (seven cell types) and SciBet (five cell types). Notably, ImmClassifier was able to distinguish a mast cell population (70% recall, 61% precision), which was missed by the other methods (Figure 4a, c). However, all methods failed to identify the cluster of NKT cells. This cell type was missing from the ImmClassifier training set, and both ImmClassifier and SingleR annotated them as a mix of NK cells and T cells (Figure 4c). Nevertheless, this demonstrates ImmClassifier’s ability to capture a broader range of cell types, and thus more accurately recapitulate the complexity of the immune cell types.
Figure 4 .
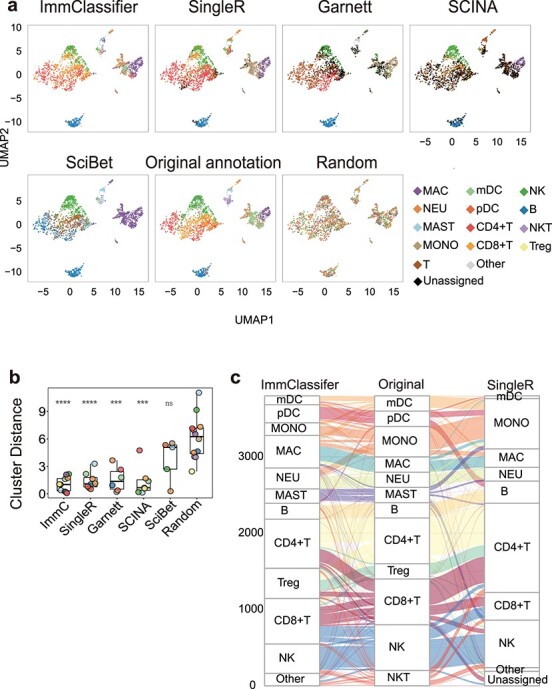
Visualization of brca3p dataset by different annotation methods. For visualization, abundant cell populations (cell number > 200) were subsampled to 200 per cell type. The mapping IDs of cell types between different annotations is listed in Table S4. If the annotation method produces a finer annotation than the original one, the annotation terms of equivalent granularity were used. (a) UMAP plots colored by annotation method. In the first row (left to right), the panels are colored by ImmClassifier, SingleR, Garnett and SCINA. In the second row (left to right), panels are colored by SciBet, original publication and after random shuffling. (b) Boxplots of the Euclidean distance between centroids of predicted annotations and original annotations. P-values are by Wilcoxon test. The significance of P-values is shown as ** (<0.01), *** (<0.001) and **** (<0.0001). (c) Alluvial plots connect the original annotated cell types to cell types annotated by ImmClassifier (left) and SingleR (right).
ImmClassifier can predict cell types annotated by immunophenotyping
A limitation in the prior evaluation datasets is that the cell types were annotated manually based on the gene expression, and thus could suffer from errors due to the difficulties in extracting or interpreting the profiles of each cell or cluster of cells. Therefore, to further evaluate ImmClassifier, we compared the predictions on CITE-seq datasets, where the identities of cells are annotated based on cell surface protein markers that are co-captured simultaneously with the transcriptomes. We applied ImmClassifier and SingleR on a CITE-seq dataset [3] comprised of 5559 cells from the peripheral blood of a healthy individual. We predicted the cell types from the gene expression profiles using ImmClassifier and SingleR, and compared against the annotation determined by the expression of cell surface protein markers in the original publication. This revealed that ImmClassifier and SingleR were both able to dissect major cell types (Figure 5a).
Figure 5 .
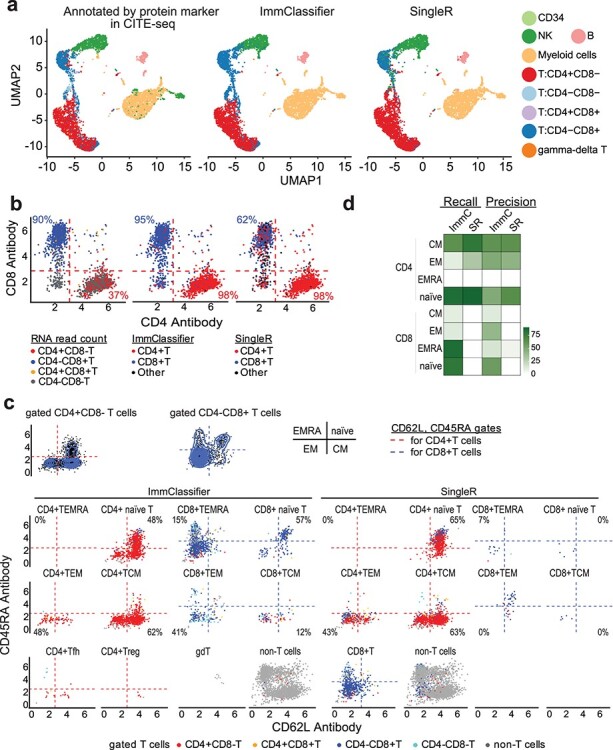
Evaluation of ImmClassifier on CITE-seq data. (a) UMAP plots colored by cell type predictions. The UMAP coordinates are from the original publication. From left to right, the panels are colored by gated annotation (cell surface protein marker) in the original publication, predictions from ImmClassifier and predictions from SingleR. (b) Scatterplot of gated T cells in the original publication colored by CD4 and CD8 RNA expression (left panel). The percentage of CD4 + CD8- T cells that have positive CD4 RNA read count is labeled in red. The percentage of CD4-CD8+ T cells that have positive CD8 RNA read count is labeled in blue. Scatterplot of gated T cells in the original publication colored by ImmClassifier (middle panel) and SingleR (right panel). The percentage of CD4 + CD8- T cells that have has been predicted to be CD4+ T cells by ImmClassifier/SingleR is labeled in red. The percentage of CD4-CD8+ T cells that have been predicted by CD8+ T cells by SingleR/ImmClassifier is labeled in blue. (c) Visualization of the prediction of fine-grained T cells. CD4 and CD8 T cells were gated into EMRA, naïve, EM and CM immunophenotypes in the original publication. Top panel: density plots of the gated CD4 + T and CD8 + T cells in the original publication. Bottom panel: scatterplots of the cells in each predicted cell type by ImmClassifier and SingleR. The precision of each fine-grained T cell population is labeled at the corresponding quadrant. The cells in the scatterplots are colored by gating in the original publication. (d) Heatmap showing the recall and precision of ImmClassifier and SingleR prediction of the fine-grained T cells.
Next, we evaluated the ability of the algorithms to distinguish CD4+ from CD8+ T cell. We started by partitioning the cells based on CD4 and CD8 protein expression into CD4 + CD8-, CD4-CD8+, CD4 + CD8+ and CD4-CD8- groups. When compared against the gene expression of CD4 and CD8, only 37% CD4+ and 90% CD8+ T cells can be categorized using the RNA expression of CD4 and CD8 alone due to high rates of dropout. 98% CD4+ and 62% CD8+ T cells were correctly assigned using SingleR. However, using ImmClassifier, 98% CD4+ and 95% CD8+ T cells were correctly categorized (Figure 5b).
Besides categorizing CD4+ and CD8+ T cells, it is also important to distinguish fine T cell types. In [3], T cells were gated by cell surface markers CD62L and CD45RA into effector memory T cells re-expressing CD45RA (EMRA), naïve, central memory (CM) and effector memory (EM) phenotypes. We calculated the percentage of cells predicted by ImmClassifier that were identical to the gated annotation. CD4 + TEMRA cells were not categorized since they were not found in the training datasets of ImmClassifier. In five out of seven fine-grained T cell types including CD4 + T naïve, CD4 + TEM, CD4 + TCM, CD8 + naïve and CD8 + TEM, the majorities of cells (53%, 53%, 65%, 69% and 62%) were consistent with the gated annotation (Figure 5c).
Finally, we compared the recall and precision of ImmClassifier with SingleR on these fine-grained T cell types (Figures 5 and S4). ImmClassifier achieved +18% mean recall and +17% mean precision over SingleR and had a better distinction of all four fine-grained CD8 cell types. In summary, the evaluation of ImmClassifier on CITE-seq further validates its capacity to dissect fine-grained T cell types.
Discussion
Despite the need for improved annotations of immune cells in scRNA-Seq data, it remains a challenging problem, in particular for cells closely related in the developmental lineage. To address this challenge, the use of a cell type hierarchy has emerged as a critical component in the latest cell type annotation tools. For example, while Garnett is hierarchical, it uses a pairwise classification strategy that does not consider information across the overall ontology, which has been shown in other contexts to improve accuracy [48, 49]. This is in contrast to ImmClassifier, which uses a deep learning framework to model the whole hierarchy and assign the probabilities considering information across all cell types simultaneously, which appears to improve the performance at deeper levels of granularity.
The main advantage of ImmClassifier over existing tools is the breadth and accuracy of the predictions across the range of cells, in particular the improvements seen in fine-grained cell types. While an understanding of the coarse populations of immune cells is a clear first step, knowing the fine-grained identities (such as CD4+ versus CD8+ T cells) is critical for understanding how the immune system is actually functioning. While the prediction power on fine-grained cell types is not yet perfect, we hope that this study impels the development of datasets and algorithms that can achieve this goal. As another limitation of this approach, ImmClassifier cannot detect new and intermediate cell types. ImmClassifier is trained on known cell types and will assign a cell of an unobserved type to its closest known reference cell type. This limitation will need to be addressed in future work. To allow identification of intermediate cell types, the continuous distribution of probabilities that ImmClassifier generates in its intermediate step may be informative. But perhaps most importantly, as well-annotated scRNA-Seq datasets grow, new reference cell types may be integrated naturally within the architecture of ImmClassifier.
We anticipate that the performance of ImmClassifier will continue to increase as additional high-quality datasets become available. Indeed, our results demonstrate the need for a greater quantity and quality of annotated immune cell dataset, especially with fine-grained cell types, to train this and other classifiers. The ImmClassifier framework is scalable to new reference datasets, with the most difficult step in mapping the original annotations to the cell hierarchy. We anticipate that ImmClassifier will be most useful in experimental settings that require accurate, comprehensive and robust immune cell annotation.
Key Points
In silico cell annotation can overcome the limitations of traditional methods such as flow or mass cytometry.
We developed a new computational tool called ImmClassifier to annotate immune cells in single-cell RNA-Seq data at a fine-grained level.
ImmClassifier leverages the known cell hierarchy and is trained on large-scale single-cell RNA-seq datasets via deep learning.
Using CITE-Seq and single-cell RNA-Seq datasets as gold standards, ImmClassifier outperforms other tools in predicting fine-grained cell types.
Supplementary Material
Acknowledgements
We thank the members of the Chang and Bild labs for helpful discussions and testing of ImmClassifier.
Xuan Liu is a research scientist at University of Texas Health Science Center at Houston whose expertise is in bioinformatics and machine learning.
Sara J.C. Gosline is a data scientist at Sage Bionetworks who studies on Neurofibromatosis and building communities in rare diseases.
Lance T. Pflieger is a researcher in the Department of Medical Oncology and Therapeutics at City of Hope whose expertise is in bioinformatics.
Pierre Wallet is a researcher ain the Department of Medical Oncology and Therapeutics at City of Hope whose work focuses on immune cells.
Archana Iyer is a researcher at Memorial Sloan Kettering Cancer Center whose expertise are immunology and system biology.
Justin Guinney is Vice President of the Computational Oncology group at Sage Bionetworks. He is an expert at large-scale analysis of genomic data.
Andrea H. Bild is a professor in the Department of Medical Oncology and Therapeutics at City of Hope who is specialized in genomics and cancer cell biology.
Jeffrey T Chang is an associate professor and CPRIT scholar at University of Texas Health Science Center at Houston whose expertise is in genomics, bioinformatics and cancer biology.
Contributor Information
Xuan Liu, Department of Integrative Biology & Pharmacology, University of Texas Health Science Center at Houston, Houston, TX 77030, USA.
Sara J C Gosline, Sage Bionetworks, Seattle, WA 98109, USA.
Lance T Pflieger, Department of Medical Oncology & Therapeutics Research, City of Hope National Medical Center, Duarte, CA 91010, USA.
Pierre Wallet, Department of Medical Oncology & Therapeutics Research, City of Hope National Medical Center, Duarte, CA 91010, USA.
Archana Iyer, Center for Cancer Systems Immunology, Memorial Sloan Kettering Cancer Center, New York, NY 10065, USA.
Justin Guinney, Sage Bionetworks, Seattle, WA 98109, USA.
Andrea H Bild, Department of Medical Oncology & Therapeutics Research, City of Hope National Medical Center, Duarte, CA 91010, USA.
Jeffrey T Chang, Department of Integrative Biology & Pharmacology, University of Texas Health Science Center at Houston, Houston, TX 77030, USA.
Data Availability Statement
ImmClassifier, the scripts and data required to reproduce this work are available at https://github.com/xliu-uth/ImmClassifier.
Author contributions
Conceptualization, X.L. and J.T.C.; Methodology, X.L., S.J.C.G, L.T.P., P.W., A.I. and J.T.C.; Data Curation, X.L.; Investigation, X.L.; Software, X.L. and S.J.C.G.; Writing – Original Draft, X.L.; Writing – Review & Editing, all authors; Supervision, J.G., A.H.B. and J.T.C.; Funding Acquisition, A.H.B. and J.T.C.
Funding
This work was supported by the National Institutes of Health [U54CA209978]; and the Cancer Prevention and Research Institute of Texas [RP170668]. The content is solely the responsibility of the authors and does not necessarily represent the official views of the National Institutes of Health.
References
- 1. Svensson V, Vento-Tormo R, Teichmann SA. Exponential scaling of single-cell RNA-seq in the past decade. Nat Protoc 2018;13:599–604. [DOI] [PubMed] [Google Scholar]
- 2. Heath JR, Ribas A, Mischel PS. Single-cell analysis tools for drug discovery and development. Nat Rev Drug Discov 2016;15:204–16. [DOI] [PMC free article] [PubMed] [Google Scholar]
- 3. Pont F, Tosolini M, Gao Q, et al. Single-cell virtual cytometer allows user-friendly and versatile analysis and visualization of multimodal single cell RNAseq datasets. NAR Genom Bioinform 2020;2:lqaa025. [DOI] [PMC free article] [PubMed] [Google Scholar]
- 4. Gajewski TF, Schreiber H, Fu Y-X. Innate and adaptive immune cells in the tumor microenvironment. Nat Immunol 2013;14:1014–22. [DOI] [PMC free article] [PubMed] [Google Scholar]
- 5. Taube JM, Klein A, Brahmer JR, et al. Association of PD-1, PD-1 ligands, and other features of the tumor immune microenvironment with response to anti-PD-1 therapy. Clin Cancer Res 2014;20:5064–74. [DOI] [PMC free article] [PubMed] [Google Scholar]
- 6. Papalexi E, Satija R. Single-cell RNA sequencing to explore immune cell heterogeneity. Nat Rev Immunol 2018;18:35–45. [DOI] [PubMed] [Google Scholar]
- 7. Tirosh I, Izar B, Prakadan SM, et al. Dissecting the multicellular ecosystem of metastatic melanoma by single-cell RNA-seq. Science 2016;352:189–96. [DOI] [PMC free article] [PubMed] [Google Scholar]
- 8. Azizi E, Carr AJ, Plitas G, et al. Single-cell map of diverse immune phenotypes in the breast tumor microenvironment. Cell 2018;174:1293–1308.e36. [DOI] [PMC free article] [PubMed] [Google Scholar]
- 9. Jameson SC, Masopust D. Understanding subset diversity in T cell memory. Immunity 2018;48:214–26. [DOI] [PMC free article] [PubMed] [Google Scholar]
- 10. Maaten L v d, Hinton G. Visualizing data using t-SNE. J Mach Learn Res 2008;9:2579–605. [Google Scholar]
- 11. McInnes L, Healy J, Melville J. Umap: uniform manifold approximation and projection for dimension reduction. arXiv 2018. https://arxiv.org/abs/1802.03426.
- 12. Kiselev VY, Andrews TS, Hemberg M. Challenges in unsupervised clustering of single-cell RNA-seq data. Nat Rev Genet 2019;20:273–82. [DOI] [PubMed] [Google Scholar]
- 13. Kharchenko PV, Silberstein L, Scadden DT. Bayesian approach to single-cell differential expression analysis. Nat Methods 2014;11:740–2. [DOI] [PMC free article] [PubMed] [Google Scholar]
- 14. Stoeckius M, Hafemeister C, Stephenson W, et al. Simultaneous epitope and transcriptome measurement in single cells. Nat Methods 2017;14:865–8. [DOI] [PMC free article] [PubMed] [Google Scholar]
- 15. Nirmal AJ, Regan T, Shih BB, et al. Immune cell gene signatures for profiling the microenvironment of solid tumors. Cancer Immunol Res 2018;6:1388–400. [DOI] [PubMed] [Google Scholar]
- 16. Boesch M, Cosma A, Sopper S. Flow cytometry: to dump or not to dump. J Immunol 2018;201:1813–5. [DOI] [PubMed] [Google Scholar]
- 17. Godfrey DI, Hammond KJ, Poulton LD, et al. NKT cells: facts, functions and fallacies. Immunol Today 2000;21:573–83. [DOI] [PubMed] [Google Scholar]
- 18. Novershtern N, Subramanian A, Lawton LN, et al. Densely interconnected transcriptional circuits control cell states in human hematopoiesis. Cell 2011;144:296–309. [DOI] [PMC free article] [PubMed] [Google Scholar]
- 19. Zilionis R, Engblom C, Pfirschke C, et al. Single-cell transcriptomics of human and mouse lung cancers reveals conserved myeloid populations across individuals and species. Immunity 2019;50:1317–1334.e10. [DOI] [PMC free article] [PubMed] [Google Scholar]
- 20. Kiselev VY, Yiu A. Hemberg M. scmap: projection of single-cell RNA-seq data across data sets. Nat Methods 2018;15:359–62. [DOI] [PubMed] [Google Scholar]
- 21. Aran D, Looney AP, Liu L, et al. Reference-based analysis of lung single-cell sequencing reveals a transitional profibrotic macrophage. Nat. Immunology 2019;20:163–72. [DOI] [PMC free article] [PubMed] [Google Scholar]
- 22. Pliner HA, Shendure J, Trapnell C. Supervised classification enables rapid annotation of cell atlases. Nat Methods 2019;16:983–6. [DOI] [PMC free article] [PubMed] [Google Scholar]
- 23. de Kanter JK, Lijnzaad P, Candelli T, et al. CHETAH: a selective, hierarchical cell type identification method for single-cell RNA sequencing. Nucleic Acids Res 2019;47:e95. [DOI] [PMC free article] [PubMed] [Google Scholar]
- 24. Zhang AW, O’Flanagan C, Chavez EA, et al. Probabilistic cell-type assignment of single-cell RNA-seq for tumor microenvironment profiling. Nat Methods 2019;16:1007–15. [DOI] [PMC free article] [PubMed] [Google Scholar]
- 25. Zhang Z, Luo D, Zhong X, et al. SCINA: a semi-supervised subtyping algorithm of single cells and bulk samples. Genes (Basel) 2019;10:531. [DOI] [PMC free article] [PubMed] [Google Scholar]
- 26. Li C, Liu B, Kang B, et al. SciBet as a portable and fast single cell type identifier. Nat Commun. 2020;11:1818. [DOI] [PMC free article] [PubMed] [Google Scholar]
- 27. Zheng C, Zheng L, Yoo J-K, et al. Landscape of infiltrating T cells in liver cancer revealed by single-cell sequencing. Cell 2017;169:1342–1356.e16. [DOI] [PubMed] [Google Scholar]
- 28. Hay SB, Ferchen K, Chetal K, et al. The human cell atlas bone marrow single-cell interactive web portal. Exp Hematol 2018;68:51–61. [DOI] [PMC free article] [PubMed] [Google Scholar]
- 29. Oetjen KA, Lindblad KE, Goswami M, et al. Human bone marrow assessment by single-cell RNA sequencing, mass cytometry, and flow cytometry. JCI Insight 2018;3:e124928. [DOI] [PMC free article] [PubMed] [Google Scholar]
- 30. Abdelaal T, Michielsen L, Cats D, et al. A comparison of automatic cell identification methods for single-cell RNA sequencing data. Genome Biol 2019;20:194. [DOI] [PMC free article] [PubMed] [Google Scholar]
- 31. Butler A, Hoffman P, Smibert P, et al. Integrating single-cell transcriptomic data across different conditions, technologies, and species. Nat Biotechnol 2018;36:411–20. [DOI] [PMC free article] [PubMed] [Google Scholar]
- 32. Leek JT, Johnson WE, Parker HS, et al. The sva package for removing batch effects and other unwanted variation in high-throughput experiments. Bioinformatics 2012;28:882–3. [DOI] [PMC free article] [PubMed] [Google Scholar]
- 33. Bischl B, Lang M, Kotthoff L, et al. Mlr: machine learning in R. The Journal of Machine Learning Research 2016;17:5938–42. [Google Scholar]
- 34. Xiang Z, Mungall C, Ruttenberg A, et al. Ontobee: a linked data server and browser for ontology terms. Proceedings of International Conference on Biomedical Ontology. Aachen, Germany: CEUR-WS.org. 2011; 279–81.
- 35. Jupp S, Burdett T, Leroy C, et al. A new ontology lookup service at EMBL-EBI. SWAT4LS. England: Cambridge, 2015;118–9. [Google Scholar]
- 36. Webb S. Deep learning for biology. Nature 2018;554:555–7. [DOI] [PubMed] [Google Scholar]
- 37. Gulli A, Pal S. Deep Learning with Keras. Birmingham, UK: Packt Publishing Ltd., 2017 [Google Scholar]
- 38. Abadi M, Barham P, Chen J, et al. Tensorflow: a system for large-scale machine learning. 12th USENIX symposium on operating systems design and implementation. Savannah, GA, USA. 2016;265–83. [Google Scholar]
- 39. Clare A. Machine learning and data mining for yeast functional genomics. Doctoral dissertation, University of Wales, Aberystwyth. 2003.
- 40. Clare A, King RD. Predicting gene function in Saccharomyces cerevisiae. Bioinformatics 2003;19(Suppl 2):ii42–9. [DOI] [PubMed] [Google Scholar]
- 41. Shannon CE. A mathematical theory of communication. Bell Syst Tech J 1948;27:379–423. [Google Scholar]
- 42. Clare A, King RD. Knowledge discovery in multi-label phenotype data. European conference on principles of data mining and knowledge discovery. Berlin, Heidelberg: Springer. 2001; 42–43 [Google Scholar]
- 43. Aran D, Looney AP, Liu L, et al. Reference-based analysis of lung single-cell sequencing reveals a transitional profibrotic macrophage. Nat Immunol. 2019;20:163–172. [DOI] [PMC free article] [PubMed] [Google Scholar]
- 44. Chen X, Chang JT. Planning bioinformatics workflows using an expert system. Bioinformatics 2017;33:1210–5. [DOI] [PMC free article] [PubMed] [Google Scholar]
- 45. Jason Cory Brunson. ggalluvial: Alluvial Plots in “ggplot2”. R package version 0.11.1 https://CRAN.R-project.org/package=ggalluvial. 2019.
- 46. Sade-Feldman M, Yizhak K, Bjorgaard SL, et al. Defining T cell states associated with response to checkpoint immunotherapy in melanoma. Cell 2018;175:998–1013.e20. [DOI] [PMC free article] [PubMed] [Google Scholar]
- 47. Puram SV, Tirosh I, Parikh AS, et al. Single-cell transcriptomic analysis of primary and metastatic tumor ecosystems in head and neck cancer. Cell 2017;171:1611–1624.e24. [DOI] [PMC free article] [PubMed] [Google Scholar]
- 48. Silla Jr CN, Freitas AA. A survey of hierarchical classification across different application domains. Data Min Knowl Discov 2011;22:31–72. [Google Scholar]
- 49. Silla Jr CN, Freitas AA. A global-model naive bayes approach to the hierarchical prediction of protein functions. 009 Ninth IEEE International Conference on Data Mining. Miami, FL, USA. 2009;992–97. [Google Scholar]
Associated Data
This section collects any data citations, data availability statements, or supplementary materials included in this article.
Supplementary Materials
Data Availability Statement
ImmClassifier, the scripts and data required to reproduce this work are available at https://github.com/xliu-uth/ImmClassifier.