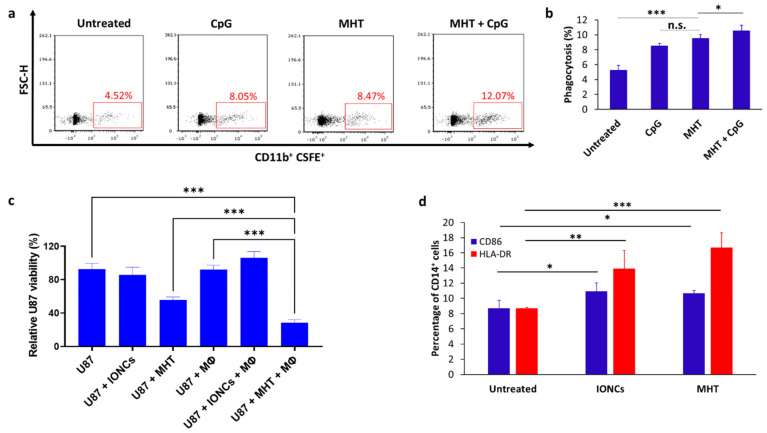
Figure 5.
Representative dot plots showing phagocytosis of MHT−treated U87 cells by THP−1−derived macrophages (Mϕ) after 2 h of coculture at a 1:1 effector: target (E:T) ratio (a). Flow cytometric quantification of phagocytosis rates by THP−1−derived Mϕ towards untreated or MHT−treated U87 in the presence or absence of TLR9 agonist CpG (b). Percentage of phagocytosis was determined by the percentage of CSFE+ cells within CD11b+ Mϕ cell gate (double positive). Tumor cell killing by macrophages was evaluated via crystal violet staining after 24 h of co−culture with untreated or treated U87 cells with IONCs only (U87 + IONCs) or with IONCs and MHT (U87 + MHT) (c). Activation of THP−1−derived macrophages was evaluated via analysis of surface expression of CD86 (blue bars) and HLA−DR (red bars) after 48 of co−incubation with untreated U87 cells, U87 cells exposed to IONCs (IONCs) and MHT-treated U87 cells (MHT) (d). All data are shown as mean ± SD. Statistical analysis was conducted via two−tailed unpaired student’s t test (* 0.01 < p < 0.05; ** 0.001 < p < 0.01; *** p < 0.001; n.s. = not significant).

