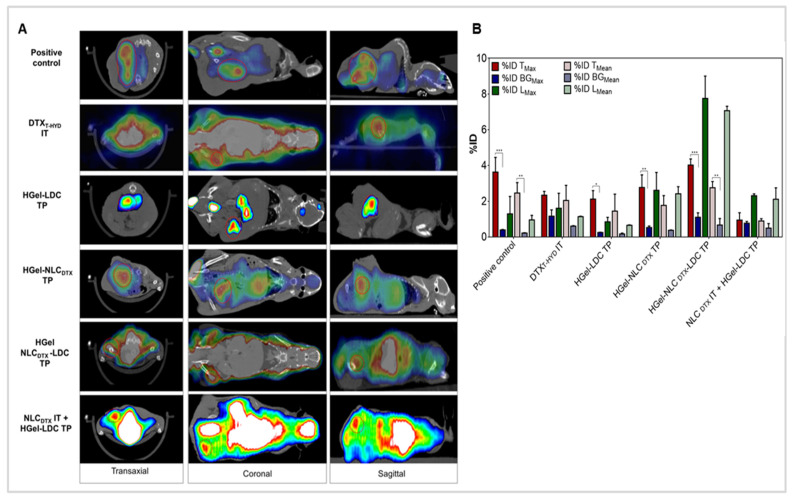
Figure 5.
Micro-PET/CT imaging showing 18F-[FDG] uptake in mice with B16-F10 tumors treated with saline (Positive control), free docetaxel (DTXT-HYD) and hydrogel formulations (HGel-LDC, HGel-NLCDTX TP, HGel-NLCDTX-LDC TP and NLCDTX IT + HGel-LDC TP). (A) Images taken 7 days after the end of the treatments. Additional identifiable structures with respect to 18F-[FDG] uptake were bladder, kidney, liver and heart. Dashed circles indicate the location of the tumor. (B) Quantification of 18F-[FDG] uptake (%IDMax and ID%Mean, mean ± SD, n =2) in tumors (T), normal adjacent tissue (BG) and liver (L). The%IDMax of the tumor (%ID TMax) was compared to the%IDMax –BG (%ID BGMax) to better assess the injected dose activity. Raw values are shown in Table S3. The%IDMax –liver (%ID LMax) and%IDMean –liver (%ID LMean served as a reference for high 18F-[FDG] uptake. Statistical analysis: Two-Way ANOVA post-hoc Tukey, * p < 0.05; ** p< 0.01; *** p < 0.001.

