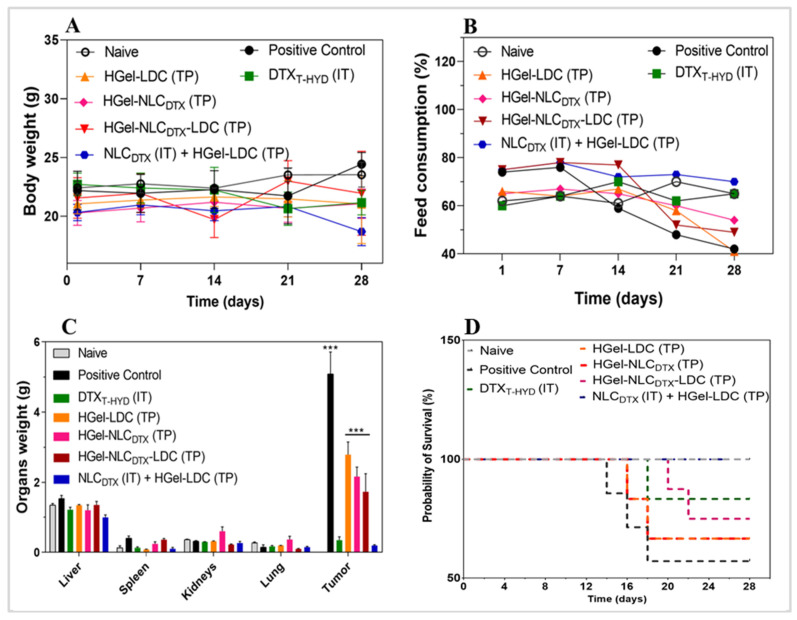
Figure 6.
Evaluation of treatments and their adverse effects over C57BL/6J mice with melanoma. (A) Variation of body weight (B) Analysis of feed intake. (C) Weight of the organs (liver, spleen, kidneys, lung) and tumor region. (D) Kaplan–Meier survival curves for the different treated groups: naive, positive control (PBS group), positive control, DTXT-HYD IT and nanohybrid hydrogel groups HGel-LDC TP, HGel-NLCDTX TP, HGel-NLCDTX-LDC TP and NLCDTX IT + HGel-LDC TP. Statistical analysis: Two-Way ANOVA post-hoc Bonferroni, *** p < 0.001; n = 5.

