Abstract
A highly sensitive method of quantitative analysis of hepatitis B virus (HBV) DNA in serum, the Cobas Amplicor HBV Monitor (Cobas-AM) test, was evaluated. Following a manual extraction of viral DNA, amplification, colorimetric detection, and quantitative determination are all automatically performed in the Cobas analyzer. Serially diluted samples with known HBV DNA concentrations were analyzed blindly. All samples with a virus concentration of 400 copies/ml and 83% of samples with a virus concentration of 100 copies/ml could be detected. A linear correlation between input HBV DNA and measured HBV DNA was seen in the range from 100 to 105 copies/ml. The mean coefficient of variation was 29.6% for all input levels and 18.9% for HBV DNA concentrations above 400 copies/ml. Samples with an HBV DNA level above 109 copies/ml could be reproducibly measured after predilution to 10−4 or 10−6 in negative serum; however, the level was underestimated if target DNA after dilution was still above the linear range of the assay. Quantitative results of the Cobas-AM test were interchangeable with measurements by the manual microwell plate version of Amplicor HBV Monitor (MWP-AM); the mean ratio for log Cobas-AM results/log MWP-AM results was 0.97 (standard error of the mean, 0.007) when serum samples from 153 chronic carriers were analyzed. The test should be of value for clinical assessment of chronic carriers and for monitoring the response to antiviral treatment. A limitation is the relatively narrow linear range of the assay, requiring predilution of high-titer (mainly hepatitis B e-antigen-positive) samples.
There are about 300 million chronic carriers of hepatitis B virus (HBV) worldwide, some of whom develop severe liver damage, including cirrhosis and hepatocellular carcinoma. New antiviral strategies for the treatment of chronic hepatitis B have emphasized the need for high-sensitivity detection of viral load, both for monitoring the effect on HBV replication and for identifying breakthroughs indicating drug resistance (8, 12). Measuring of HBV DNA levels in serum may also prove useful for the clinical staging of chronic infection (6, 13), including assessment of infectivity and prognosis.
Recently, methods for analyzing HBV DNA by quantitative PCR have been developed (5, 6, 9, 13, 14), and one such method has been introduced on the market (Amplicor HBV Monitor test, manufactured by Roche Molecular Systems, Branchburg, N.J.). This test is based on coamplification of HBV template and an internal quantitation standard (QS), and subsequent enzyme-linked immunosorbent assay detection of captured amplicons (9). The HBV DNA is then calculated by comparing HBV/QS ratios of optical density values to a standard curve set up for each run. The assay has a wide linear range but is rather laborious, as it requires much hands-on time, and carries risk for technical errors.
In the present study, we have evaluated a new version of the Amplicor HBV Monitor test, adapted for automated processing by a Cobas analyzer (4).
MATERIALS AND METHODS
Quantitative PCR.
Analysis of HBV DNA in serum was performed by using the Amplicor HBV Monitor test (Roche Molecular Systems) according to the manufacturer’s instructions and by using the Cobas Amplicor HBV Monitor test (Cobas-AM) as follows.
(i) Specimen preparation.
HBV DNA was manually isolated from 100 μl of serum by polyethylene glycol precipitation followed by virion lysis and neutralization. A known number of QS molecules was introduced into each specimen and was carried through the specimen preparation, amplification, and detection steps subsequently used for quantification of HBV DNA in the specimen.
(ii) PCR amplification.
Processed specimens (50 μl, corresponding to 22 μl of serum) were added to 50 μl of amplification mixture in amplification tubes (A tubes) and loaded onto the Cobas analyzer. A 104-bp segment of the highly conserved precore-core region was amplified by using one biotinylated primer (HBV-104UB) and one nonbiotinylated primer (HBV-104D). The QS was amplified with the same primers as target HBV, generating a 104-bp amplicon.
(iii) Detection.
After amplification for 30 cycles, denaturation solution was automatically added to the A tubes to chemically denature HBV and QS amplicons to form single-stranded DNA. The denatured amplicon was then serially diluted in detection cups (D cups) to achieve quantitative results over a broad dynamic range. Magnetic particles coated with oligonucleotide probes specific for target HBV and QS sequences, respectively, were added to the D cups and hybridized to the biotin-labeled amplicon. Following hybridization the Cobas analyzer washed the magnetic beads and added avidin-horseradish peroxidase conjugate, and upon addition of TMB (3,3′,5,5′ tetramethylbenzidine), a color complex, the absorbance (A) of which was measured at 660 nm, was formed.
(iv) HBV DNA quantification.
Within the linear range of the assay, A of each D cup is proportional to the amount of HBV or QS amplicon in the cup. The Cobas analyzer calculates a total absorbance by multiplying the absorbance of the D cup by the amplicon dilution factor of that cup. The amount of HBV DNA in each specimen was calculated from the ratio of the total HBV absorbance to the total QS absorbance and the input number of QS molecules by using the following algorithm: HBV DNA/ml = total HBV A660/total QS A660 × input QS copies × 45
where total HBV A660 is calculated total HBV absorbance, total QS A660 is calculated total QS absorbance, input QS copies is the number of QS copies in each PCR mixture (lot specific), and 45 is a factor to convert copies per PCR to copies per milliliter.
Evaluation of the test.
The study evaluated the linearity, reproducibility, and precision of Cobas-AM and the correlation of the Cobas-AM results with the results of the microwell plate version of the Amplicor Monitor (MWP-AM) test. Panels of serial dilutions of a reference sample were analyzed blindly. The HBV DNA concentrations of the panel members had previously been determined at a different laboratory (Sangtec Medical) by multiple analysis using the MWP-AM.
(i) Linearity.
Duplicates of 12 samples with known HBV DNA concentrations were analyzed on 3 consecutive days, i.e., each sample was analyzed six times.
(ii) Precision.
Quadruplicates of samples representing six different HBV DNA concentrations were analyzed by each of two technicians on 5 consecutive days. Thus, each sample was analyzed 20 times by each technician. Within-run variation and overall variation were analyzed.
In addition, on 5 consecutive days triplicates of serum samples collected from four highly viremic carriers were analyzed after predilution in HBV-negative serum to 1:104 or 1:106. Thus, each sample was analyzed 15 times at each dilution.
(iii) Correlation.
Duplicates of the 12 samples in the linearity analysis were also examined by the MWP-AM on 3 consecutive days, each sample thus being analyzed six times. Mean values and variation were compared with results from Cobas-AM.
In addition, serum samples from 153 HBV carriers (35 hepatitis B e antigen [HBeAg]-positive and 118 HBeAg-negative carriers) at various clinical stages of chronic infection were analyzed once using the Cobas-AM. The genotypes of HBV in these samples as determined by methods described previously (10, 11) were A in 32 samples, B in 22 samples, C in 13 samples, D in 77 samples, and E in 3 samples (6 were not genotypable). The results were compared with mean values from repeated analyses (two or three analyses) using the MWP-AM. Because the Cobas-AM test has a narrower detection range, high-titer samples were prediluted in negative serum, based on the previous MWP-AM results, according to the following criteria: samples were not prediluted if the HBV DNA concentration was below 80,000 copies/ml; they were diluted 1:50 if it was 80,000 to 3.2 million copies/ml, 1:900 if it was 3.2 to 40 million copies/ml, and 1:40,000 if it was above 40 million copies/ml in previous MWP-AM analysis.
(iv) Clinical samples and negative controls.
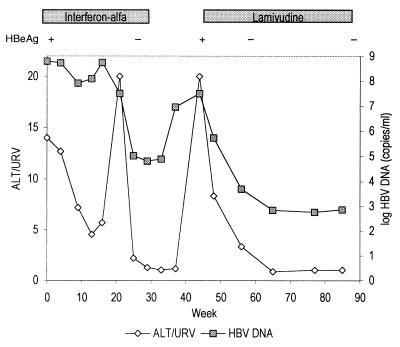
To evaluate the clinical value of Cobas-AM for monitoring viremia during therapy, serum samples from an HBeAg-positive 31-year-old Korean woman with chronic active hepatitis and developing cirrhosis, treated consecutively with interferon and lamivudine, were analyzed. She was first given alpha interferon at 15 MU/week for 6 months, resulting in alanine aminotransferase (ALT) normalization and HBeAg seroconversion. Because of a relapse 3 months after discontinuation of interferon she was given 150 mg of lamivudine twice daily for one month and then 150 mg of lamivudine daily. Serum samples drawn regularly during treatment were analyzed. Samples with high HBV DNA levels were reanalyzed after predilution to 10−2 or 10−4. Serum samples from 10 blood donors negative for HBV markers (HBsAg, anti-HBc antibodies, and anti-HBs antibodies) were analyzed to confirm specificity.
RESULTS
Samples analyzed by the Cobas-AM assay had 100, 91, and 83% detection rates when the HBV DNA levels in serum were 400, 200, and 100 copies/ml, respectively. In the MWP-AM assay, a level of 825 copies/ml was needed for 100% detection and when the levels were 400 and 200 copies/ml the detection rates were 50 and 17%, respectively. The sera from 10 HBV-negative controls were all nonreactive.
Precision and reproducibility.
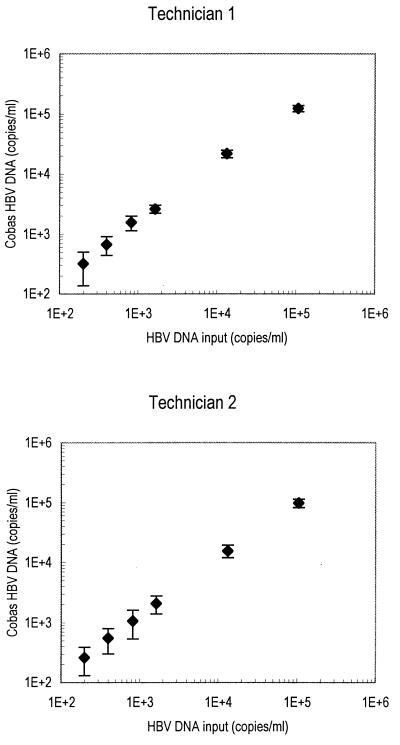
Figure 1 shows the observed HBV DNA values (means ± standard errors of the means [SEMs] from 20 analyses) obtained by each of the two technicians plotted against the HBV input. The correlation coefficient, r, for mean HBV DNA values was 1.00 for both technicians. Table 1 shows the mean, range, and coefficient of variation (CV) for observed HBV DNA concentrations at each HBV input level.
FIG. 1.
Reproducibility and precision of Cobas-AM for detection of HBV DNA at levels in the range from 200 to 100,000 copies/ml. Each sample was analyzed 20 times by each of two technicians; mean values and SEMs are shown.
TABLE 1.
Precision and reproducibility of Cobas-AM
| Sample no. | Input HBV DNA (copies/ml) | Technician 1
|
Technician 2
|
||||||
|---|---|---|---|---|---|---|---|---|---|
| Meana (copies/ml) | Rangea (copies/ml) | CV (%) | Within-run CV range (%) | Meana (copies/ml) | Rangea (copies/ml) | CV (%) | Within-run CV range (%) | ||
| 3 | 200 | 258 | 128–495b | 50 | 25–85 | 317 | 201–756b | 57 | 19–84 |
| 4 | 400 | 544 | 123–1,030 | 45 | 18–97 | 666 | 115–948 | 34 | 7–64 |
| 5 | 825 | 1,064 | 425–2,400 | 50 | 18–79 | 1,562 | 885–2,060 | 28 | 12–33 |
| 6 | 1,650 | 2,067 | 1,100–3,360 | 33 | 5–35 | 2,600 | 2,060–3,210 | 15 | 10–21 |
| 9 | 13,300 | 15,525 | 10,400–24,000 | 23 | 10–16 | 21,400 | 17,600–29,000 | 14 | 3–22 |
| 12 | 106,000 | 97,575 | 75,100–128,000 | 16 | 7–19 | 121,335 | 95,000–143,000 | 12 | 4–17 |
Of 20 analyses; quadruplicates of each sample were analyzed repeatedly over 5 days by each technician.
Two nonreactive results of analyses are excluded.
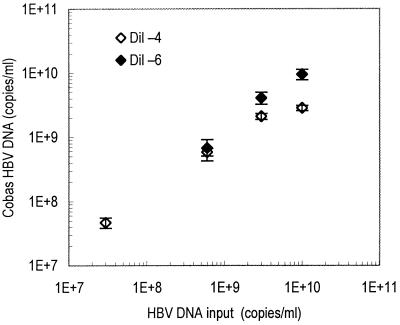
Figure 2 shows the levels of HBV DNA obtained by analysis of high-titer samples after dilution in negative serum (to 10−4 or 10−6). Each sample was analyzed 15 times; CV ranged from 8.8 to 36.3% (mean CV, 18.2%). However, a predilution to 10−4 resulted in an underestimation of the HBV DNA level in samples with very high HBV input (1010 copies/ml), because the target HBV DNA level after predilution was still above the linear range of detection (i.e., above 105 copies/ml). On the other hand, a dilution to 10−6 caused samples with moderately high HBV input (107 copies/ml) to become nonreactive.
FIG. 2.
Measurements by Cobas-AM of four high-titer serum samples diluted in negative serum to 1:104 (Dil −4) and 1:106 (Dil −6) prior to analysis. Each sample was analyzed 15 times; mean values and SEMs are shown.
Linearity and correlation.
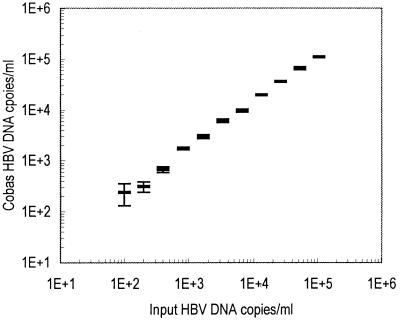
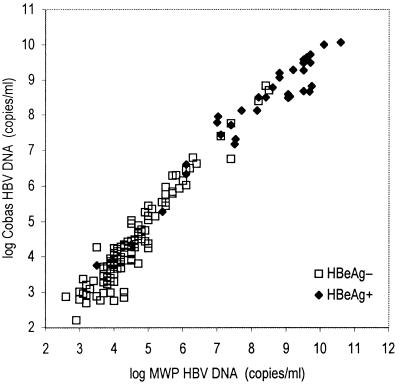
Table 2 shows the mean, CV, and range of observed HBV DNA level at each HBV input level as measured by Cobas-AM. As shown in Fig. 3, there was a linear correlation between observed HBV DNA and HBV input in the range from 100 to 100,000 copies/ml. All 153 clinical samples were reactive by both MWP-AM and Cobas-AM, showing a good correlation (b = 1.16, r = 0.97) when samples were diluted prior to analysis as described in the Materials and Methods section (Fig. 4). In agreement, the mean ratio of log HBV DNA level obtained by Cobas-AM to that obtained by MWP-AM for each sample was 0.97 (SEM = 0.007), and there were minor differences among genotypes (the ratios were 0.95, 0.98, 1.01, and 0.97 for genotypes A, B, C, and D, respectively). The median HBV DNA level for the HBeAg-positive samples was 108.6 copies/ml, and that for the HBeAg-negative samples was 104.2 copies/ml. Of the 35 HBeAg-positive samples, 85% showed HBV DNA level above 107.0 copies/ml, and 8.3% showed level below 106.0 copies/ml.
TABLE 2.
Performance of the MWP-AM and Cobas-AM
| Sample no. | Input HBV DNA (copies/ml) | MWP-AM
|
Cobas-AM
|
||
|---|---|---|---|---|---|
| Meana | CV (%)b | Meana | CV (%)b | ||
| 2 | 100 | 0 | NAf | 241 (290)c | 112 |
| 3 | 200 | 67 (400)d | 254 | 311 | 57 |
| 4 | 400 | 253 (507)e | 119 | 675 | 33 |
| 5 | 825 | 833 | 43 | 1,738 | 16 |
| 6 | 1,650 | 1,620 | 27 | 2,993 | 23 |
| 7 | 3,300 | 3,107 | 94 | 6,135 | 22 |
| 8 | 6,600 | 7,233 | 11 | 9,658 | 16 |
| 9 | 13,300 | 15,593 | 12 | 19,733 | 12 |
| 10 | 26,500 | 22,787 | 8.5 | 36,750 | 6.5 |
| 11 | 53,000 | 39,060 | 16 | 66,500 | 17 |
| 12 | 106,000 | 66,107 | 19 | 111,167 | 7.6 |
| 13 | 212,000 | 151,827 | 14 | 171,667 | 11 |
Mean of six analyses (duplicate analyses performed on 3 consecutive days), with nonreactive results set as 0 copies/ml; mean for reactive results only is given within parentheses).
Nonreactive results set as 0 copies/ml.
One of six analyses yielded nonreactive results.
Five of six analyses yielded nonreactive results.
Three of six analyses yielded nonreactive results.
NA, not applicable.
FIG. 3.
Linearity in the detection of HBV DNA in the range from 100 to 200,000 copies/ml by Cobas-AM. Each sample was analyzed six times; mean values and SEMs are shown.
FIG. 4.
Correlation between Cobas-AM and the MTW-AM in the analysis of HBV DNA in serum samples from 153 chronic HBV carriers (36 HBeAg-positive carriers and 118 HBeAg-negative carriers). The mean of repeated (two or three analyses) MWP-AM analyses is plotted against a single value from analysis by Cobas-AM after predilution in negative serum as described in the Materials and Methods section (r = 0.97, b = 1.17).
Clinical monitoring.
Figure 5 shows the HBV DNA levels of the patient with chronic active hepatitis in relation to the course of ALT level and therapy. At the end of interferon treatment ALT had normalized, HBeAg had been replaced by anti-HBe antibody, and the HBV DNA level was reduced to 104.8 copies/ml. Six weeks after discontinuation of interferon treatment, HBV DNA level had increased to 107.0 copies/ml, but the ALT level was only slightly above the upper reference value (URV). Six weeks later a severe relapse of hepatitis occurred; the ALT level was 20× URV, and the HBV DNA level was 107.5 copies/ml. Lamivudine treatment resulted in a decrease of HBV DNA levels to 103.7 and 102.8 copies/ml after 8 and 16 weeks, respectively, paralleled by ALT normalization.
FIG. 5.
ALT and HBV DNA levels measured by Cobas-AM in a patient with chronic active hepatitis treated with alpha interferon and lamivudine.
DISCUSSION
The present study demonstrates that the Cobas-AM test has high sensitivity and reproducibility. The virus in all samples with an input above 400 copies/ml and in 83% of samples with input of 100 copies/ml was detected. The CV ranged from 8.8 to 36.3%, and the most variation was observed for samples with very low HBV DNA concentrations.
In comparison with the MWP-AM (7, 9), the automation of amplification, detection, and calculation reduced the hands-on time and risk for technical or computational errors. The sensitivity was higher than that for MWP-AM, but the detection range was narrower as the upper limit of detection was reduced from 107 to 105 copies/ml. Thus, the range of detection is particularly suitable for measuring low-level viremia, as seen in most HBeAg-negative patients (13) and during therapy. Recently, new antiviral therapies, such as lamivudine, have been introduced (8). The advantage of such antiviral treatment is that it is given orally and has few side effects. On the other hand, viremia tends to reappear at discontinuation of therapy, and breakthrough due to drug resistance has recently been described (1, 3, 12). Therefore, in the future combination therapy may prove the most effective strategy, and as in the management of human immunodeficiency virus, monitoring viral load with highly sensitive methods may prove essential for control of HBV infection (2). As regards treatment with interferon, which probably acts through both immunomodulation and antiviral effects, the value of monitoring HBV DNA remains to be demonstrated. In the present study, monitoring of a patient consecutively treated with interferon and lamivudine showed that the (transient) response to interferon (including ALT normalization and HBeAg seroconversion) was accompanied by a reduction of viral load to 6 × 10⁴ copies/ml, and the clinical response to lamivudine included reduction of viral levels to around 700 copies/ml during treatment. Of interest, the ALT peaks, both the flare during interferon treatment and the flare at the relapse after interferon treatment, were preceded by increasing HBV DNA levels, indicating that HBV DNA monitoring may be useful in identifying and (when further antiviral drugs emerge) reducing the hepatocellular damage caused by viral activations and treatment breakthroughs. Further investigations are needed to find out if suppression of viremia below a certain limit is enough or if eradication of viral replication is required for preventing further liver damage and minimizing the risk for viral resistance and/or reactivation of hepatitis when therapy is discontinued.
There was a good correlation between results from Cobas-AM and those from MWP-AM. Analysis of 153 clinical samples by both methods showed a regression coefficient of 1.17 and a mean ratio of 0.97 for individual log HBV DNA results measured by Cobas and results measured by MWP. Thus, the ratio for Cobas:MWP results was approximately 1:1, indicating that results of the tests are interchangeable. The MWP-AM has the advantage of a broader detection range, allowing quantification of virus at relatively high levels as well. However, our data indicate that for samples with HBV DNA levels close to or above 107 copies/ml the levels are underestimated by MWP-AM, unless they are diluted in negative serum prior to analysis (not shown).
In HBeAg-positive samples, the median HBV DNA concentration was 108.6 copies/ml, i.e., far above the upper limit of detection by Cobas-AM. Therefore, predilution is required for analysis of serum samples from HBeAg-positive carriers (and HBeAg-negative carriers if they are suspected to be highly viremic). Our data indicate that the most suitable predilution for HBeAg-positive samples is 1:105. This moves the detection range of Cobas-AM from 102 to 105 copies/ml to 107 to 1010 copies/ml and should allow detection and quantification of more than 90% of HBeAg-positive samples, less than 5% of which would be categorized as containing more than 1010 copies/ml.
In summary, HBV DNA quantification by Cobas-AM is highly sensitive and reproducible but has a range of detection that requires predilution of high-titer samples. It should be particularly suitable for monitoring response to antiviral therapy.
ACKNOWLEDGMENTS
We thank Peter Horal for reviewing the manuscript, and Roche Molecular Systems for supplying reagents.
The project was supported by grants from the Swedish Medical Research Council and the Swedish Medical Society.
REFERENCES
- 1.Allen M I, Deslauriers M, Andrews C W, Tipples G A, Walters K A, Tyrrell D L, Brown N, Condreay L D. Identification and characterization of mutations in hepatitis B virus resistant to lamivudine. Lamivudine Clinical Investigation Group. Hepatology. 1998;27:1670–1677. doi: 10.1002/hep.510270628. [DOI] [PubMed] [Google Scholar]
- 2.Berger A, Braner J, Doerr H W, Weber B. Quantification of viral load: clinical relevance for human immunodeficiency virus, hepatitis B virus and hepatitis C virus infection. Intervirology. 1998;41:24–34. doi: 10.1159/000024912. [DOI] [PubMed] [Google Scholar]
- 3.Chayama K, Suzuki Y, Kobayashi M, Kobayashi M, Tsubota A, Hashimoto M, Miyano Y, Koike H, Kobayashi M, Koida I, Arase Y, Saitoh S, Murashima N, Ikeda K, Kumada H. Emergence and takeover of YMDD motif mutant hepatitis B virus during long-term lamivudine therapy and re-takeover by wild type after cessation of therapy. Hepatology. 1998;27:1711–1716. doi: 10.1002/hep.510270634. [DOI] [PubMed] [Google Scholar]
- 4.DiDomenico N, Link H, Knobel R, Caratsch T, Weschler W, Loewy Z, Rosenstraus M. COBAS AMPLICORTM: fully automated RNA and DNA amplification and detection system for routing diagnostic PCR. Clin Chem. 1996;42:1915–1923. [PubMed] [Google Scholar]
- 5.Erhardt A, Schaefer S, Athanassiou N, Kann M, Gerlich W H. Quantitative assay of PCR-amplified hepatitis B virus DNA using a peroxidase-labelled DNA probe and enhanced chemiluminescence. J Clin Microbiol. 1996;34:1885–1891. doi: 10.1128/jcm.34.8.1885-1891.1996. [DOI] [PMC free article] [PubMed] [Google Scholar]
- 6.Jardi R, Buti M, Rodriguez-Frias F, Cortina M, Esteban R, Guardia J, Pascual C. The value of quantitative detection of HBV-DNA amplified by PCR in the study of hepatitis B infection. J Hepatol. 1996;24:680–685. doi: 10.1016/s0168-8278(96)80263-7. [DOI] [PubMed] [Google Scholar]
- 7.Kessler H H, Pierer K, Dragon E, Lackner H, Santner B, Stunzner D, Stelzl E, Waitz B, Marth E. Evaluation of a new assay for HBV DNA quantitation in patients with chronic hepatitis B. Clin Diagn Virol. 1998;9:37–43. doi: 10.1016/s0928-0197(97)10008-3. [DOI] [PubMed] [Google Scholar]
- 8.Lai C L, Chien R N, Leung N W, Chang T T, Guan R, Tai D I, Ng K Y, Wu P C, Dent J C, Barber J, Stephenson S L, Gray D F. A one-year trial of lamivudine for chronic hepatitis B. Asia Hepatitis Lamivudine Study Group. N Engl J Med. 1998;339:61–68. doi: 10.1056/NEJM199807093390201. [DOI] [PubMed] [Google Scholar]
- 9.Lehtovaara P, Uusi-Oukari M, Laaksonen M, Bengtström M, Ranki M. Quantitative PCR for hepatitis B virus with colorimetric detection. PCR Methods Appl. 1993;3:169–175. doi: 10.1101/gr.3.3.169. [DOI] [PubMed] [Google Scholar]
- 10.Lindh M, Andersson A S, Gusdal A. Genotypes, nt 1858 variants and geographic origin of hepatitis B virus—large-scale analysis using a new genotyping method. J Infect Dis. 1997;175:1285–1293. doi: 10.1086/516458. [DOI] [PubMed] [Google Scholar]
- 11.Lindh M, Gonzalez J E, Norkrans G, Horal P. Genotyping of hepatitis B virus by restriction pattern analysis of a pre-S amplicon. J Virol Methods. 1998;72:163–174. doi: 10.1016/s0166-0934(98)00026-3. [DOI] [PubMed] [Google Scholar]
- 12.Melegari M, Scaglioni P P, Wands J R. Hepatitis B virus mutants associated with 3TC and famciclovir administration are replication defective. Hepatology. 1998;27:628–633. doi: 10.1002/hep.510270243. [DOI] [PubMed] [Google Scholar]
- 13.Niitsuma H, Ishii M, Miura M, Kobayashi K, Toyota T. Low level hepatitis B viremia detected by polymerase chain reaction accompanies the absence of HBe antigenemia and hepatitis in hepatitis B virus carriers. Am J Gastroenterol. 1997;92:119–123. [PubMed] [Google Scholar]
- 14.Ranki M, Schatzl H M, Zachoval R, Uusi O M, Lehtovaara P. Quantification of hepatitis B virus DNA over a wide range from serum for studying viral replicative activity in response to treatment and in recurrent infection. Hepatology. 1995;21:1492–1499. [PubMed] [Google Scholar]


