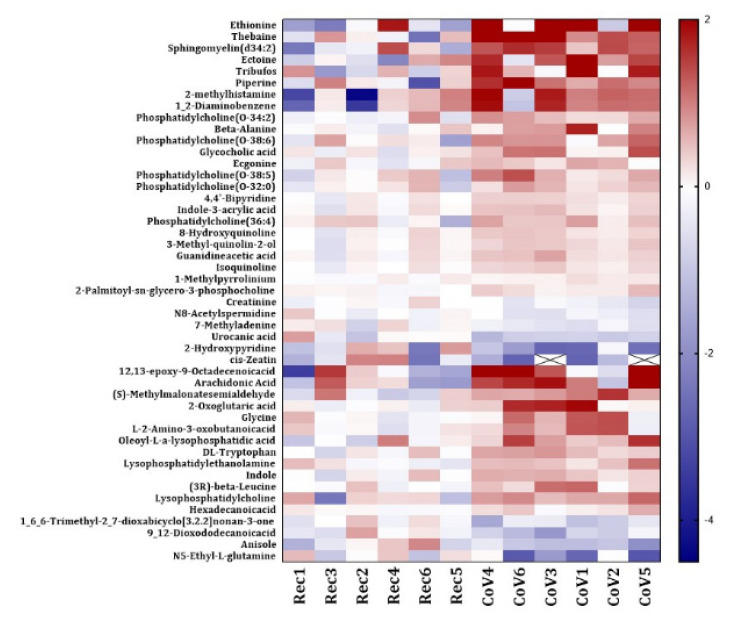
Figure 4.
Heat map showing differential levels of serum metabolites in COVID-19-positive and COVID-19-recovered patients. The fold changes of the normalized abundances of various metabolites found in the serum samples from COVID-19-positive (CoV) and COVID-19-recovered (Rec) patients were calculated and the metabolite levels that were significantly altered were represented as a heatmap. The fold changes are color coded in the heat map, with red representing a positive fold change (increase) and blue representing a negative fold change (decrease). For several samples, the fold change values were below the ranges specified in the heat map. These values are represented with a cross (X-mark).

