

Abstract
Oxygen is critical for a multitude of metabolic processes required for human life. Treating cells with 18O2 or other isotopically labelled gases and systematically identifying biomolecules incorporating these gases would reveal new biological processes. Here, we label cell lines of distinct tissue origins with 18O2 to generate the polar oxy-metabolome: a list of polar metabolites that were labelled with 18O under different physiological O2 tensions. The most highly 18O-labelled feature was previously undescribed in mammalian metabolism. We identify this metabolite as 4-hydroxymandelate (4-HMA) and demonstrate that it is made by hydroxyphenylpyruvate dioxygenase-like (HPDL), a protein of previously unknown function in human cells. We show that 4-HMA is one of the long-missing intermediates involved in the biosynthesis of the coenzyme Q10 (CoQ10) headgroup in human cells. The connection of HPDL to CoQ10 biosynthesis provides crucial insights into the mechanisms underlying recently described neurological diseases related to HPDL deficiencies1–4 and cancers with HPDL overexpression5.
Gaseous oxygen (O2) is essential for cellular respiration, the production of reactive oxygen species (ROS)6, and the activity of oxygen-dependent enzymes, such as dioxygenases. Oxygen-utilizing enzymes are essential for critical sensing, regulatory, and biosynthetic processes in cells7–10. Although the importance of oxygen for life has been known since the late 1700s, the scope of oxygen-dependent processes in mammalian cells remains unknown. Direct identification of oxygen-modified molecules and systematic measurement of oxygen-dependent enzyme activity would reveal fundamental oxygen-dependent processes and novel biology.
To map the fate of O2 in metabolic pathways, we labelled cell lines of different tissue origins with 18O2 at physiological (3%), hypoxic (1%), and severely hypoxic (0.2%) oxygen tensions11 (Extended Data Figure 1a–e). We used liquid chromatography-mass spectrometry (LC-MS) to generate a list of unique 18O-labelled features (Extended Data Figure 2a). To identify 18O-labelled features made by iron-dependent dioxygenases (Fe-dioxygenases), we labelled cells with and without a pan-dioxygenase inhibitor (IOX1) (Extended Data Figure 1f–g). We found that 18O-labelled features accounted for 0.2-2% of small molecule features (Extended Data Figure 2a–b). We term these 18O-labelled features the polar oxy-metabolome.
Our initial non-redundant list contained 49 18O-labelled features (Extended Data Figure 2c–d) across different cell lines and oxygen tensions, of which 46 (94%) unique 18O-labelled features were reproduced. We used these high confidence hits in subsequent analyses (Extended Data Figure 2e–g, Supplementary Table 1). Fractional labelling of most, though not all, of the 46 18O-labelled features was increased at higher oxygen tensions (Figure 1a; Extended Data Figure 3a, 3d–I; Supplementary Table 1). Cell lines exhibited differences in fractional 18O-labelling of features (Extended Data Figures 2f, 3b, 3d–e). About half of the 18O-labelled features were unknown to us, and were not predicted targets of oxygen-dependent metabolic pathways (Extended Data Figure 3f–i). The fractional 18O-labelling response in hypoxia differed by feature (Extended Data Figure 3c–i). These data suggest that there are variations in the activity of oxygen-dependent pathways in cells, and that there are undescribed roles of oxygen in mammalian cell biology.
Figure 1.

Analysis of the oxy-metabolome identifies a highly labelled metabolite, 4-hydroxymandelate, in human cells. a, Heatmap representing the median fractional 18O labelling of the 46 metabolites and features across the indicated oxygen tensions in MIAPACA2 cells. “**” represents metabolites that have matching MS2 spectra, but need to be validated due to multiple metabolite isomers. The red arrow indicates a highly labelled unknown metabolite. b, Mass spectra (MS1) of unlabelled (−167.0344m/z) and 18O2-labelled features (−169.0387m/z and −171.0426m/z) from MIAPACA2 cells grown in 3% 16O2 or 18O2 for 24 hours. The mass shifts of one (Δ2.0043) and two (Δ4.0082) 18O atoms are shown. c, Liquid chromatography-mass spectrometry traces showing retention times of metabolite precursors of homogentisate (HGA) and 4-hydroxymandelate (4-HMA) standards, and a highly 18O2-labelled feature (−167.0344m/z) from MIAPACA2 cells grown in 3% 18O2 for 24 hours. d, Unlabelled and 18O-labelled 4-HMA levels in MIAPACA2 cells grown in 3%, 1%, and 0.2% 18O2, and treated with MG132 (proteasome inhibitor), IOX1 (dioxygenase inhibitor), DFO (iron chelator), and/or physiological levels of ascorbate for 24 hours. (n=3). e, Schematic of 18O2-labelling of 4-HMA by an unknown Fe-dioxygenase and substrate in human cells. “n” represents the number of biologically independent replicates for each group and condition. Graphs represent mean ± s.e.m. and were compared by two-way ANOVA (d), followed by Tukey post-hoc test (*p<0.05, ^p<0.01, %p<0.005, #p<0.0001).
As additional controls, we treated MIAPACA2 cells with an iron chelator (DFO, Extended Data Figure 1f–g), a proteasome inhibitor (MG132) to induce proteotoxic stress, and physiological levels of ascorbate, an antioxidant, to determine the effects of ROS on 18O-labelling. Labelling of 18O γ-butyrobetaine was blocked by IOX1 and DFO because trimethyllysine hydroxylase (TMLH) is an Fe-dioxygenase (Extended Data Figure 4a–d). Similarly, 18O-labelling of methionine was blocked by IOX1, but only partially blocked by DFO (Extended Data Figure 4e–h) because mammalian acireductone dioxygenase 1 (ADI1) can utilize different metal ions, including iron, nickel, and cobalt, to maintain catalytic activity12. Total levels of 18O-labelled methionine sulfoxide increased upon MG132 treatment and decreased following ascorbate treatment (Extended Data Figure 4i–m)13. These results indicate that ROS-mediated damage and oxygen-dependent reactions are detectable by labelling with 18O2.
Many known oxygen-dependent metabolites were <10% 18O-labelled. However, we found an unknown feature (167.0339 m/z@8.5 min; negative ion mode) that was ~80-90% labelled at 3% 18O2 in MIAPACA2 cells (Figure 1a) and was >60% labelled at 3% 18O2 in other human cell lines (Extended Data Figure 3a). By retention time and MS2 fragmentation pattern database searching with purified standards (Figure 1b), we identified the metabolite as 4-hydroxymandelate (4-HMA) (Figure 1c; Extended Data Figure 5a). MS2 fragmentation confirmed that one 18O atom was incorporated in the carboxylic acid moiety and another in the Cα-hydroxyl group of 4-HMA (Extended Data Figure 5b). Hypoxia (<1% O2) and IOX1 or DFO treatment decreased 4-HMA levels and 18O-labelling (Figure 1d; Extended Data Figures 3c, 5c–d). Physiological ascorbate, which has been proposed to be a cofactor for certain Fe-dioxygenases, increased intracellular 4-HMA (Figure 1d). We hypothesized that humans had an Fe-dioxygenase that made 4-HMA (Figure 1d–e; Extended Data Figures 3c, 5c–d).
4-HMA biosynthesis has been described in some bacteria and in rabbits. The bacterium A. orientalis expresses hydroxymandelate synthase (HmaS), an Fe-dioxygenase that converts 4-hydroxyphenylpyruvate (4-HPPA) to 4-HMA14,15. 4-HPPA, the first intermediate in tyrosine (Tyr) catabolism, is made by tyrosine transaminase (TAT). In rabbits, 4-HMA is made from the Tyr catabolites octopamine and tyramine (Extended Data Figure 6a)16. Therefore, all known 4-HMA precursors are derived from Tyr. Tyr can be synthesized from phenylalanine (Phe) by Phe hydroxylase (PAH)17. To elucidate the human 4-HMA biosynthetic pathway, we labelled human cells with 13C9-Tyr and 13C6-Phe. In non-liver cells, which lack PAH, 4-HMA and canonical Tyr catabolism pathway metabolites (4-HPPA and 4-hydroxyphenyllactate; 4-HPLA) were completely labelled by 13C-Tyr, but not by 13C-Phe (Extended Data Figure 6b). In humans, 4-HMA lacks a single 18O at the Cα position of the 4-HMA carboxylate and therefore is not likely made from octopamine and tyramine, which we did not detect in the human cells we examined (Extended Data Figures 5b, 6a). As with labelling with 18O2, 13C9-Tyr incorporation into 4-HMA was inhibited by IOX1 and DFO, increased with ascorbate, and decreased in hypoxia (Extended Data Figure 6c–d). Unexpectedly, 4-HMA levels also were lower in 21% O2 compared to 3% O2, reflecting either decreased production or increased consumption of 4-HMA at 21% O2. These data indicate that 4-HMA is derived from Tyr, and that 4-HMA synthesis in human cells requires an Fe-dioxygenase with HmaS-like activity.
No known human enzyme makes 4-HMA, but humans have two homologs of HmaS: hydroxyphenylpyruvate dioxygenase (HPD) and hydroxyphenylpyruvate dioxygenase-like (HPDL). Both proteins have >80% homology to HmaS at the protein and cDNA level (Extended Data Figure 7a–c). HPD synthesizes homogentisate (HGA) from 4-HPPA during Tyr catabolism10 but does not make 4-HMA18,19. However, a single F337V or F337I mutation in HPD, which mimics the sequence of HmaS, decreases HGA synthesis and allows slight production of 4-HMA18,19. Little is known about the function and activity of HPDL, but the vicinal oxygen chelate (VOC) domains of HPD, HDPL and HmaS all contain conserved histidine residues required for iron coordination and dioxygenase activity (Extended Data Figure 7c)18,19. Sequence alignment and distance mapping at the gene and protein levels revealed that HPDL was more similar to HmaS than HPD (Extended Data Figure 7a–b). Protein sequence alignment of HPD, HmaS, and HPDL revealed that HPDL has an isoleucine at the F337 equivalent in HPD, suggesting that HPDL may make 4-HMA (Extended Data Figure 7c).
Pooled CRISPR/Cas9 deletion of HPDL had no effect on human PDAC cell line proliferation in 2D culture, but reduced levels of 13C9-Tyr-labelled 4-HMA (Figure 2a, Extended Data Figure 7d–g). Expression of sgRNA-resistant codon-optimized HPDL (coHPDL) wild-type (WT), but not catalytically inactive HPDL mutants (H258A and H163/258A), restored 4-HMA levels in HPDL-knockout (KO) cells (Figure 2b). This genetically linked HPDL activity to 4-HMA biosynthesis in human cells. HPDL-KO also increased 4-HPPA and 4-HPLA levels, which were lowered by coHPDL-FLAG WT expression (Extended Data Figure 7f–g), suggesting that these metabolites may be HPDL substrates.
Figure 2.

4-HMA is derived from tyrosine and synthesized by HPDL (4-hydroxyphenylpyruvate dioxygenase-like) in human cells. a, Total levels of unlabelled and 13C8-labelled 4-HMA from MIAPACA2 cells expressing control (sgTomato; sgTOM and sgLuciferase; sgLUC), and HPDL sgRNA guides. Cells were grown in 13C9-Tyr at 21% 16O2 for 24 hours (n=5). b, Total levels of unlabelled and 13C8-labelled 4-HMA from MIAPACA2 sgHPDL #3 cells with or without expression of sgRNA-resistant HPDL-FLAG wild-type (WT) and catalytically inactive HPDL mutants (H258A, and H163/258A). Cells were grown in 13C9-Tyr at 21% 16O2 for 24 hours (n=5). S6K serves as a loading control (a-b). c, Total levels of 4-HMA generated from enzymatic assays using HPDL-FLAG immunoprecipitated from MIAPACA2 sgHPDL #3 cells with or without expression of sgRNA-resistant HPDL-FLAG WT. d, Total levels of 4-HMA generated from enzymatic assays using HPDL-FLAG immunoprecipitated from MIAPACA2 sgHPDL #3 cells with or without expression of sgRNA-resistant HPDL-FLAG WT, or catalytically inactive mutants (H258A, and H163/258A). e, Schematic of the canonical tyrosine catabolism pathway and proposed non-canonical tyrosine pathway. “n” represents the number of biologically independent replicates for each group and condition. Graphs are represented as mean ± s.e.m. and were compared by one- (d) or two-way ANOVA (a-c), followed by Tukey post-hoc test (#p<0.0001).
To test if HDPL made 4-HMA, we immunopurified WT coHPDL-FLAG from human cells and assayed HPDL activity. Like HmaS, HPDL synthesized 4-HMA from 4-HPPA, but not Tyr or 4-HPLA (Figure 2c). HPDL did not make homogentisate, the product of HPD. Catalytically-impaired HPDL mutants did not produce 4-HMA from 4-HPPA (Figure 2d). This confirmed that HPDL, and not a potential HPDL-interacting enzyme, makes 4-HMA from 4-HPPA. Therefore, humans have an undescribed, non-canonical tyrosine catabolism pathway in which HPDL converts 4-HPPA to 4-HMA (Figure 2e) for unknown reasons.
In other species, 4-HMA is the precursor of antibiotics18,19,20, and an antioxidant, protocatechuate21. During protocatechuate synthesis, 4-HMA is degraded to 4-hydroxybenzoate (4-HB). In human cells, 4-HB generates the redox-active headgroup of coenzyme Q10 (CoQ10), an essential component of the electron transport chain and an antioxidant (Extended Data Figure 8a). Tyr and 4-HPPA are known 4-HB precursors in yeast and mammals. However, the CoQ10 headgroup biosynthesis pathway intermediates in higher eukaryotic cells have long been elusive (Extended Data Figure 8a)22. We asked whether human cells used 4-HMA to make 4-HB and CoQ10.
Endogenous 4-HB in mammalian cells was below the limit of detection of our LC-MS methods. Therefore, we used CoQ10 as an indirect readout of 4-HB production. CoQ10 is biosynthesized from Tyr, but not Phe, in human cells (Extended Data Figure 8b). CoQ10 biosynthesis correlated with oxygen levels (Extended Data Figure 8c) and CoQ10 labelling from 13C9-Tyr was completely blocked by IOX1 and DFO (Extended Data Figure 8d). This was consistent with the known role of several iron-containing monooxygenases in CoQ10 synthesis (Extended Data Figure 8a)23,24 and the involvement of an unknown Fe-dioxygenase. Initial experiments did not identify significant differences in Tyr-derived CoQ10 in HPDL KO cells. However, expression of WT, but not catalytically inactive HPDL, increased 13C-labelled CoQ10 (Extended Data Figure 8e–f). These data suggest that HPDL and 4-HMA are involved in CoQ10 biosynthesis, but that HPDL loss may only affect CoQ10 labelling under specific culture conditions.
We tested whether 4-HMA could be shared between cells in which HPDL was knocked out in a pooled setting. Control cells secreted 4-HMA at high cell densities. However, HPDL KO cells did not release detectable levels of 4-HMA (Extended Data Figure 8h). Interestingly, we noticed that CoQ10 biosynthesis was higher in control cells cultured at higher densities (Extended Data Figure 8i). Under these conditions, HPDL KO significantly decreased CoQ10 labelling by 13C9-Tyr (Figure 3a; Extended Data Figure 8g, i). CoQ10 labelling was restored by addback of coHPDL WT, but not catalytically impaired mutant coHPDL. These data suggest that HPDL enables increased CoQ10 biosynthesis in dense cell cultures.
Figure 3.

HPDL and 4-HMA participate in the human CoQ10 headgroup biosynthesis pathway. a, Unlabelled and 13C6-labelled CoQ10 levels from MIAPACA2 cells grown in 13C9-Tyr media at low (LD) and high density (HD) (n=3). b, 3D growth assays in the indicated MIAPACA2 cells (n=4). c, Fractional labelling of CoQ10 from 13C9-Tyr in the indicated MIAPACA2 cells grown in 3D conditions (n=4). d, Oxygen consumption rates (OCR) from the indicated MIAPACA2 cells grown in 3D conditions (n=5). e-f, 3D growth assays (e) or OCR (f) in the indicated MIAPACA2 cells treated with or without 1mM 4-HMA or 4-HB (n=4). g, Summary of HPDL and 4-HMA in the human CoQ10 headgroup biosynthesis pathway. More details can be found in Extended Data Figure 11. “n” represents the number of biologically independent experiments for each group and condition. Graphs (mean ± s.e.m) were compared using one- (b-d, f) or two (a, e, g) way ANOVA, followed by Tukey post-hoc test (*p<0.05, ^p<0.01, %p<0.005, #p<0.0001).
Next, we tested if 4-HMA was used for CoQ10 biosynthesis. Because isotopically labelled 4-HMA and precursors were not available, we labelled cellular CoQ10 with 13C9-Tyr for two weeks, followed by 24-hour addition of 12C-Tyr alone or unlabelled candidate CoQ10 headgroup intermediates (Extended Data Figure 9a). Addition of Tyr-derived intermediates did not affect cell proliferation (Extended Data Figure 9b). Addition of 4-HPPA, 4-HPLA, 4-HMA, and 4-HB resulted in intracellular accumulation of each unlabelled metabolite and products, except for 4-HB (Extended Data Figure 9c). 4-HPPA, 4-HPLA, and 4-HMA have minimal effect of on 4-HB levels, suggesting that 4-HB levels are tightly regulated. 4-HPLA did not increase Tyr or 4-HB levels. These data position 4-HMA between 4-HPPA and 4-HB, and reveal the order of the CoQ10 headgroup biosynthesis pathway as Tyr-HPPA-HMA-HB (Extended Data Figure 9d).
Next, we measured the incorporation of Tyr-derived metabolites into CoQ10. Adherent cells labelled for two weeks in 13C9-Tyr incorporated 13C into 60% of the intracellular CoQ10 pool. After exchange of 13C9-Tyr for 12C9-Tyr for 24 hours, we observed a 20% increase in non-labelled CoQ10. Addition of 4-HPPA, 4-HMA and 4-HB in the presence of 13C9-Tyr increased the fraction and levels of unlabelled CoQ10 by 30% (Extended Data Figure 9c), suggesting that 4-HMA is incorporated into CoQ10. 4-HPLA increased the fraction of non-labelled CoQ10 by 16%. ~70% of 4-HPPA was derived from 13C9-Tyr in the 4-HPLA treated cells, suggesting that 4-HPPA made from 4-HPLA is efficiently incorporated into CoQ10, or that there is a 4-HPLA-dependent CoQ10 synthesis pathway.
To understand the functional role of CoQ10 synthesis in human cells, we genetically suppressed enzymes upstream (e.g., TAT) and downstream (e.g., COQ2) of HPDL in the CoQ10 biosynthesis pathway, as well as mammalian orthologs of yeast CoQ10 synthesis enzymes (e.g., LDHD and ALDH3A1) (Extended Data Figure 9d)25–27. Loss of these enzymes had varying effects on CoQ10 levels but no effect on 2D cell growth. ALDH3A1 KO effects may be masked by promiscuous activity of other aldehyde dehydrogenases. (Extended Data Figure 9e–h). Because CoQ10 is important for cancer cell proliferation in 3D culture28, we tested whether loss of CoQ10 synthesis enzymes affected 3D growth. HPDL loss impaired 3D growth, which was restored by expression of wild-type, but not catalytically impaired coHPDL (Figure 3b). Similarly, KO of other CoQ10 synthesis pathway enzymes decreased growth in 3D culture (Extended Data Figure 9i). HPDL KO cells exhibited lower fractional labelling of CoQ10 from 13C9-Tyr, which was restored by expression of WT, but not catalytically impaired coHPDL (Figure 3c). These results indicate that PDAC cells require CoQ10 for optimal growth in 3D culture, and are consistent with the observation that CoQ10 synthesis is increased in cells cultured at high density29, which is mimicked by 3D culture.
Many of the CoQ10 biosynthesis enzymes reside in the mitochondria and supply CoQ10 to the electron transport chain30. We found that HPDL was located in the mitochondria (Extended Data Figure 9j, 9l). We measured Tyr-derived CoQ10 in cells and isolated mitochondria. Mitochondrial CoQ10 labelling from 13C9-Tyr was reduced to the same extent as total CoQ10 in HPDL KO cells (Extended Data Figure 9k) and was restored by expression of WT, but not catalytically impaired mutant coHPDL. HPDL KO cells exhibited a lower oxygen consumption rate (OCR) than control cells (Figure 3d). Expression of coHPDL WT, but not catalytically impaired mutant coHPDL, restored OCR. Treatment of HPDL KO cells with exogenous 4-HMA or 4-HB increased 3D growth and OCR (Figure 3e–f). These data indicate that HPDL activity and its product, 4-HMA, are important for mitochondrial CoQ10 synthesis and respiration, and cell growth.
Because CoQ10 is important for tumour growth31, we tested if HPDL and the 4-HMA pathway were needed for PDAC growth in vivo. PDAC cells (MIAPACA2 and PATU-8902) expressing control and HPDL sgRNAs, with or without WT or catalytically impaired mutant coHPDL, were injected into the pancreatic head or the flank of nude mice (Extended Data Figure 10a–g). After 6 weeks, MIAPACA2 HPDL KO tumours were significantly smaller than controls (Extended Data Figure 10a–c). Tumour burden was increased in MIAPACA2 HPDL KO tumours by expression of WT, but not catalytically inactive mutant coHPDL (Extended Data Figure 10a). MIAPACA2 HPDL KO tumours exhibited increased proliferation by phospho-histone H3 (p-HH3) staining, but also had higher levels of cell death by cleaved caspase 3 (CC3) (Extended Data Figure 10h–i). Decreased tumour burden following HPDL KO was likely due to a higher cell death to proliferation ratio (Figure 10i). Although HPDL was important for MIAPACA2 tumours implanted orthotopically, loss of HPDL was dispensable for orthotopic and subcutaneous PATU-8902 tumour growth. PDAC patients with high expression of HPDL have significantly lower overall and progression-free survival (Extended Data Figure 10j). These results show that HPDL activity promotes the growth and survival of a subset of PDAC tumours, and that there is heterogeneity in PDAC dependence on HPDL.
The CoQ10 headgroup synthesis pathway in human cells has long been elusive22,25,26,32–34. Here we label cells with 18O2 and identify 4-HMA as the most highly oxygen-labelled metabolite in multiple human cell lines. We genetically and biochemically identify HPDL as the human dioxygenase that makes 4-HMA, and we find that HPDL and 4-HMA contribute to the biosynthesis of Tyr-derived CoQ10 (Figure 3g and Extended Data Figure 11). Evolutionary studies of HPDL show that this enzyme is present in other eukaryotes (Supplementary Table 2)3. It is tempting to speculate that HPDL generates 4-HB in species that no longer have the aromatic amino acid synthesis pathways needed to make other 4-HB precursors, such as chorismate. Further work will be needed to elucidate additional enzymes in the human CoQ10 headgroup biosynthesis pathway.
CoQ10 levels appear to be fairly stable in human cells following HPDL deletion. Uptake of CoQ10 could maintain cellular CoQ10 levels. Alternately, CoQ10 may have a long half-life and the CoQ10 biosynthesis pathway may make just enough CoQ10 to support cell growth and division, as do many coenzyme biosynthesis pathways in microorganisms35. Tight control of CoQ10 headgroup synthesis also would explain the minimal effect of exogenous 4-HPPA and 4-HMA on 4-HB levels. Our finding that deletion of the 4-HB-consuming enzyme COQ2 minimally affects 4-HB pools may be explained by incomplete COQ2 KO in a pooled setting (Extended Data Figure 9e). COQ2 is a common essential gene in multiple cancer cell lines36 because complete loss of COQ2 blocks CoQ10 biosynthesis. The tight regulation of 4-HB levels and COQ10 biosynthesis warrants further investigation.
HPDL activity and 4-HMA production impact PDAC cell line 3D growth, and HPDL activity enables the growth of MIAPACA2 orthotopic xenografts. HPDL overexpression also accelerates PDAC growth in vitro5. In our hands, HPDL deletion does not significantly decrease the growth of orthotopic or subcutaneous PATU-8902 tumours, which may be due to redundant CoQ10 headgroup synthesis pathways or to scavenging of CoQ10 or biosynthetic intermediates. PDAC patients with high HPDL expression have poor overall survival, and therapies targeting HPDL or CoQ10 biosynthesis may benefit these patients. However, we will need to understand the heterogeneity of tumour dependence on HPDL before such therapies will be useful.
Mutations in COQ enzymes can result in CoQ10 deficiency and a wide variety of clinical pathologies30. Recently, HPDL variants were associated with childhood spastic cerebral palsy and severe neurodevelopmental delay with myelination defects1–4. Hpdl KO mice exhibited epilepsy, smaller brain sizes due to apoptosis, and perinatal lethality, which phenocopied neurodegenerative disease in patients with HPDL variants3. Our data suggest that HPDL mutations may impair mitochondrial CoQ10 synthesis, and that treatment of patients who carry HPDL mutations with 4-HMA, 4-HB, or CoQ10 may stabilize or ameliorate some of their symptoms.
Our work reveals a number of 18O-labelled polar features, including a long-sought intermediate in the mammalian CoQ10 headgroup biosynthesis pathway. Gaseous labelling can determine the fate of O2 or any biologically relevant gas in small molecules, lipids, DNA, RNA and protein (Extended Data Figure 12). Treatment of cultured cells and model organisms with isotopically labelled gases and identification of molecules modified by these gases will permit intensive study of the field of gaseous biology and reveal new roles for gases in human health and disease.
Methods
Equipment and Reagents
A modular incubator chamber and dual flow meter were purchased from Billups-Rothenberg inc. 18O2:CO2:N2 gas mixtures were purchased from Icon Isotopes. N2 and 16O2:CO2:N2 were purchased from Airgas. An oxygen sensor (Altair 4 XR) was purchased from and calibrated by MSA.
4-hydroxyphenylpyruvate, 4-DL-hydroxyphenyllactate, and sodium ascorbate were purchased from Millipore Sigma. 4-DL-hydroxymandelate and 4-hydroxybenzoate were purchased from Alfa Aesar. MG132 and IOX1 were purchased from Tocris. 13C9-tyrosine, 13C6-phenylalanine and labelled amino acid internal standards were purchased from Cambridge Isotope Laboratories. Antibodies were purchased and used for immunoblotting at the manufacturer-recommended concentrations. See Supplementary Table 3 for a complete list of reagents.
Software and versions used for analysis are listed in the in the Supplementary Table 3.
Cell Culture and Infection
MIAPACA2 cells were purchased from the American Type Culture Collection. No lines used in this study are found in the ICLAC or NCBI Biosample databases of commonly misidentified cell lines. Cultures were routinely verified to be negative for mycoplasma by PCR. Cell lines were authenticated by periodic STR fingerprinting and visual inspection, and low passage cultures were maintained in a central lab cell bank37. 293T cells were used to generate lentivirus for stable expression of constructs in cell lines. Cells were stably infected with an all-in-one pLentiCRISPRv2 (TLCV2)-lentiviral vector expressing a dox-inducible-Cas9-2A-eGFP and U6-driven sgRNA guides against Tomato (sgTOM), Luciferase (sgLUC), or HPDL (sgHPDL) (See Supplementary Table 3 for sequences). sgRNA-resistant coHPDL-FLAG wild-type (WT) and catalytically impaired mutants (H258A and H163/258A) were stably expressed in HPDL-KO cells using a lentiviral vector harbouring a blasticidin resistance gene, pLenti6.2. Cells were selected with 2 μg/mL puromycin for 2 days or 10 μg/mL blasticidin for 10 days. All cell lines were maintained in DMEM+10%FBS. Growth curves and experiments were performed with DMEM (high glucose, no pyruvate) + 10% dialyzed FBS, and measured with a CyQUANT Cell Proliferation Assay kit (ThermoFisher) following the manufacturer’s instructions.
3D Growth Assay
Approximately 2,500 cells were seeded into a low-attachment 96-well plate containing DMEM + 10%diaFBS and 5% Matrigel. Cells were grown for three days at 37°C and 5% CO2. Cells were also treated or without 1mM 4-HMA or 4-HB for the duration of the assay. To measure 3D growth with the CyQUANT Cell Proliferation Assay kit, plates were frozen at −80°C, thawed at room temperature, and equal volumes of 2X CyQUANT reagent + lysis buffer was added to the wells. As a control, wells containing media + 5% Matrigel and no cells were used as blanks. CyQUANT measurements were performed as described in the manufacturer’s instructions.
Labelling with 18O2
All steps involved in setting up labelling with 18O2 are performed at room temperature and inside a chemical fume hood. The procedure may vary depending on the type and number of tissue culture plates in the chamber and the volume of media in the plates. Users must test the system by using 16O2:CO2:N2 or other unlabelled gases to optimize conditions for their needs and avoid consumption of costly labelled gases. Cells were treated with or without 5μM MG132, 500 μM IOX1, 250μM DFO, or 70μM ascorbate, before placing tissue culture plates into the modular incubator chamber (MIC) containing a wireless oxygen sensor and a 15 cm dish of water to maintain humidity. Next, the clamps were closed to form an air-tight seal between the lid and platform of the MIC. To expel natural O2 from the chamber, both the inlet and outlet valves of the MIC were opened, and N2 was flushed into the system at a rate of 40L/min for 2 minutes, after which both valves were quickly closed to allow the system to equilibrate for 10 minutes. N2 flushing was repeated a total of three times, or until the sensor in the chamber stabilized at 0% O2 for 10 minutes.
Next, the inlet valve was opened and the 18O2: 5% CO2:N2 gaseous mixture was flushed into the system at a rate of 2.5L/min. Subsequently, the outlet valve was immediately opened to allow gas flow out of the chamber, and to release the pressure in the system. The chamber was injected with the 18O2: 5% CO2:N2 gaseous mixture for 1 minute before the inlet and outlet valves were closed simultaneously. The chamber was allowed to equilibrate for 5 minutes. This process was repeated seven times, or until the desired oxygen concentration was reached and was stable. For 3%, 1%, and 0.2% 18O2 labelling studies, the chamber was infused with 5%:5%:90%, 1.5%:5%:93.5%, and 0.5%:5%:94.5% 18O2:CO2:N2, respectively. The entire process took approximately one hour, and was continuously monitored with an oxygen sensor in the chamber (Extended Data Figure 1a). The 18O2-infused MIC was placed in a 37°C, 5% CO2 tissue culture incubator for 24 hours. The oxygen concentration in the chamber was monitored regularly. Oxygen concentrations in the closed chamber remained stable at all tested oxygen tensions for at least 20 hours (Extended Data Figure 1b–d). Oxygen measurements after 20 hours were not feasible due to the battery life of the sensor. This indicated that during the duration of the gaseous labelling studies, the total 18O2 abundance in the chamber was not limiting nor was there excess atmospheric oxygen adsorbed to the plates or dissolved in the media. At the end of the experiment, the chamber was opened inside a chemical fume hood before metabolite extraction.
HPDL Enzymatic Assay
Cell lysates were generated in TNE lysis buffer (50mM Tris-HCl pH 8.0, 150mM NaCl, 2mM EDTA, and 1% NP-40, supplemented with protease (ThermoFisher Scientific) and phosphatase (10mM NaF, 10mM β-glycerophosphate, and 10mM sodium pyrophosphate) inhibitors. HPDL-FLAG was immunoprecipitated using anti-FLAG M2 magnetic beads (Millipore Sigma, M8823). Cell lysates were incubated with anti-FLAG M2 magnetic beads for 1 hour at 4°C on a rotating platform. Beads were washed four times with TNE lysis buffer, and 10% and 90% of the immunopurified protein was used for immunoblotting or enzymatic assay, respectively. For the HPDL enzymatic assay, beads were incubated in assay buffer (20mM HEPES pH 7.4, 20μM FeSO4, 0.5mM sodium ascorbate, and 1mM β-mercaptoethanol) containing 400μM of substrate (tyrosine, 4-hydroxyphenylpyruvate, or 4-hydroxyphenyllactate) for 1 hour at 37°C. At the end of the assay, 10uL of assay buffer was retrieved and prepared for analysis by gas chromatography-mass spectrometry (GC-MS, see Metabolomics section).
Immunoblotting
For immunoblotting and HIF1α immunoprecipitation, whole cell lysates were generated in modified radioimmunoprecipitation (RIPA) buffer (50mM Tris-HCl pH 8.0, 150mM NaCl, 2mM EDTA, 1% NP-40, and 0.1% SDS, without sodium deoxycholate supplemented with protease (ThermoFisher Scientific) and phosphatase (10mM NaF, 1mM Na3VO4, 10mM β-glycerophosphate, and 10mM sodium pyrophosphate) inhibitors. Protein lysates for HIF1α immunoprecipitation were precleared with Protein G sepharose beads for 20mins, and transferred to a new tube containing control IgG or mouse anti-HIF1α antibody. Lysates containing antibodies were incubated overnight at 4°C on a rotating platform, followed by incubation with protein G sepharose beads for 3 hours. Immunoprecipitations were washed with modified RIPA buffer and analysed by immunoblotting. Protein lysates were loaded into 4-12% gradient Bolt gels (Life Technologies) and transferred with 1X transfer buffer (Tris-glycine) and 10% methanol. Membranes were incubated with their respective primary antibodies, and visualized with IRDye infrared secondary antibodies using an Odyssey Infrared imaging system (Li-Cor Biosciences). Antibody suppliers, catalogue numbers, and dilutions are listed in the Supplementary Table 3 and the Reporting Summary.
Mitochondrial Purification
Mitochondria were purified from cells using a Qproteome Mitochondria Isolation Kit (Qiagen), following the manufacturer’s instructions. Briefly, cells were trypsinized, washed, and resuspended in 0.9% saline. About 10% of the cell suspension was set aside for total protein analysis, and the remaining suspension was used for mitochondrial purification. The cytosolic fraction was kept for further downstream analysis. Purified mitochondria were washed and resuspended in 0.9% saline. 10% of the mitochondria suspension was transferred to a new tube for mitochondrial protein analysis, and the remaining suspension was extracted with 46% methanol:23% H2O:31% chloroform as described in the Metabolomics section. and the CH3Cl fraction set aside for lipids. Protein lysates were generated from the total, cytosolic, and mitochondria fractions with modified RIPA buffer supplemented with protease and phosphatase inhibitors. Equal cell volumes of total, cytosolic and mitochondria protein were evaluated by immunoblotting to check mitochondrial purity.
Metabolomics
Briefly, cells were washed in 4°C 0.9% saline and metabolites were extracted with 46% methanol:23% H2O:31% chloroform that contained a labelled amino acid standard mix (MSK-A2-1.2, Cambridge Isotope Laboratories, Inc.). Enzymatic assay samples were extracted using 80% methanol: 20% H2O that contained labelled amino acid standards. Extracts were placed into 1.5mL Eppendorf tubes, vortexed at 4°C for 10mins and centrifuged at 4°C for 10mins at 17,200 x g in a microcentrifuge. The aqueous phase was transferred to vials for GC-MS or Eppendorf tubes for LC-MS. Polar samples were evaporated in a SpeedVac and samples were resolved by GC-MS or LC-MS. Lipid samples were dried using a stream of N2 (for 18O-labelling studies) or air. Metabolite and lipid extracts were submitted to the NYULMC Metabolomics Core Resource Laboratory.
GC-MS was carried out as previously described38. In brief, metabolite extracts were derivatized with a solution of methoxamine (Sigma) dissolved in pyridine (Sigma) for 30mins at 37°C. An equal volume of MSTBSTFA + 1% tert-butyldimethylsilane chloride (TBDMS-Cl) was added to the mixture and incubated at 37°C for 30mins. Samples were resolved by GC-MS (Agilent 7890B with a DB-35ms Ultra Inert 30 m x 0.25 mm i.d., 0.25 μm column coupled to a 5977B mass spectrometer). Metabolites were identified by unique fragments and retention time compared to known standards. Peaks were picked using OpenChrom39 and analysed using MATLAB as described40.
For polar metabolomics, the LC column was a Millipore ZIC-pHILIC (2.1 x 150 mM, 5 μm bead size) coupled to a Dionex UltiMate 3000 system. The column oven temperature was held at 25 °C. The flow rate was 100 μL/min and the injection volume was 1 μL. Buffer A was 10 mM ammonium carbonate in water, pH 9, and Buffer B was neat acetonitrile. The gradient profile was 80-20% B (0-30 min), 20-80% B (30-31 min), and 80-80% B (31-42 min). MS Analyses were carried out on a Thermo Q Exactive HF mass spectrometer using a heated electrospray ionization (HESI) source. The method duration was 30 minutes using a polarity-switching, top 5 method. The spray voltage for both positive and negative ion modes was 3.5 kV. The capillary temperature was 320 °C with a maximum spray current of 100 μA. The full MS scan was carried out at 120,000 resolution with a scan range of 67-1000 m/z. For 18O2 labelling experiments, full MS scans were carried out at 240,000 resolution at the same scan range. Tandem MS spectra were obtained at 15,000 resolution. All data were acquired in profile mode. Peak heights were analysed using Xcalibur (ThermoFisher Scientific).
Lipid metabolomics were acquired using a Waters CSH-C18 (2.1 x 100 mm, 1.7 μm) column coupled to a Dionex UltiMate 3000 system. The column oven temperature was held at 55 °C. The flow rate was 300 μL/min and the injection volume was 1 μL. Buffer A was 60:40 acetonitrile:water, 0.1% formic acid and Buffer B was 90:10 isopropanol:acetonitrile, 10 mM ammonium formate. The gradient profile was 40-43%B (0-1.25 min), 43-50% B (1.25-2 min), 50-54% B (2-11 min), 54-70% B (11-12 min), 70-99% B (12-18 min), 70-99% B (18-32 min), 99-40% B (23-24 min), hold at 40% B (1 min). MS Analyses were carried out on a Thermo Q Exactive HF mass spectrometer using a heated electrospray ionization (HESI) source. The method duration was 20 minutes using a polarity-switching, top 10 method. The spray voltage for both positive and negative ion modes was 3.5 kV. The capillary temperature was 320 °C with a maximum spray current of 100 μA. The full MS scan was carried out at 120,000 resolution with a scan range of 350-2000 m/z. For 18O2 labelling experiments, full MS scan was carried out at 240,000 resolution at the same scan range. Tandem MS spectra were obtained at 15,000 resolution. All data were acquired in profile mode. Peak heights were analysed using Xcalibur (ThermoFisher Scientific).
Identification of 18O2 labelled features and metabolites was performed as described in Figure 1b. Briefly, all features with a minimum signal intensity of 10,000 and a signal-to-noise ratio of 10 were obtained from the 16O2 (control) samples by the NYULMC Metabolomics Core. Background features from blank sample runs were removed from the total features in the samples if signalSample was less than two times the signalBlank. Features identified after 20 mins were also removed. Using this list of 16O features, we measured the incorporation of 18O2 into labelled samples for the unlabelled and labelled 18O features using a mass difference of +2.0042m/z per 18O atom. As the number of oxygen atoms per feature was not known, we assumed that no more than three 18O atoms would be incorporated per metabolite. Candidate features with 18O labelling were selected based on observed fractional labelling in three replicates being greater than the natural abundance of one, two or three 18O atoms for a given metabolite. For example, for the incorporation of one 18O, the fractional labelling cut-off was set to 0.25% fractional labelling to exceed the natural abundance of a single 18O atom, which is 0.2%. In addition, the observed 18O fractional labelling in the 18O2 samples had to be two times higher than in the 16O2 samples. The features list was manually curated by checking the peak shape and retention time of unlabelled and 18O-labelled features. Where possible, unique 18O-labelled features were manually annotated using MS2 fragmentation analysis, NIST database searching, and retention time matching with standards with the help of the NYULMC Metabolomics Core. A second set of 18O2 labelling experiments was carried out to identify overlapping and high confidence 18O labelled metabolites. A comprehensive list of 46 18O-labelled metabolites was generated from these two datasets.
All metabolites were normalised to the closest labelled amino acid standard and to the respective fold difference in cell number of the samples per experiment.
Oxygen consumption measurements in Spheroids
Oxygen consumption rate (OCR) was measured with an XF96 analyser (Seahorse Bioscience) and the Seahorse XFe96 Spheroid FluxPak, as described by the manufacturer’s protocol. Spheroids were generated by seeding 40,000 cells per well into a low-attachment U-bottom 96-well plate with DMEM+10% dialysed FBS and 5% Matrigel. If indicated, spheroids were treated with or without 1mM 4-HMA or 4-HB for the duration of the assay. Spheroids were allowed to form for three days before oxygen consumption measurement. Each spheroid was transferred to a Spheroid FluxPak plate containing DMEM (25mM glucose, 4mM glutamine, and without pyruvate, phenol red and bicarbonate), and allowed to equilibrate for 1hr at 37°C, no CO2. OCR measurements were normalised to size of the spheroid.
Mouse xenografts
All animal studies were approved by the NYULMC IACUC (Institutional Animal Care and Use Committee, Protocols #IA16-00507 and IA16-01862) and conducted in compliance with IACUC guidelines and humane endpoints.
Pancreas orthotopic and flank xenografts were established as follows. Briefly, 7–8-week-old female immunocompromised athymic nude mice (CrTac:NCr-Foxn1nu) were orthotopically injected with tumour cells into the pancreas or subcutaneously injected into the flank. For orthotopic xenografts, mice were anaesthetized with ketamine (120mg/kg) and xylazine (10mg/kg) before surgery. MIAPACA2 or PATU-8902 (1 x 10⁴) cells expressing control or HPDL sgRNA, with or without sgRNA-resistant codon-optimized HPDL (coHPDL) wild-type and catalytically impaired mutant were suspended in 20 μL of 50% growth factor-reduced Matrigel (BD Science), and injected into the pancreas or flank. Any error during injection was recorded as a failed injection. Mice were treated with buprenorphine every 12 hours after surgery for 48 hours. The maximum tumour size was 2 cm, which was not exceeded during experiments.
Mice were housed at 22±1°C, 30-70% relative humidity, in a temperature controlled ABSL-2 facility with 12-hour day-night light cycles. Mice were cared for by the husbandry staff at NYULH DCM (division of comparative medicine), and diet and water were provided ad libitum.
In vivo data include all mice for transparency. Mice with failed injections are recorded in the source data, did not develop tumours, and were excluded from statistical analyses. Experiments with failed injections were repeated to ensure robustness of the results.
Immunohistochemistry
Paraffin sections were deparaffinized and antigens were unmasked with citrate (pH 6) and heat. Sections were treated with 3% hydrogen peroxide before being blocked with 1% goat serum in PBS. Samples that were unmasked with citrate buffer were stained with phospho-Histone H3, and cleaved caspase 3. Sections were then stained using a Vectastain anti-rabbit HRP kit (Vector Laboratories) and a DAB (3,3’-diaminobenzidine) peroxidase substrate kit (Vector Laboratories). Briefly, sections were then incubated with biotinylated anti-rabbit antibodies, then with streptavidin-HRP and developed with DAB. Slides were scanned at the NYULMC Experimental Pathology Research Laboratory (NYULMC, New York, NY, USA) and whole tissue staining was quantified by Aperio ImageScope software (Leica Biosystems) in non-necrotic areas.
Bioinformatics
The Cancer Genome Atlas (TCGA) PDAC dataset (RNA-seq and survival data) was obtained from cBioportal (TCGA, Firehose Legacy)41,42. For overall and progression-free survival, samples were grouped into HPDL high and low expressing tumours, using an expression cut-off of greater or less than the mean expression, respectively. Survival curves were compared using the Log-rank (Mantel-Cox) test.
Experimental Design
Experiments were not done in a blinded fashion. Investigators were not blinded to animal experiments, but multiple co-authors were involved in the assessment of the mouse experiments.
Blinding was not performed on cell culture experiments, but relied on high-throughput 96-well assays to reduce bias.
Quantification and Statistical Analysis
Sample sizes and statistical tests for each experiment are denoted in the figure legends. Data with skewed or non-Gaussian distribution were transformed, followed by the indicated statistical test. Each immunoblot was performed at least three times. All metabolomics data represent at least n=3 biological replicates for each group. The between-group variances were similar, and the data were normally distributed. All analyses and graphs were generated with GraphPad Prism 9. A p-value of <0.05 was considered significant. P values can be found in the figures. Venn diagrams were made using an online bioinformatics tool (http://bioinformatics.psb.ugent.be/webtools/Venn/).
Extended Data
Extended Data Figure 1.

A robust method for 18O2 labelling of human cells. a, Schematic of 18O2 labelling. A closed system chamber is flushed multiple times with N2 to remove 16O2. A gas mixture containing 18O2 and CO2 is pulsed into the closed chamber to reach the desired oxygen concentration. At the assay endpoint, the chamber is opened, cells are extracted, and metabolites separated and identified by liquid chromatography-tandem mass spectrometry (LC-MS/MS). b, Oxygen measurements after N2 flush, followed with or without pulses of O2:CO2 gas mixture in the closed chamber containing tissue culture plates and media (n=3 technical replicates each). c-e, Oxygen percentage of O2-labelling experiments performed at 3% (c), 1% (d), and 0.2% (e) 16O2 or 18O2. (n=2 technical replicates each). f, Cells were treated with several concentrations of MG132, DFO (an iron chelator), IOX1 (a dioxygenase inhibitor), or in combination at 5% O2 for 24 hours. Immunoblots of HIF1α with ERK2 as a loading control. g, Immunoprecipitation of HIF1α to determine its hydroxylation (P564-OH) levels by the indicated inhibitors. Immunoblots of HIF1α and HIF1α P564-OH are shown, with ERK2 serving as a loading control. Experiments were performed once for optimization of drug concentrations (f, g). Graphs represent mean ± s.d. (c-e).
Extended Data Figure 2.

18O2 labelling of human cells reveals the oxy-metabolome. a, Schematic of the approach used to identify 18O-labelled features and metabolites that were labelled by 18O. “n” represents the number of features or metabolites identified in MIAPACA2 cells grown at 3% 18O2. See b for details. b, Summary of total and percentage of identified 18O-labelled features for each cell line and oxygen tension as described in a. c, Venn diagram demonstrating the overlap of unique 18O-labelled metabolite and features identified for each oxygen condition per cell line. d, Total number of unique dioxygenase-dependent, 18O-labelled metabolites and features identified in each cell line and condition. Features were categorized into predicted or not predicted/unknown 18O-labelled metabolites, based on known oxygen-dependent metabolic pathways, and sensitivity or insensitivity to IOX1 (dioxygenase inhibitor) treatment. e, Number of 18O-labelled metabolites detected in cells grown in 3%, 1%, and 0.2% 18O2 for 24 hours in two sets of experiments. The overlap of the total number of detected 18O-labelled metabolites and features in both experimental sets are shown. f, Venn diagram representing the distribution of common and unique 18O-labelled metabolites identified in each cell line. g, List of the 46 unique 18O-labelled metabolites that were identified in f and categorized into known oxygen-dependent metabolic pathways. ** represents metabolites that have matching MS2 spectra, but need to be validated due to multiple metabolite isomers.
Extended Data Figure 3.

Fractional 18O labelling of metabolites and features identified in human cells by 18O2 labelling. a, Heatmap representing the median fractional 18O labelling of the 49 metabolites and features in the indicated cell lines and oxygen tensions. “**” represents metabolites that have matching MS2 spectra, but need to be validated due to multiple metabolite isomers. The red arrow indicates a highly labelled unknown metabolite. b, Correlation matrixes demonstrating the Spearman rs value based on the fractional 18O labelling of the 46 metabolites and features across the indicated cell lines and oxygen tensions. c, Fractional 18O labelling of unknown feature (167.0339 in negative ion mode, elution time of 8.2 minutes) in MIAPACA2, A498, and SKNDZ cells grown in 3%, 1%, and 0.2% 18O2, and treated with vehicle or IOX1 (dioxygenase inhibitor) for 24 hours (n=3). d-i, Fractional 18O labelling of metabolites and features by 18O2 across multiple cell lines in response to different oxygen tensions, treated with or without IOX1 (dioxygenase inhibitor) for 24 hours. 18O labelling of predicted (d-e), not predicted (f-h), and unknown (i) metabolites or features are shown for the indicated cell line. ** represents metabolites that have matching MS2 spectra, but need to be validated due to multiple metabolite isomers. n=3 biologically independent samples for each group and condition in all experiments. Graphs represent mean ± s.e.m. and were compared using one- (b-d) or two-way ANOVA (a, e-f), followed by Tukey post-hoc test (*p<0.05, ^p<0.01, %p<0.005, #p<0.0001).
Extended Data Figure 4.

Total levels of unlabelled and 18O-labelled metabolites identified in human cells. a, Schematic of the carnitine biosynthesis pathway. Dioxygenases, TMLH (Trimethyllysine hydroxylase) and BBOX (butyrobetaine, 2-oxoglutarate dioxygenase), are shown in orange boxes, and 18O labelling is indicated in blue with arrows. b-d, Total intracellular levels of unlabelled and 18O-labelled γ-butyrobetaine from cells grown in 3%, 1%, and 0.2% 18O2 with the indicated reagents for 24 hours (n=3). e, Schematic of methionine salvage pathway. ADI1 (Acireductone dioxygenase 1), a dioxygenase, is shown in orange, and 18O labelling is indicated in blue with arrows. f-h, Total intracellular levels of unlabelled and 18O-labelled methionine from cells grown in 3%, 1%, and 0.2% 18O2 with the indicated reagents for 24 hours (n=3). i, Schematic of methionine oxidation by 18O-labelled reactive oxygen species with arrows. j-m, Total intracellular levels of unlabelled and 18O-labelled methionine sulfoxide from cells grown in 3%, 1%, and 0.2% 18O2 with the indicated reagents for 24 hours (n=3). “n” represents the number of biologically independent experiments for each group and condition. Graphs (mean ± s.e.m.) were compared using two-tailed Student t-test (c-d, g-h, k-m) or one-way (b, f, j) ANOVA, followed by Tukey post-hoc test (*p<0.05, ^p<0.01, %p<0.005, #p<0.0001).
Extended Data Figure 5.

Identification of 18O-labelled 4-HMA in human cells. a, Tandem mass spectra (MS2) of homogentisate (HGA) standard, 4-hydroxymandelate (4-HMA) standard, and unlabelled (167.0344m/z) feature precursors, and the respective product fragments. Mass differences between the precursor and product ions reflect loss of one CO2. The red line indicates fragmentation of the precursor ion into the two product ions. The structure of the precursor and product ions are depicted on the left. b, MS2 of unlabelled (167.0344 m/z), +one 18O (169.0387 m/z), and +two 18O (171.0428 m/z) labelled 4-HMA precursors, and the respective product fragments. Mass differences between precursor and product ions, reflects loss of unlabelled and +one 18O-labelled CO2. The red line indicates precursor ion fragmentation into two product ions. The structure and position of 18O-labelled (blue and arrow) 4-HMA are depicted on the left. c-d, Total levels of unlabelled and 18O-labelled 4-HMA levels in A498 (c) and SKNDZ (d) cells grown in 3%, 1%, and 0.2% 18O2, and treated with or without IOX1 (dioxygenase inhibitor) for 24 hours. n=3 in biologically independent replicates for each group and condition. Graphs represent mean ± s.e.m. and were compared by two-way ANOVA (c-d), followed by Bonferroni post-hoc test (*p<0.05, ^p<0.01, %p<0.005, #p<0.0001).
Extended Data Figure 6.

4-HMA is a tyrosine-derived metabolite synthesized from tyrosine in human cells. a, Schematic of known and proposed pathways involved in 4-HMA biosynthesis found in the literature. A. orientalis biosynthesizes 4-HMA from 4-hydroxyphenylpyruvate (4-HPPA), via hydroxymandelate synthase (HmaS), an Fe-dioxygenase. 4-HMA also has been proposed to be made from tyramine in rabbits by radioactive tracing studies. However, the proposed pathway was never formally demonstrated, as indicated by the dotted lines and box. b, Fractional labelling of Phe, Tyr, 4-HPPA, 4-HPLA, and 4-HMA from cells grown at 3% O2 with or without 13C9-Tyr or 13C6-Phe for 24 hours (n=5 for each group). c, Total intracellular levels of unlabelled and 13C-labelled Tyr, 4-HPPA, 4-HPLA, and 4-HMA from cells grown at 3%, 1%, and 0.2% O2 with 13C-Tyr for 24 hours (n=5 for each group). d, Total intracellular levels of unlabelled and 13C-labelled Tyr, 4-HPPA, 4-HPLA, and 4-HMA from cells grown in 13C-Tyr at 3% O2 with the indicated reagents for 24 hours (n=5 for each group). “n” represents the number of biologically independent replicates for each group and condition. Graphs represent mean ± s.e.m. and were compared by two-way ANOVA (b-d), followed by Tukey post-hoc test (*p<0.05, ^p<0.01, %p<0.005, #p<0.0001).
Extended Data Figure 7.

Human HPDL is an ortholog of A. orientalis HmaS. a-b, Phylogenetic tree of HPD, HPDL, and HmaS cDNA (a) and protein (b) sequences across several model organisms. c, Protein sequence alignment of HPD, HPDL and HmaS. Catalytic histidines involved in coordinating the iron ion needed for activity are highlighted in red. Specific residues in Steptomyces avermitilis and Pseudomonas fluorescens HPD have been mutated in other studies, and the human equivalent mutations are as indicated; hydrophobic (blue), polar (green) amino acids and proline (yellow). The HPD P239T mutant decreases HGA production and generates oxopinone. The N241I/L mutation abolishes HGA production by HPD. The HPD S226A mutations blocks HGA production. However, the mutation in the equivalent site in HMS (S201A) does not affect the generation of 4-HMA. The F337V/L mutation in HPD decreases HGA synthesis and allows slight production of 4-HMA. d, Growth curve of MIAPACA2 cells with sgRNAs at 21% O2. (n=3 technical replicates for each cell line, performed at least twice). e, Unlabelled and 13C8-labelled 4-HMA from PATU-8902 cells grown in 13C9-Tyr at 21% 16O2 for 24 hours. (n=3). Immunoblots of HPDL levels from PATU-8902 cells expressing control and HPDL sgRNAs. ERK2 serves as a loading control. f, Unlabelled and 13C-labelled Tyr, 4-HPPA, 4-HPLA from MIAPACA2 cells were grown in 13C9-Tyr at 21% 16O2 for 24 hours (from Figure 2a). (n=5). g, Unlabelled and 13C-labelled Tyr, 4-HPPA, 4-HPLA from MIAPACA2 sgHPDL #3 cells were grown in 13C9-Tyr at 21% 16O2 for 24 hours (from Figure 2b). (n=5). “n” represents the number of biologically independent replicates for each group and condition, unless indicated (d). Graphs are represented as mean ± s.d. (d) or s.e.m. (e-g) and were compared by two-tailed Student t-test (e), or two-way ANOVA (d, f-g), followed by Tukey post-hoc test (*p<0.05, ^p<0.01, %p<0.005, #p<0.0001).
Extended Data Figure 8.

Expression of HPDL affects 13C9-Tyr labelling of CoQ10. a, Schematic of known and unknown components of the CoQ10 biosynthesis pathway in humans. R1 reflects the polyprenyl tail that is attached to 4-HB. b, Fractional labelling and total levels of CoQ10 from MIAPACA2 grown in unlabelled, 13C9-Tyr-, and 13C6-Phe-labelled media for 24 hours at 3% 16O2. (n=5). c, Fractional labelling and total levels of CoQ10 from MIAPACA2 cells grown in 13C9-Tyr at 21%, 3% and 0.1% 16O2 for 24 hours (n=5). d, Fractional labelling and total levels of CoQ10 from MIAPACA2 cells grown in 13C9-Tyr containing media, with the indicated compounds at 3% 16O2 for 24 hours (n=5). e, Fractional labelling and total intracellular levels of unlabelled and 13C6-labelled CoQ10 from the indicated MIAPACA2 cells. Cells were grown in 13C9-Tyr at 21% 16O2 for 24 hours (n=5). f, Fractional labelling of CoQ10 from indicated MIAPACA2 cells. Cells were grown in 13C9-Tyr at 21% 16O2 for 24 hours. (n=5). g, Unlabelled and 13C6-labelled CoQ10 levels from PATU-8902 cells grown in 13C9-Tyr media (n=3). h, Extracellular concentrations of 13C8-labelled 4-HMA released from MIAPACA2 cells expressing control and HPDL sgRNAs. Cells were grown in 13C9-Tyr at 21% 16O2 for 24 hours at low (LD) and high (HD) cell densities (n=3). Representative images of LD and HD cells are shown. i, The effect of cell density on total intracellular levels of unlabelled and 13C6-labelled CoQ10 from the indicated MIAPACA2 cells. Cells were grown in 13C9-Tyr at 21% 16O2 for 24 hours at LD and HD (n=3 for each group). “n” represents the number of biologically independent experiments for each group and condition. Graphs represent mean ± s.e.m. were compared using two-tailed Student t-test (g), one- (d-f, h-i) or two- (b-c) way ANOVA, followed by Tukey post-hoc test (*p<0.05, ^p<0.01, %p<0.005, #p<0.0001).
Extended Data Figure 9.

CoQ10 synthesis is important for growth in 3D, but not 2D, conditions. a, Schematic of pulse-chase study using tyrosine-derived intermediates shown in c. Cells were labelled with 13C9-Tyr for two weeks before being grown in 12C9-Tyr or 13C9-Tyr with or without unlabelled 4-HPPA, 4-HPLA, 4-HMA, and 4-HB for 24 hours at 21% O2. b, Growth curve of MIAPACA2 cells with the indicated intermediates and times at 21% O2. (n=3 technical replicates for each cell line, performed at least twice). c, Total levels and fractional labelling of unlabelled and 13C-labelled metabolites in the CoQ10 headgroup biosynthesis pathway in humans, as described in a (n=4). Endogenous 4-HB is below the limit of detection. d, Schematic of known and potential enzymes and intermediates in the CoQ10 headgroup biosynthesis pathway in humans and yeast. Dotted lines reflect potential pathways and enzymes. e, Immunoblot of the indicated MIAPACA2 cells. ERK2 is the loading control. Experiment was performed twice to check for knockout efficiency. f, Growth in 2D culture of MIAPACA2 cells (n=4). g-h, Total levels (g) and fractional labelling (h) of CoQ10 in MIAPACA2 cells. Cells were grown in 13C9-Tyr at 21% 16O2 for 24 hours (n=5). i, Growth in 3D culture of MIAPACA2 cells (n=4) after three days. j, Representative confocal fluorescent images of the indicated MIAPACA2 cells. Images are representative of three independent experiments. k, Fractional labelling of intracellular and mitochondrial CoQ10 from 13C9-Tyr in the indicated MIAPACA2 cells (n=4). l, Immunoblot of total, cytosolic, and mitochondrial fractions from k. Subcellular fractionation was performed twice to determine localization of HPDL. “n” represents the number of biologically independent experiments for each group and condition, unless indicated (b). Graphs (mean ± s.e.m.) were compared by two-way ANOVA (b-c,f-I,k), followed by Tukey (b-c,f-h,k) or Dunnett’s (i) post-hoc test (*p<0.05, ^p<0.01, %p<0.005, #p<0.0001).
Extended Data Figure 10.

HPDL is important for a subset of PDAC tumours. a, Orthotopic pancreatic tumour weight from the indicated MIAPACA2 cells. b-c, Tumour images (b) and weights (c) from second experiment set of orthotopic pancreatic tumour xenografts from MIAPACA2 cells expressing control or HPDL sgRNA with coHPDL WT or catalytically inactive mutant after 6 weeks post-injection. First experiment set can be found on a. d-g, Tumour images (d, f) and weight (e, g) of orthotopic (d-e) or subcutaneous (f-g) pancreatic tumour xenograft of PATU-8902 cells expressing control or HPDL sgRNA after 5 weeks post-injection. h-i, Representative (h) and quantification (i) of H&E and immunohistochemistry for cleaved caspase 3 (CC3), phospho-histone H3 (p-HH3), and the death to proliferation ratio (CC3:p-HH3) from MIAPACA2 tumours from a. j, Overall and progression-free survival of HPDL high (n=44) and low (n=96) expressing PDAC tumours from the TCGA dataset. “n,” and each point represents the number of biologically independent experiments for each group and condition. Survival curve (j) was compared using the two-sided Log-rank (Mantel-Cox) test. Graphs (median ± max/min (a, c, e, g, i)) were compared by two-tailed Mann Whitney test (e, g), one-way ANOVA (a, c, i), followed by Holm-Sidak post-hoc test (*p<0.05, ^p<0.01, %p<0.005, #p<0.0001).
Extended Data Figure 11.
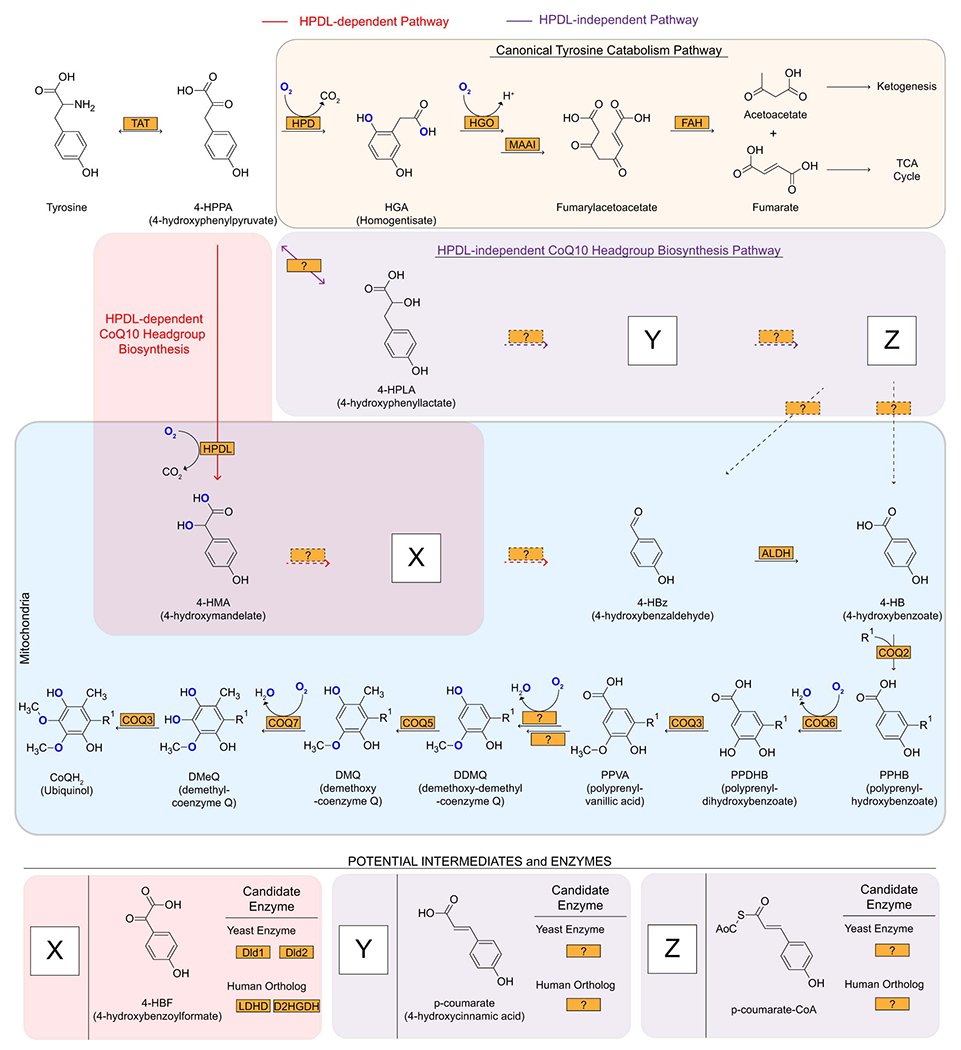
HPDL-dependent CoQ10 biosynthesis pathway. The canonical tyrosine catabolism, HPDL-dependent (red), and HPDL-independent (purple) CoQ10 biosynthetic pathways are shown as indicated. The HPDL-independent pathway was proposed from earlier studies in rats34. Dotted lines represent unknown pathway or transport steps. Potential intermediates and enzymes are proposed within the 4-HMA, HPDL-dependent and-independent pathways.
Extended Data Figure 12.

Applications of gaseous labelling. Our system for gaseous labelling can label cells with a wide range of isotopically labelled gases to study their incorporation into metabolites, lipids, nucleotides, proteins, and any other components of cells to understand the mechanisms of the biological effects of these gases.
Supplementary Material
Acknowledgements
We are grateful to David M. Sabatini for advice and for critical reading of the manuscript, to Richard L. Possemato and lab for use of an incubator with physiologic oxygen (3% O2), and to Benjamin G. Neel for support at the inception of this project. We would like to thank members of the Kimmelman and Pacold labs for their help and suggestions. We acknowledge the NYU Langone Health Experimental Pathology Research Laboratory, Microscopy Laboratory, and Metabolomics Core Resource Laboratory for their help in acquiring the data presented. These shared resources are partially supported by the Cancer Center Support Grant P30CA016087 at the Laura and Isaac Perlmutter Cancer Center. R.S.B. is a Merck Fellow of the Damon Runyon Cancer Research Foundation (DRG-2348-18). Q.S. was supported by the Wallonie-Bruxelles International (WBI) fellowship. D.E.B. is supported by a Ruth L. Kirschstein Institutional National Research Service Award, T32 CA009161 (Levy), and the NCI F99/K00 award (F99 CA245822). K.Y. was supported by an Uehara Memorial Foundation Research Fellowship. A.C.K. is supported by National Cancer Institute Grants R01CA157490, R01CA188048, P01CA117969, R35CA232124; ACS Research Scholar Grant RSG-13-298-01-TBG; NIH grant R01GM095567; the Lustgarten Foundation, and Stand Up to Cancer (SU2C), a division of the Entertainment Industry Foundation. SU2C is administered by the AACR. M.E.P. is a Damon Runyon-Rachleff Innovation Awardee supported in part by the Damon Runyon Cancer Research Foundation (DRR 63-20), and is supported by a Mary Kay Foundation Cancer Research Grant (017-32), the Shifrin-Myers Breast Cancer Discovery Fund at NYU, a V Foundation V Scholar Grant funded by the Hearst Foundation (V2017-004), an NCI K22 Career Transition Award (K22CA212059), the Tara Miller Melanoma Foundation – MRA Young Investigator Award (668365), the Harry J. Lloyd Trust, and laboratory-directed research funding from Max Raskin.
Footnotes
Competing Interests Statement
A.C.K. has financial interests in Vescor Therapeutics, LLC. A.C.K. is an inventor on patents pertaining to KRAS regulated metabolic pathways, redox control pathways in pancreatic cancer, targeting GOT1 as a therapeutic approach, and the autophagic control of iron metabolism. A.C.K is on the SAB of Rafael/Cornerstone Pharmaceuticals. A.C.K has been a consultant for Diciphera Pharmaceuticals. M.E.P. has options in Raze Therapeutics, is the recipient of travel funds from Thermo Fisher Scientific and consulted for aMoon Ventures. R.S.B., Q.S., and M.E.P. are co-inventors on a patent filing on aspects of CoQ10 metabolism. The other authors declare no competing interests.
Data availability
Data in the manuscript are provided in the Source Data and Supplementary Table. TLCV2-sgHPDL and coHPDL expression plasmids are available from Addgene (IDs 174128, 174129, 174130, 174131, 174165, 174166). All other data supporting the findings of this study are available from the corresponding author Michael E. Pacold (Michael.Pacold@nyulangone.org) upon reasonable request.
References
- 1.Morgan NV et al. Evidence that autosomal recessive spastic cerebral palsy-1 (CPSQ1) is caused by a missense variant in HPDL. Brain Commun 3, fcab002, doi: 10.1093/braincomms/fcab002 (2021). [DOI] [PMC free article] [PubMed] [Google Scholar]
- 2.Husain RA et al. Bi-allelic HPDL Variants Cause a Neurodegenerative Disease Ranging from Neonatal Encephalopathy to Adolescent-Onset Spastic Paraplegia. Am J Hum Genet 107, 364–373, doi: 10.1016/j.ajhg.2020.06.015 (2020). [DOI] [PMC free article] [PubMed] [Google Scholar]
- 3.Ghosh SG et al. Biallelic variants in HPDL, encoding 4-hydroxyphenylpyruvate dioxygenase-like protein, lead to an infantile neurodegenerative condition. Genet Med 23, 524–533, doi: 10.1038/s41436-020-01010-y (2021). [DOI] [PubMed] [Google Scholar]
- 4.Wiessner M et al. Biallelic variants in HPDL cause pure and complicated hereditary spastic paraplegia. Brain 144, 1422–1434, doi: 10.1093/brain/awab041 (2021). [DOI] [PMC free article] [PubMed] [Google Scholar]
- 5.Ye X et al. 4-Hydroxyphenylpyruvate Dioxygenase-Like Protein Promotes Pancreatic Cancer Cell Progression and Is Associated With Glutamine-Mediated Redox Balance. Frontiers in Oncology 10, doi: 10.3389/fonc.2020.617190 (2021). [DOI] [PMC free article] [PubMed] [Google Scholar]
- 6.Tang D, Kang R, Berghe TV, Vandenabeele P & Kroemer G The molecular machinery of regulated cell death. Cell Res 29, 347–364, doi: 10.1038/s41422-019-0164-5 (2019). [DOI] [PMC free article] [PubMed] [Google Scholar]
- 7.Hirsila M, Koivunen P, Gunzler V, Kivirikko KI & Myllyharju J Characterization of the human prolyl 4-hydroxylases that modify the hypoxia-inducible factor. J Biol Chem 278, 30772–30780, doi: 10.1074/jbc.M304982200 (2003). [DOI] [PubMed] [Google Scholar]
- 8.Masson N et al. Conserved N-terminal cysteine dioxygenases transduce responses to hypoxia in animals and plants. Science 365, 65–69, doi: 10.1126/science.aaw0112 (2019). [DOI] [PMC free article] [PubMed] [Google Scholar]
- 9.Laukka T et al. Fumarate and Succinate Regulate Expression of Hypoxia-inducible Genes via TET Enzymes. J Biol Chem 291, 4256–4265, doi: 10.1074/jbc.M115.688762 (2016). [DOI] [PMC free article] [PubMed] [Google Scholar]
- 10.Moran GR 4-Hydroxyphenylpyruvate dioxygenase. Arch Biochem Biophys 433, 117–128, doi: 10.1016/j.abb.2004.08.015 (2005). [DOI] [PubMed] [Google Scholar]
- 11.Ast T & Mootha VK Oxygen and mammalian cell culture: are we repeating the experiment of Dr. Ox? Nature Metabolism 1, 858–860, doi: 10.1038/s42255-019-0105-0 (2019). [DOI] [PubMed] [Google Scholar]
- 12.Deshpande AR, Wagenpfeil K, Pochapsky TC, Petsko GA & Ringe D Metal-Dependent Function of a Mammalian Acireductone Dioxygenase. Biochemistry 55, 1398–1407, doi: 10.1021/acs.biochem.5b01319 (2016). [DOI] [PMC free article] [PubMed] [Google Scholar]
- 13.Drazic A & Winter J The physiological role of reversible methionine oxidation. Biochim Biophys Acta 1844, 1367–1382, doi: 10.1016/j.bbapap.2014.01.001 (2014). [DOI] [PubMed] [Google Scholar]
- 14.Choroba OW, Williams DH & Spencer JB Biosynthesis of the Vancomycin Group of Antibiotics: Involvement of an Unusual Dioxygenase in the Pathway to (S)-4-Hydroxyphenylglycine. Journal of the American Chemical Society 122, 5389–5390, doi: 10.1021/ja000076v (2000). [DOI] [Google Scholar]
- 15.Hubbard BK, Thomas MG & Walsh CT Biosynthesis of L-p-hydroxyphenylglycine, a non-proteinogenic amino acid constituent of peptide antibiotics. Chemistry & Biology 7, 931–942 (2000). [DOI] [PubMed] [Google Scholar]
- 16.Lemberger L, Klutch A & Kuntzman R THE METABOLISM OF TYRAMINE IN RABBITS. Journal of Pharmacology and Experimental Therapeutics 153, 183 (1966). [PubMed] [Google Scholar]
- 17.Lichter-Konecki U, Hipke CM & Konecki DS Human phenylalanine hydroxylase gene expression in kidney and other nonhepatic tissues. Mol Genet Metab 67, 308–316, doi: 10.1006/mgme.1999.2880 (1999). [DOI] [PubMed] [Google Scholar]
- 18.Gunsior M, Ravel J, Challis GL & Townsend CA Engineering p-Hydroxyphenylpyruvate Dioxygenase to a p-Hydroxymandelate Synthase and Evidence for the Proposed Benzene Oxide Intermediate in Homogentisate Formation. Biochemistry 43, 663–674, doi: 10.1021/bi035762w (2004). [DOI] [PubMed] [Google Scholar]
- 19.O’Hare HM, Huang F, Holding A, Choroba OW & Spencer JB Conversion of hydroxyphenylpyruvate dioxygenases into hydroxymandelate synthases by directed evolution. FEBS Letters 580, 3445–3450, doi: 10.1016/j.febslet.2006.05.018 (2006). [DOI] [PubMed] [Google Scholar]
- 20.Gunsior M et al. The Biosynthetic Gene Cluster for a Monocyclic β-Lactam Antibiotic, Nocardicin A. Chemistry & Biology 11, 927–938, doi: 10.1016/j.chembiol.2004.04.012 (2004). [DOI] [PubMed] [Google Scholar]
- 21.Bhat SG & Vaidyanathan CS Involvement of 4-hydroxymandelic acid in the degradation of mandelic acid by Pseudomonas convexa. J Bacteriol 127, 1108–1118 (1976). [DOI] [PMC free article] [PubMed] [Google Scholar]
- 22.Stefely JA & Pagliarini DJ Biochemistry of Mitochondrial Coenzyme Q Biosynthesis. Trends Biochem Sci 42, 824–843, doi: 10.1016/j.tibs.2017.06.008 (2017). [DOI] [PMC free article] [PubMed] [Google Scholar]
- 23.Lu T-T, Lee SJ, Apfel U-P & Lippard SJ Aging-Associated Enzyme Human Clock-1: Substrate-Mediated Reduction of the Diiron Center for 5-Demethoxyubiquinone Hydroxylation. Biochemistry 52, 2236–2244, doi: 10.1021/bi301674p (2013). [DOI] [PMC free article] [PubMed] [Google Scholar]
- 24.Wang Y et al. The anti-neurodegeneration drug clioquinol inhibits the aging-associated protein CLK-1. J Biol Chem 284, 314–323, doi: 10.1074/jbc.M807579200 (2009). [DOI] [PubMed] [Google Scholar]
- 25.Payet L-A et al. Mechanistic Details of Early Steps in Coenzyme Q Biosynthesis Pathway in Yeast. Cell Chemical Biology 23, 1241–1250, doi: 10.1016/j.chembiol.2016.08.008 (2016). [DOI] [PubMed] [Google Scholar]
- 26.Stefely JA et al. Mitochondrial protein functions elucidated by multi-omic mass spectrometry profiling. Nature Biotechnology 34, 1191–1197, doi: 10.1038/nbt.3683 (2016). [DOI] [PMC free article] [PubMed] [Google Scholar]
- 27.Valera MJ et al. The Mandelate Pathway, an Alternative to the Phenylalanine Ammonia Lyase Pathway for the Synthesis of Benzenoids in Ascomycete Yeasts. Appl Environ Microbiol 86, doi: 10.1128/AEM.00701-20 (2020). [DOI] [PMC free article] [PubMed] [Google Scholar]
- 28.Kaymak I et al. Mevalonate Pathway Provides Ubiquinone to Maintain Pyrimidine Synthesis and Survival in p53-Deficient Cancer Cells Exposed to Metabolic Stress. Cancer Res 80, 189–203, doi: 10.1158/0008-5472.CAN-19-0650 (2020). [DOI] [PubMed] [Google Scholar]
- 29.Kapalczynska M et al. 2D and 3D cell cultures - a comparison of different types of cancer cell cultures. Arch Med Sci 14, 910–919, doi: 10.5114/aoms.2016.63743 (2018). [DOI] [PMC free article] [PubMed] [Google Scholar]
- 30.Doimo M et al. Genetics of coenzyme q10 deficiency. Mol Syndromol 5, 156–162, doi: 10.1159/000362826 (2014). [DOI] [PMC free article] [PubMed] [Google Scholar]
- 31.Martínez-Reyes I et al. Mitochondrial ubiquinol oxidation is necessary for tumour growth. Nature 585, 288–292, doi: 10.1038/s41586-020-2475-6 (2020). [DOI] [PMC free article] [PubMed] [Google Scholar]
- 32.Xie LX et al. Resveratrol and para-coumarate serve as ring precursors for coenzyme Q biosynthesis. Journal of Lipid Research 56, 909–919, doi: 10.1194/jlr.M057919 (2015). [DOI] [PMC free article] [PubMed] [Google Scholar]
- 33.Fernández-del-Río L et al. Kaempferol increases levels of coenzyme Q in kidney cells and serves as a biosynthetic ring precursor. Free Radical Biology and Medicine 110, 176–187, doi: 10.1016/j.freeradbiomed.2017.06.006 (2017). [DOI] [PMC free article] [PubMed] [Google Scholar]
- 34.Booth AN et al. Urinary Phenolic Acid Metabolites of Tyrosine. Journal of Biological Chemistry 235, 2649–2652 (1960). [Google Scholar]
- 35.Hartl J, Kiefer P, Meyer F & Vorholt JA Longevity of major coenzymes allows minimal de novo synthesis in microorganisms. Nat Microbiol 2, 17073, doi: 10.1038/nmicrobiol.2017.73 (2017). [DOI] [PMC free article] [PubMed] [Google Scholar]
- 36.Meyers RM et al. Computational correction of copy number effect improves specificity of CRISPR-Cas9 essentiality screens in cancer cells. Nat Genet 49, 1779–1784, doi: 10.1038/ng.3984 (2017). [DOI] [PMC free article] [PubMed] [Google Scholar]
- 37.Uphoff CC & Drexler HG Detecting mycoplasma contamination in cell cultures by polymerase chain reaction. Methods Mol Biol 731, 93–103, doi: 10.1007/978-1-61779-080-5_8 (2011). [DOI] [PubMed] [Google Scholar]
- 38.Parker SJ et al. LKB1 promotes metabolic flexibility in response to energy stress. Metab Eng 43, 208–217, doi: 10.1016/j.ymben.2016.12.010 (2017). [DOI] [PMC free article] [PubMed] [Google Scholar]
- 39.Wenig P & Odermatt J OpenChrom: a cross-platform open source software for the mass spectrometric analysis of chromatographic data. BMC Bioinformatics 11, 405, doi: 10.1186/1471-2105-11-405 (2010). [DOI] [PMC free article] [PubMed] [Google Scholar]
- 40.Fernandez CA, Des Rosiers C, Previs SF, David F & Brunengraber H Correction of 13C mass isotopomer distributions for natural stable isotope abundance. J Mass Spectrom 31, 255–262, doi: (1996). [DOI] [PubMed] [Google Scholar]
- 41.Gao J et al. Integrative analysis of complex cancer genomics and clinical profiles using the cBioPortal. Sci Signal 6, pl1, doi: 10.1126/scisignal.2004088 (2013). [DOI] [PMC free article] [PubMed] [Google Scholar]
- 42.Cerami E et al. The cBio cancer genomics portal: an open platform for exploring multidimensional cancer genomics data. Cancer Discov 2, 401–404, doi: 10.1158/2159-8290.CD-12-0095 (2012). [DOI] [PMC free article] [PubMed] [Google Scholar]
Associated Data
This section collects any data citations, data availability statements, or supplementary materials included in this article.
Supplementary Materials
Data Availability Statement
Data in the manuscript are provided in the Source Data and Supplementary Table. TLCV2-sgHPDL and coHPDL expression plasmids are available from Addgene (IDs 174128, 174129, 174130, 174131, 174165, 174166). All other data supporting the findings of this study are available from the corresponding author Michael E. Pacold (Michael.Pacold@nyulangone.org) upon reasonable request.