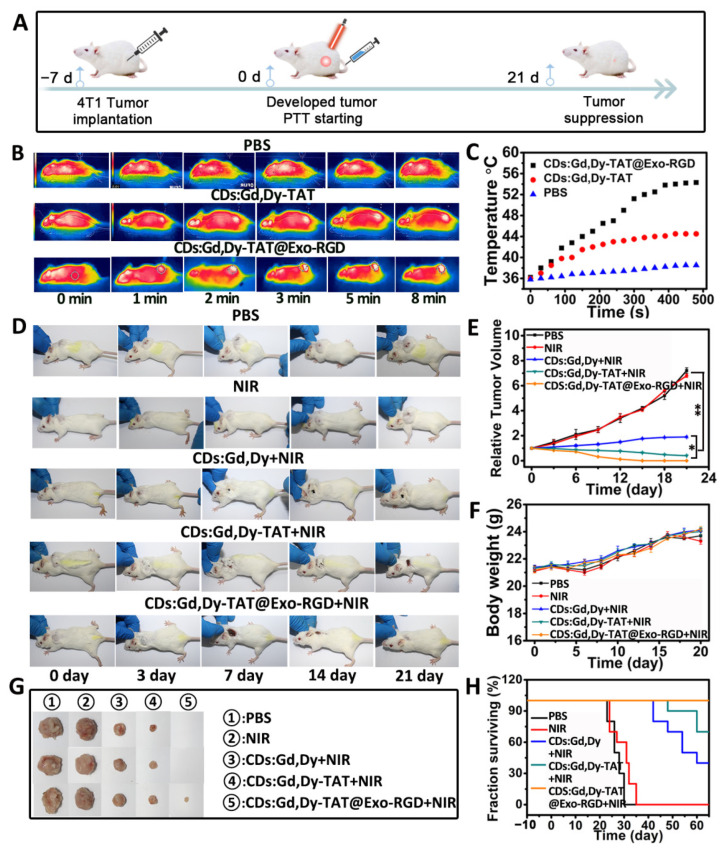
Figure 6.
In vivo tumor PTT effect of CDs:Gd,Dy-TAT@Exo-RGD. (A) The schematic illustration of photothermal therapy in vivo. Thermal infrared images (B) and the temperature change (C) of tumor in tumor-bearing mice injected with PBS, CDs:Gd,Dy-TAT or CDs:Gd,Dy-TAT@Exo-RGD followed by NIR laser irradiation (1.6 W·cm−2, 8 min). Representative mice photographs (D), relative tumor volumes (E) and body weights (F) of the mice from the PBS, NIR, CDs:Gd,Dy+NIR, CDs:Gd,Dy-TAT+NIR and CDs:Gd,Dy-TAT@Exo-RGD+NIR groups. (G) Photographs of tumors collected from different groups at the end of the treatment. (H) Survival rate of the mice after different treatments (* p < 0.05, ** p < 0.01).

