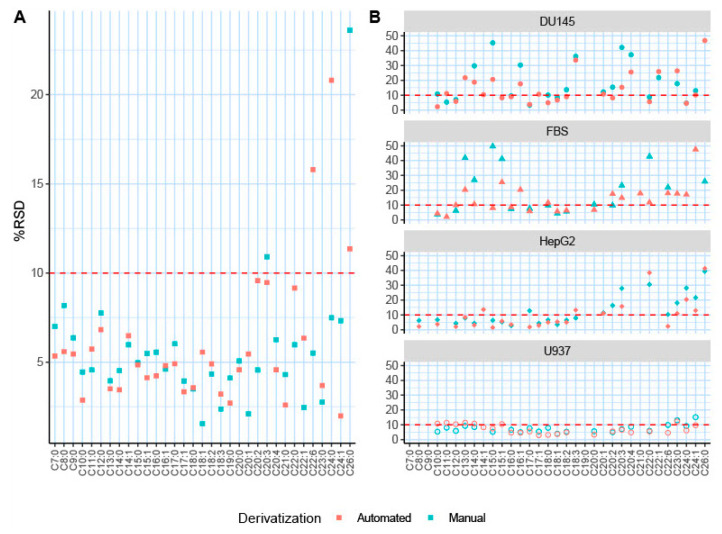
Figure 4.
The %RSD comparison for fatty acid derivatization methods. Plot comparison of all %RSD values for each derivatization technique and each biological matrix. The red line across the plot at 15 represents a commonly accepted cutoff for highly reproducible metabolomics data. (A) The %RSD values for the 33 fatty acid standards utilized to validate the method. (B) The reproducibility of each fatty acid in the following biological matrices: human prostate cancer cell line DU145; fetal bovine serum (FBS); human liver cancer cell line HepG2; and U937, a human myeloid leukemia cell line.

