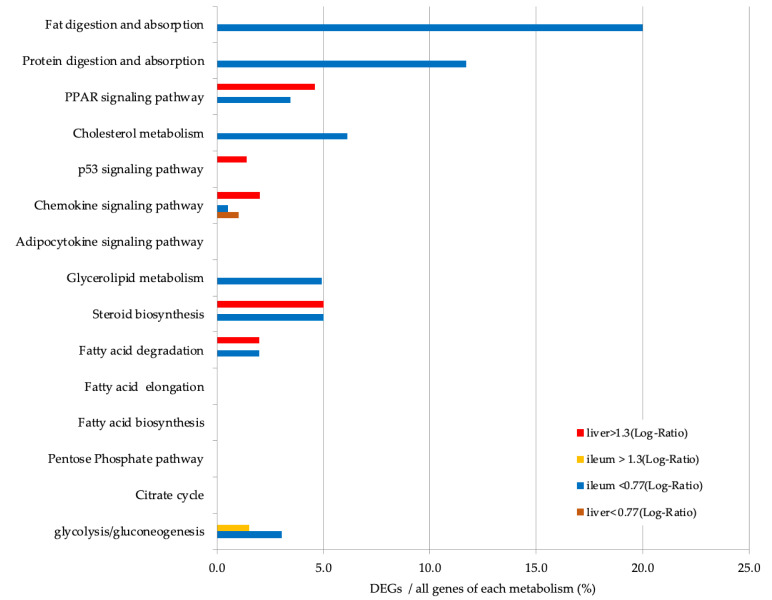
Figure 6.
Percentage of upregulated (>1.3-fold difference to the control) and downregulated (<0.77-fold difference to the control group) differentially expressed genes (DEGs) in the liver and ileum. The y-axis shows the lipid metabolic pathway described in the Kyoto Encyclopedia of Gene and Genome (KEGG). The x-axis shows the percentage of DEGs per total genes involved in each pathway.

