Abstract
Alzheimer’s disease (AD) is the most frequent cause of neurodegenerative dementia and affects nearly 50 million people worldwide. Early stage diagnosis of AD is challenging, and there is presently no effective treatment for AD. The specific genetic alterations and pathological mechanisms of the development and progression of dementia remain poorly understood. Therefore, identifying essential genes and molecular pathways that are associated with this disease’s pathogenesis will help uncover potential treatments. In an attempt to achieve a more comprehensive understanding of the molecular pathogenesis of AD, we integrated the differentially expressed genes (DEGs) from six microarray datasets of AD patients and controls. We identified ATPase H+ transporting V1 subunit A (ATP6V1A), BCL2 interacting protein 3 (BNIP3), calmodulin-dependent protein kinase IV (CAMK4), TOR signaling pathway regulator-like (TIPRL), and the translocase of outer mitochondrial membrane 70 (TOMM70) as upregulated DEGs common to the five datasets. Our analyses revealed that these genes exhibited brain-specific gene co-expression clustering with OPA1, ITFG1, OXCT1, ATP2A2, MAPK1, CDK14, MAP2K4, YWHAB, PARK2, CMAS, HSPA12A, and RGS17. Taking the mean relative expression levels of this geneset in different brain regions into account, we found that the frontal cortex (BA9) exhibited significantly (p < 0.05) higher expression levels of these DEGs, while the hippocampus exhibited the lowest levels. These DEGs are associated with mitochondrial dysfunction, inflammation processes, and various pathways involved in the pathogenesis of AD. Finally, our blood–brain barrier (BBB) predictions using the support vector machine (SVM) and LiCABEDS algorithm and molecular docking analysis suggested that antrocin is permeable to the BBB and exhibits robust ligand–receptor interactions with high binding affinities to CAMK4, TOMM70, and T1PRL. Our results also revealed good predictions for ADMET properties, drug-likeness, adherence to Lipinskís rules, and no alerts for pan-assay interference compounds (PAINS) Conclusions: These results suggest a new molecular signature for AD parthenogenesis and antrocin as a potential therapeutic agent. Further investigation is warranted.
Keywords: Alzheimer’s disease, biomarker identification, in silico pharmacological analyses, antrocin, therapeutic innovation
1. Introduction
Alzheimer’s disease (AD), which is characterized by functional impairment, progressive cognitive dysfunction, and memory loss, is the most frequent cause of neurodegenerative dementia in aging populations, affecting nearly 50 million people worldwide [1]. Worldwide prevalence rates range from 1.0% at 60 years of age to 30–50% by 85 years of age [2,3]. The etiology of AD is multifactorial and involves complex interactions between genetic, lifestyle, and environmental factors; however, about 70% of the risk is believed to be genetic [4].
The pathology of AD is irreversible, and early stage diagnosis is paramount to halting the progression of the disease and avoiding deterioration [5,6]. Major clinical manifestations of AD and other dementias are mild cognitive impairment (MCI) and subjective cognitive decline (SCD). However, the early detection of AD, SCD, MCI, and other dementias is still challenging [7,8]. The current diagnostic tools have several limitations and are unable to detect the disease in its early stages [9].
In addition, there is currently no effective treatment for AD, and presently available drugs do not modify the disease because they are unable to halt its progression [10]. The specific genetic alterations and pathological mechanisms of the development and progression of dementia remain poorly understood [11], and research in identifying more-important genes and molecular pathways associated with AD pathogenesis will help uncover potential treatments.
Gene expression microarrays are widely used to comprehensively measure the genome-wide expression profiles of clinical samples, aiding in the identification of disease-related genes [12]. Previous studies have investigated gene expression changes in the brain tissues of patients with AD and other neurodegenerative dementias [13,14,15,16,17,18]. The public availability of the results from those studies offers the possibility of analyzing the transcriptomic data to identify potential drug targets and to develop appropriate therapeutic strategies.
Natural products, particularly medicinal plants, represent the sources of the lead compounds for therapeutic development [19,20]. They are perceived as safer and offer fewer chances of drug resistance than most conventional therapies, which are limited by their undesirable side effects and drug resistance. Antrodia cinnamomea (AC) is a unique fungal species that is found exclusively in Taiwan and is traditionally used by indigenous herbalists to treat various diseases [21]. Among the many phytochemicals identified in AC, antrocin is a sesquiterpene lactone with established anti-neoplastic and immune-modulating functions [22]. Our previous data indicated that antrocin suppresses several biological signaling pathways, including the focal adhesion kinase (FAK)/paxillin phosphatidylinositol 3-kinase (PI3K)/Akt/mitogen-activated protein kinase (MAPK), extracellular signal-regulated kinase (ERK)/c-Fos/matrix metalloproteinase (MMP)-2, Akt/mammalian target of rapamycin (mTOR)/glycogen synthase kinase (GSK)-3β/nuclear factor (NF)-κB, Janus kinase (JAK)/signal transduction and activator of transcription (STAT3), β-catenin/Notch1/Akt, and insulin-like growth factor-1 receptor (IGF-1R) [23,24,25,26,27]. In addition, the activation of apoptotic markers including Fas, DR5, Bax, caspase–3, –8, and –9 were also implicated in the pharmacological activities of antrocin; however, whether antrocin can modulate the gene alterations associated with AD remains unclear.
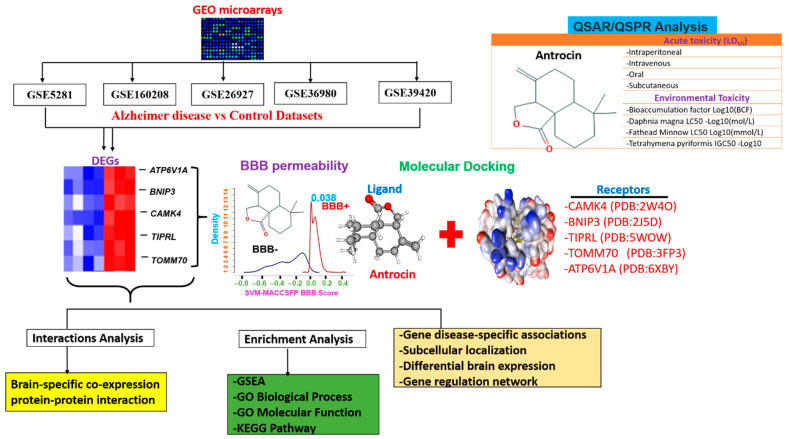
We analyzed five AD microarray datasets and identified ATP6V1A, BNIP3, CAMK4, TIPRL, and TOMM70 as upregulated DEGs that are common in all five datasets (Figure 1). These genes covered a wide range of biological pathways related to brain function and disabilities. Furthermore, our in silico blood–brain barrier (BBB) permeability and molecular docking analysis suggested that antrocin is permeable to the BBB and exhibited robust ligand–receptor interactions with high binding affinities to CAMK4, TOMM70, and T1PRL, suggesting its potential as a new therapeutic agent for AD.
Figure 1.
The flow chart of the study design for in silico identification of potential targets for Alzheimer’s disease and antrocin as a therapeutic candidate.
2. Methods
2.1. Collection of Microarray Data of Early Onset Alzheimer’s Disease (AD)
The microarray AD datasets were collected from the NCBI GEO, a public functional genomics data repository of high-throughput gene expression data (http://www.ncbi.nlm.nih.gov/geo/, accessed on 21 September 2021). The five datasets that we used are described in Table 1. The GSE26927 (GPL6255 (Illumina humanRef-8 v2.0 expression beadchip) dataset (released on Jan. 29, 2011) consists of the microarray data from postmortem central nervous system (CNS) tissues of 63 AD patients and 54 control samples [13]. The GSE160208 (GPL29311, NanoString nCounter Human Myeloid Innate Immunity Panel v2) dataset (released Jan. 8, 2021) consists of gene expression data from the frontal cortex (FC) and cerebellum (CB) of 27 Creutzfeldt–Jakob diseases (CJD) patients and 20 normal controls (CT) [14]. The CJD dataset was included in this analysis because both AD and CJD are conformational disorders that share common clinical, neuropathological, and pathogenetic mechanisms [28,29]. Unlike typical AD, early onset AD exhibits atypical AD phenotypes that present high levels of total tau (T-tau) protein and/or positive 14-3-3 protein (p14-3-3) in the cerebrospinal fluid (CSF), reflecting intense neuronal degeneration similar to what is found in CJD [30]. GSE5281 (GPL570, HG-U133_Plus_2 Affymetrix Human Genome U133 Plus 2.0 Array) contains 161 samples, 74 of which are non-demented controls and 87 are affected with AD [15]. GSE36980 (GPL6244(HuGene-1_0-st) Affymetrix Human Gene 1.0 ST Array (transcript (gene) version) released Apr. 17, 2013) consists of microarray data from the gray matter of the frontal and temporal cortices and hippocampi derived from 80 postmortem brains of 33 AD patients and 47 controls [16]. GSE39420 (GPL11532: (HuGene-1_1-st) Affymetrix Human Gene 1.1 ST Array (transcript (gene) version) released on Jan. 20, 2015) consists of microarray data from 14 AD patients and 7 controls [17]. The controls were cognitively normal healthy cohorts with no history of AD. No ethics committee approval or patient consent was required for the present study.
Table 1.
Characteristics of the subjects and the microarray datasets included in this study.
| Datasets | Platform | No. of Cases | No. of Controls | Total No. | Mean Age (Years) |
|---|---|---|---|---|---|
| GSE5281 | GPL570 | 87 | 74 | 161 | 79.8 0 ± 9.10 |
| GSE160208 | GPL29311 | 27 | 20 | 47 | NA |
| GSE26927 | GPL6255 | 63 | 56 | 119 | 63.65 ± 10.83 |
| GSE36980 | GPL6244 | 33 | 47 | 80 | NA |
| GSE39420 | GPL11532 | 14 | 7 | 21 | 55.66 ± 1.93 |
NA, not available.
2.2. Identification of Differentially Expressed Genes (DEGs)
DEGs were identified using the LIMMA package of R [31]. The Benjamini–Hochberg correction method was used for the p-value adjustment of the false discovery rate (FDR). An FDR of < 0.05 and |log[fold change (FC)]| cut off point were set for DEG selection. The Multiple List Comparator (https://www.molbiotools.com/listcompare.html, accessed on 21 September 2021), a web tool, was used to visualize the intersecting DEGs and to generate a Venn diagram to visualize overlapping DEGs. These overlapping DEGs were used for further bioinformatics analysis to uncover the molecular mechanism of AD.
2.3. Brain-Specific Gene Co-Expression, Protein–Protein Interaction (PPI) Networks, and Gene-Set-Enrichment Analysis (GSEA) of DEGs
We explored the NetworkAnalyst server (https://www.networkanalyst.ca/, accessed on 21 September 2021) [32] to conduct a brain-specific gene co-expression analysis. In accordance with the protocol described in previous studies [33,34], the DEGs were uploaded to the GENELIST module of the server and were analyzed for specific selected parameters: organism (Homo sapiens), ID type (gene symbol), tissue-specific co-expression (brain) analysis minimum-order network analysis. The Kyoto Encyclopedia of Genes and Genomes (KEGG) pathways and gene ontology (GO) enrichment analyses of the DEGs were conducted using the Enrich server [35,36]. The official gene symbols of the DEGs were uploaded into the Enrich server and were analyzed for the KEGG and GO terms under the default enrichment cutoff value of p < 0.05. The search tool for retrieval of interacting genes/proteins (STRING) server (http://string-db.org/, accessed on 21 September 2021, v10.5) [37] was used to construct the PPI network of the DEGs. The Entrez gene symbols of the DEGs were uploaded to the multiple protein modules of the STRING server and were analyzed for known and predicted PPI interactions in Homo sapiens under the high confidence (0.70) search and at a significant level of p < 0.05.
2.4. Analysis of Gene Disease-Specific Associations of the DEGs
We analyzed the disease-specific associations of DEGs by exploring the disease/phenotype-specific filters of the OPENTARGET platform (https://www.targetvalidation.org/, accessed on 21 September 2021) at a search score of 0.15. The OPENTARGET platform is a bio-web algorithm that integrates genetic, omic, and chemical data to identify the involvement of genes in diseases and aids in systematic drug target identification and prioritization [38].
2.5. MicroRNA (miRNA) Regulatory Network Analysis of the DEGs
The miRNA regulatory targets of the DEGs were collected from experimentally verified databases (TarBase, mir2disease, and miRTarBase) and predicted databases (miRanda and targetscan). The miRNA regulatory network was visualized using the visNetwork R packages. In addition, we used the miRNA Enrichment Analysis and Annotation (miEAA) tool (https://ccb-compute2.cs.uni-saarland.de/mieaa2/, accessed on 21 September 2021) to conduct a functional enrichment analysis of the miRNA targets [39]. Analysis was conducted using FDR (Benjamini–Hochberg) a p-value adjustment of 0.05 and a minimum required hit of four miR.
2.6. In Silico Evaluation of the Drug-Likeness, Pharmacokinetics (PKs), Blood–Brain Barrier (BBB) Permeability and Acute Rat Toxicity Study of Antrocin
We analyzed the drug-likeness, pharmacokinetics (PKs), medicinal chemistry, and toxicity of antrocin using SwissADME software (http://www.swissadme.ch, accessed on 21 September 2021) [40] and computer-aided Prediction of Biological Activity Spectra (PASS) web resources (http://way2drug.com/dr, accessed on 21 September 2021) [41]. We used the blood–brain barrier (BBB) prediction server (https://www.cbligand.org/BBB/, accessed on 21 September 2021), which operates based on support vector machine (SVM) and LiCABEDS algorithms on four types of fingerprints from 1593 reported compounds [42] to analyze the BBB-permeation ability of antrocin. The permeation threshold of the server is 0.02. In addition, we also used the brain or intestinal estimated permeation method (BOILED-Egg) model [43] to further analyze the brain- and intestinal-permeation abilities of the compound based on its lipophilicity and polarity. The antrocin SMILES format was also uploaded to the SwissADME server and was analysed for the presence of pan-assay interference compound (PAINS) substructures [44]. The GUSAR software for quantitative structure-activity relationship (QSAR)/quantitative structure-property relationship (QSPR) modelling was used for the in silico prediction of the 50% lethal dose (LD50) values of antrocin for rats through four administration routes (intravenous (i.v.), intraperitoneal (i.p.), oral inhalation, and subcutaneous (s.c.)) [45]. The GUSAR software was developed based on training datasets from the SYMYX MDL Toxicity Database and consisted of approximately 104 chemical structures with data on acute rat toxicity represented by LD50 values (log10 (mmol/kg)).
2.7. Molecular Docking Studies
The three-dimensional (3D) structures of CAMK4 (PDB:2W4O), ATP6V1A (PDB:6XBY), TIPRL (PDB:5WOW), BNIP3 (PDB:2J5D), and TOMM70 (PDB:3FP3) were downloaded from the protein data bank (PDB). The mol2 file for the 3D structure of antrocin was obtained using the Avogadro molecular builder and visualization tool vers. 1.XX [46] before subsequently being transformed into PDB format using the PyMOL Molecular Graphics System, vers. 1.2r3pre. The PDB files of the crystal structures of the targets were transformed to pdbqt format using AutoDock Vina (vers. 0.8, Scripps Research Institute, La Jolla, CA, USA) [47]. Prior to molecular docking, the receptors were charged, hydrogen atoms were added, and water (H2O) molecules were removed [48]. Docking experiments were performed with AutoDock Vina (vers. 0.8) using default settings at a docking exhaustiveness of 8 with all of the bonds in the ligand rotated freely while considering the receptors to be rigid. A grid box of 40 × 40 × 40 Å in the X, Y, and Z dimensions and a spacing of 1.0 Å were used [49]. The docked complex was visualized and analyzed using the Discovery Studio visualizer vers. 19.1.0.18287 (BIOVIA, San Diego, CA, USA) [50] and the protein–ligand interaction profiler (https://plip-tool.biotec.tu-dresden.de/plip-web/plip/index, accessed on 21 September 2021) [51].
3. Results
3.1. Deregulated Expressions of ATP6V1A, BNIP3, CAMK4, TIPRL, and TOMM70 Associated with the Pathology of Neurodegenerative Dementia
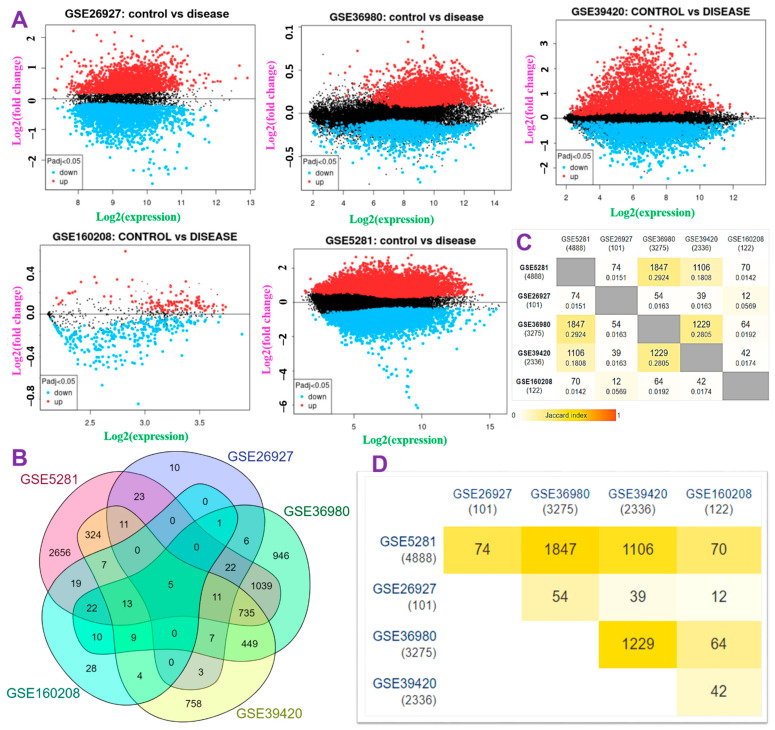
The flow chart of the study design for the in silico identification of the potential targets for Alzheime’sr disease and antrocin as a therapeutic candidate is shown in Figure 1. To retrieve the genes whose expression levels were significantly altered in AD brains compared to non-AD brains, we analyzed the transcriptomic data of multiple cohorts from microarray datasets (Table 1). The DEG distributions for each dataset are shown in a volcano plot (Figure 2A). The overexpressed DEGs were identified from each of the datasets and were based on an adjusted p < 0.05 when comparing the AD patients and the control subjects from each dataset (Figure 2B−D). Furthermore, we integrated the overexpressed DEGs from each dataset to identify overlapping and the most implicated DEGs in AD pathology. Five significantly overexpressed DEGs were identified: ATPase H+ transporting V1 subunit A (ATP6V1A), BCL2 interacting protein 3 (BNIP3), calmodulin-dependent protein kinase IV (CAMK4), TOR signaling pathway regulator-like (TIPRL), and translocase of outer mitochondrial membrane 70 (TOMM70) (Figure 2C).
Figure 2.
Identification of differentially expressed genes (DEGs) among patients with Alzheimer’s disease (AD) and healthy controls. (A) Volcano plot showing distributions of DEGs among AD patients and healthy controls. The top DEGs satisfied the criteria of log(multiple of change (MC) value) and p < 0.05. (B) Venn diagram of the DEGs across the six datasets. (C,D) Heatmap showing the Jaccard index of the DEGs in each of the datasets.
3.2. ATP6V1A, BNIP3, CAMK4, TIPRL, and TOMM70 Localization and Differential Expressions in Brain Regions
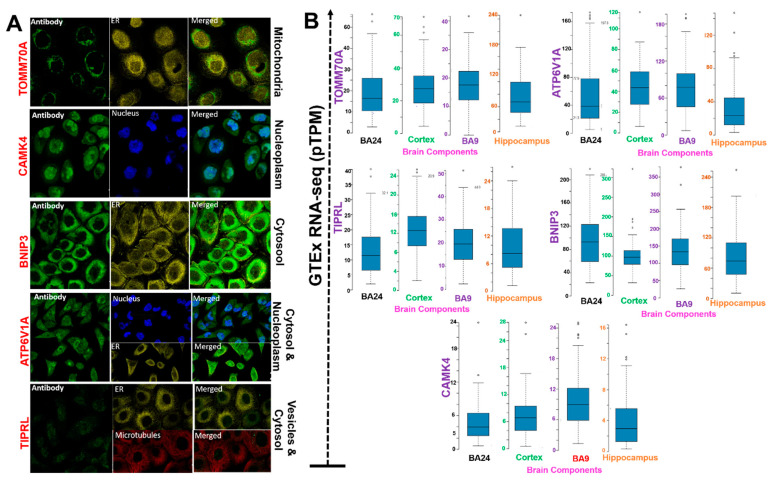
To characterize the intracellular localization of the proteins, we acquired the indirect immunofluorescence data of distributions of the proteins within the nucleus, endoplasmic reticulum (ER), and microtubules of A-431 and A549 cells. We found that that ATP6V1A, BNIP3, CAMK4, TIPRL, and TOMM70 were colocalized with the markers of different subcellular localizations: ATP6V1A (cytosol and nucleoplasm), BNIP3 (cytosol), CAMK4 (nucleoplasm), TIPRL (vesicles and cytosol), and TOMM70 (mitochondria) (Figure 3A). In addition, we examined the expression levels of the DEGs in different regions of the brain. Taking the mean relative expression levels of these genes in different brain regions into account, we found that the frontal cortex (BA9) exhibited significantly (p < 0.05) higher DEG expression levels. In contrast, the hippocampus exhibited the lowest ATP6V1A, BNIP3, CAMK4, TIPRL, and TOMM70 expression levels compared to the other parts of the brain that were analyzed (Figure 3B, Table 2).
Figure 3.
Localization and differential expressions of the ATP6V1A, BNIP3, CAMK4, TIPRL, and TOMM70 (A) immunofluorescence staining of the subcellular distribution of the proteins. Protein localization was detected based on the immunohistochemistry from the Human Protein Atlas (HPA) database. Scale bar = 20 μm (B) Bar plots showing differential expression levels of the genes in different brain regions.
Table 2.
Mean expression data of the ATP6V1A, BNIP3, CAMK4, TIPRL, and TOMM70 genes in different brain regions.
| GTEx RNA-seq (pTPM) | |||||
|---|---|---|---|---|---|
| Brain Region | TIPRL | TOMM70A | CAMK4 | ATPV1A | BNIPS |
| Anterior cingulate cortex (BA24) |
12.90 ± 7.90 b | 19.10 ± 11.70 b | 4.70 ± 3.30 a | 53.40 ± 42.60 b | 98.90 ± 45.70 b |
| Cortex (central) | 12.30 ± 4.50 b | 19.20 ± 7.20 b | 7.50 ± 4.00 b | 43.81 ± 20.00 b | 98.63 ± 33.20 b |
| Frontal cortex (BA9) | 19.90 ± 9.80 c | 27.80 ± 13.10 c | 9.30 ± 5.20 b | 77.60 ± 42.50 b | 136.72 ± 55.03 b |
| Hippocampus | 9.70 ± 5.70 a | 14.00 ± 8.20 a | 4.00 ± 3.30 a | 31.70 ± 27.50 a | 80.43 ± 45.05 a |
Raw data were downloaded from Human Protein Atlas (HPA) repositories. Data were analyzed, and results are presented as the mean ± standard error of the mean. Values with different superscript letters in a column significantly differ (a > b > c) at p < 0.05. BA24; Brodmann area 24, BA9; Brodmann area 9.
3.3. MicroRNA (miR) Regulatory Network and Brain-Specific Gene Interactions of ATP6V1A, BNIP3, CAMK4, TIPRL, and TOMM70
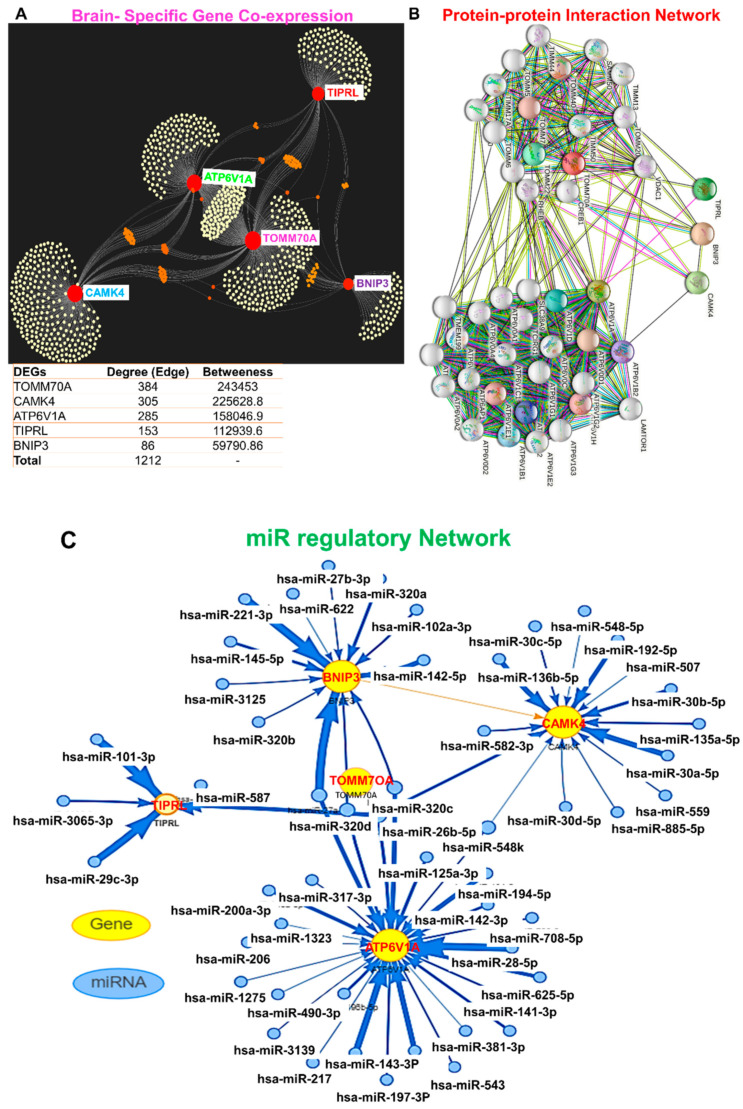
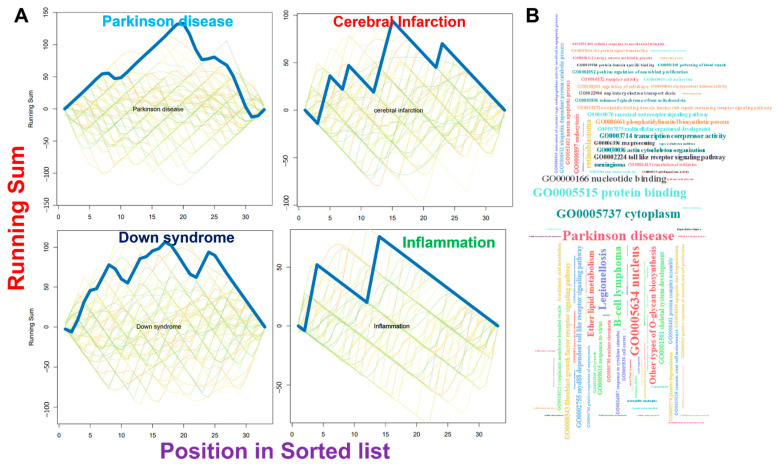
We conducted a tissue-specific gene co-expression analysis and found that each of the DEGs exhibited brain-specific gene co-expression clustering with 986 clustering nodes and 1212 clustering edges (Figure 4A). Specifically, we observed higher clustering co-expression with optic atrophy 1 (OPA1), integrin alpha FG-GAP repeat containing 1 (ITFG1), 3-oxoacid CoA-transferase 1 (OXCT1), ATPase, Ca++ transporting, cardiac muscle, slow twitch 2 (ATP2A2), MAPK1, cyclin dependent kinase 14 (CDK14), MAP2K4, tyrosine 3-monooxygenase/tryptophan 5-monooxygenase activation protein beta (YWHAB), parkin RBR E3 ubiquitin protein ligase (PARK2), cytidine monophosphate N-acetylneuraminic acid synthetase (CMAS), heat shock protein family A member 12A (HSPA12A), and regulator of G protein signaling 17 (RGS17). Furthermore, the PPI interaction network yielded 45 nodes and 435 edges, with an average local clustering coefficient of 0.813 and PPI enrichment p-value of <1.0 × 10⁻¹⁶. The PPI network revealed that TOMM70A and ATP6V1A exhibited very high protein family-specific clustering interactions while BNIP3, CAMK4, and TIPRL formed a very minimal cluster (Figure 4B). We queried the miRNA targets of the DEGs to gain further insight into their pathological role. We found that DEGs are targeted by several miR-regulatory networks (Figure 4C) that are significantly associated with the pathogenesis of several CNS diseases including Parkinson’s disease, Down syndrome, inflammation, cerebral infarction, and several other diseases (Figure 5).
Figure 4.
MicroRNA (miR) regulatory network and brain-specific gene interactions of ATP6V1A, BNIP3, CAMK4, TIPRL, and TOMM70 (A) Network plot of brain-specific gene co-expressions of the gene set, (B) protein–protein interaction (PPI) network, and (C) miR regulatory networks of target genes.
Figure 5.
MicroRNA (miR) regulatory network enrichment of the DEGs. (A) Specific diseases enrichment plot and (B) cloud plot of the total enrichment of the DEGs.
3.4. ATP6V1A/BNIP3 and CAMK4/TIPRL/TOMM70 Are Associated with Mitochondrial Dysfunction, Inflammatory Processes, and Various Pathways Involved in AD Pathogenesis
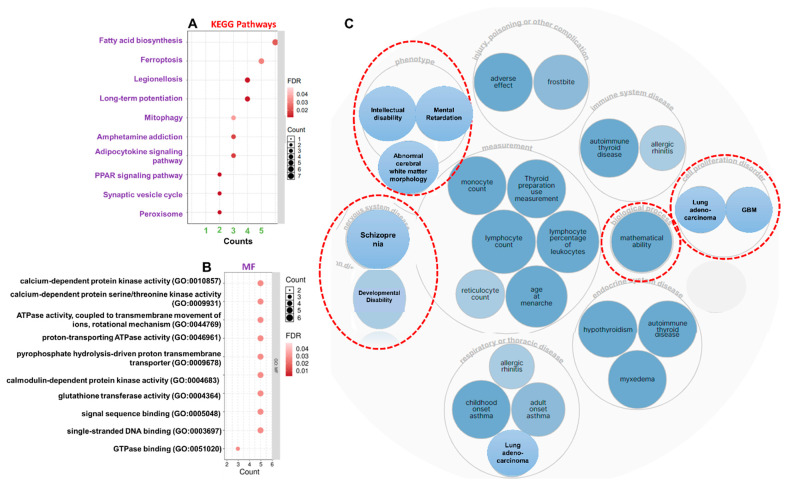
To better understand the most common biological processes and pathways altered by dementia generation and progression, we analyzed disease associations, KEGG pathways, and the ontological enrichment of DEGs. Our results revealed the enrichment of fatty acid biosynthesis, ferroptosis, long-term potentiation, amphetamine addiction, adipocytokine signaling, peroxisome proliferator-activated receptor (PPAR) signaling, synaptic vesicle cycling, and peroxisome as major pathways associated with the DEGs (Figure 6A), while enriched molecular functions in the signatures were mainly associated with ATPase and calcium-dependent protein kinase activities (Figure 6B). In addition, biological processes, including the regulation of myeloid leukocyte differentiation, dendritic cell cytokine production, myeloid dendritic cell differentiation, cellular response to oxygen levels, and the mitochondrial protein catabolic process, were significantly enriched (Table 3). The gene–disease analysis further revealed that the ATP6V1A/BNIP3 and CAMK4/TIPRL/TOMM70 signatures were associated with several brain-related disorders, including developmental disabilities, schizophrenia, intellectual disabilities, abnormal cerebral white matter morphology, and mental retardation (Figure 6C). Collectively, the findings from this study suggest that ATP6V1A/BNIP3 and CAMK4/TIPRL/TOMM70 are associated with mitochondrial dysfunction, inflammatory processes, and various pathways involved in AD pathogenesis.
Figure 6.
ATP6V1A/BNIP3 and CAMK4/TIPRL/TOMM70 are associated with several pathways and processes associated with brain functioning and disabilities. (A) KEGG pathways and (B) molecular function enrichment of ATP6V1A/BNIP3 and CAMK4/TIPRL/TOMM70. (C) Bubble plot showing the gene–disease association network of the gene set. GBM; glioblastoma multiforme.
Table 3.
Biological processes enriched by the target genes.
| Index | Name | p-Value | Adjusted p-Value | Odds Ratio | Combined Score |
|---|---|---|---|---|---|
| 1 | catabolism of mitochondrial proteins (GO:0035694) | 0.003296 | 0.04581 | 399.68 | 2284.21 |
| 2 | response to increased oxygen levels (GO:0036296) | 0.003844 | 0.04581 | 333.05 | 1852.16 |
| 3 | regulation of myeloid leukocyte differentiation (GO:0002761) | 0.004392 | 0.04581 | 285.46 | 1549.44 |
| 4 | negative regulation of mitochondrial fusion (GO:0010637) | 0.004392 | 0.04581 | 285.46 | 1549.44 |
| 5 | positive regulation of dendritic cell cytokine production (GO:0002732) | 0.004392 | 0.04581 | 285.46 | 1549.44 |
| 6 | mitochondrial fragmentation involved in apoptotic process (GO:0043653) | 0.004940 | 0.04581 | 249.76 | 1326.33 |
| 7 | negative regulation of membrane potential (GO:0045837) | 0.004940 | 0.04581 | 249.76 | 1326.33 |
| 8 | positive regulation of mitochondrial membrane permeability involved in apoptotic process (GO:1902110) | 0.004940 | 0.04581 | 249.76 | 1326.33 |
| 9 | cellular response to oxygen levels (GO:0071453) | 0.005488 | 0.04581 | 222.00 | 1155.57 |
| 10 | myeloid dendritic cell differentiation (GO:0043011) | 0.005488 | 0.04581 | 222.00 | 1155.57 |
3.5. In Silico Pharmacokinetics, BBB Permeability and Acute Toxicity of Antrocin
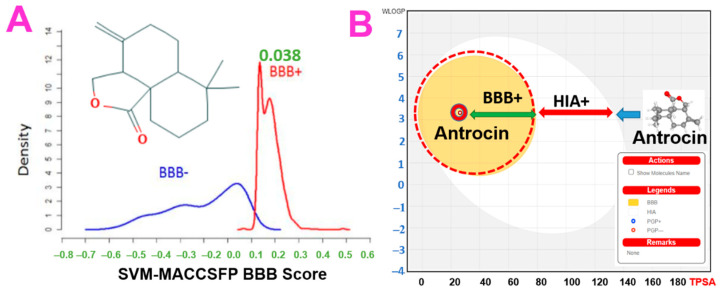
The preclinical evaluation of drug PKs can aid in the drug development process by providing a rationale for the selection of efficacious drug doses and treatment schedules [52]. The BBB is an important factor that limits the effectiveness of most chemotherapies against AD. Herein, we evaluated the BBB permeation ability (Figure 7) of antrocin, and our results revealed a BBB permeability score of 0.038 (Figure 7, Table 4) on a BBB permeant threshold of 0.02, suggesting that antrocin is BBB permeant and thus would be valuable for AD treatment. Our results also revealed good predictions for ADMET properties, drug-likeness, adherence to Lipinskís rules, no PAINS alerts, and that it is a non-inhibitor of CYP1A2, CYP2C19, CYP2D6 and CYP3A4 (Table 5). QSAR modeling of acute toxicity in rats revealed that antrocin had LD50 values of 618, 26, 804.3, 517.3 g/kg body weight for the i.p., i.v., o.p, and s.c. administrative routes, respectively (Table 4), suggesting that the compound has a high safety profile, especially when administered orally. In addition, antrocin demonstrated high environmental safety, as measured by the bioaccumulation factor, Daphnia magna, fathead minnow, and Tetrahymena pyriformis.
Figure 7.
Two-dimensional (2D) structure and blood–brain barrier (BBB) permeation ability of antrocin. The (A) support vector machine (SVM)/LiCABEDS algorithms and (B) BOILED-Egg) model of BBB permeability of antrocin.
Table 4.
In silico acute rodent toxicity assays for antrocin.
| LD50 | |||
| Administration Route | Log10(mmol/kg) | mg/kg | OECD classification |
| Intraperitoneal (i.p) | 0.421 | 618 | Class 5 |
| Intravenous (i.v) | −0.955 | 26 | Class 3 |
| Oral gavage (o.p) | 1.536 | 804.3 | Non-toxic |
| Subcutaneous (s.c) | 0.344 | 517.3 | Class 4 |
| Environmental Toxicity | |||
| Bioaccumulation factor Log10(BCF) | 1.521 | ||
| Daphnia magna LC50-Log10(mol/L) | 4.594 | ||
| Fathead Minnow LC50 Log10(mmol/L) | −1.648 | ||
| Tetrahymena pyriformis IGC50-Log10(mol/L) | 0.856 | ||
The toxicity classification was based on the acute rodent toxicity chemical classification by the OECD Project. LD50, 50% lethal dose.
Table 5.
Drug-like and properties of antrocin.
| Properties | Antrocin | Reference Value |
|---|---|---|
| Formula | C15H22O2 | − |
| M.W(g/mol) | 234.33 | 150−500 |
| R-bonds | 0 | 0−9 |
| H-bond ACC. | 2 | 0−10 |
| H-bond DON. | 0 | 0−5 |
| Molar Refractivity | 68.17 | 40 ~ 130 |
| TPSA (Ų) | 26.30 | 20−130 |
| Fraction Csp3 | 0.80 | 0.25 ~ < 1 |
| Log Po/w (XLOGP3) | 3.44 | −0.7 ~ 5 |
| Consensus Log Po/w | 3.31 | ≤3.5 |
| Drug-likeness (Lipinski rule) | Yes (0 violation) | MLOGP ≤ 4.15, M.W ≤ 500, H-bond ACC ≤ 10, H-bond DON ≤ 5 |
| Bioavailability Score | 0.55 | >0.1 (10%) |
| BBB-permeation (SVM_MACCSFP) | 0.038 | ≥0.02 |
| Synthetic accessibility | 4.18 | 1 (very easy) to 10 (very difficult). |
| PAINS | 0 alert | No alert |
| P-gp substrate | No | |
| CYP1A2 inhibitor | No | |
| CYP2C19 inhibitor | No | |
| CYP2D6 inhibitor | No | |
| CYP3A4 inhibitor | No | |
| Log Kp (skin permeation) | −5.29 cm/s | <−3.5 |
R-bond; Num. rotatable bonds; H-bond ACC; Num. H-bond acceptors, H-bond DON; H-bond donors, TPSA; topological polar surface area, BBB; blood–brain barrier, P-gp; P-glycoprotein. Kp; permeability coefficients (kp).
3.6. Molecular Docking Profiles of Antrocin with ATP6V1A, BNIP3, CAMK4, TIPRL, and TOMM70
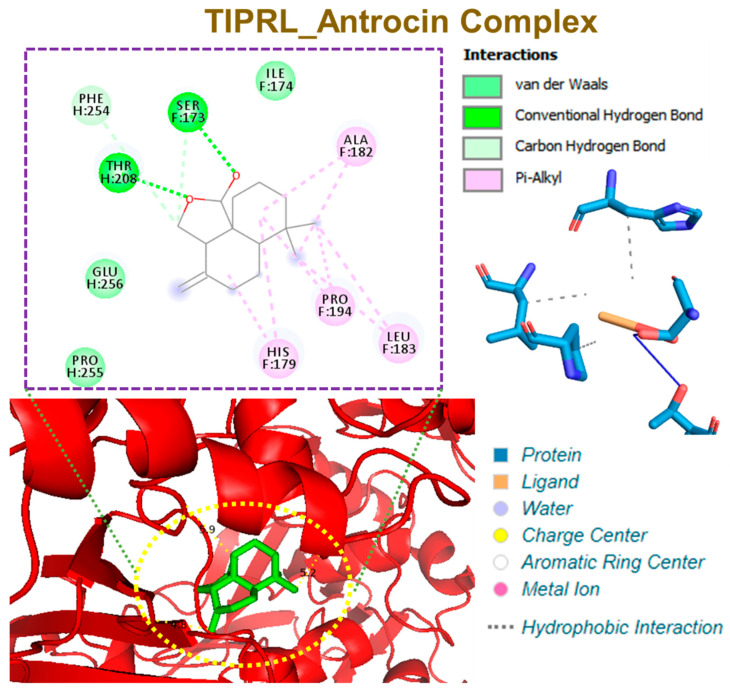
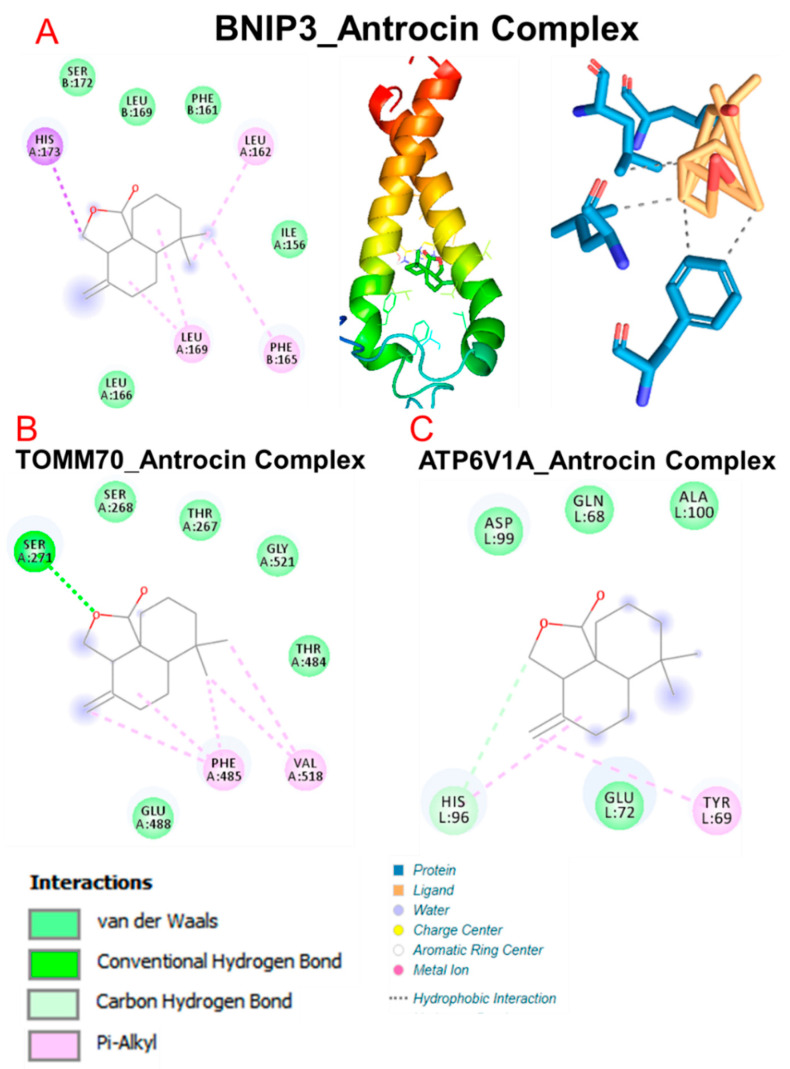
Our molecular docking analysis revealed that antrocin exhibited strong interactions with the crystal structures of CAMK4 (PDB:2W4O), BNIP3 (PDB:2J5D), TIPRL (PDB:5WOW), TOMM70 (PDB:3FP3), and ATP6V1A (PDB:6XBY) and demonstrated the respective binding affinities of −6.70, −5.80, −6.60, −6.80, and −5.90 kcal/mol. Our analysis of interactions between the target gene and antrocin revealed that antrocin interacted with the gene targets through several hydrogen bonds, π-alkyl, van der Waals forces (Table 6), and several hydrophobic contacts (Table 7).
Table 6.
Molecular docking profiles between antrocin and various targets.
| Interaction | CAMK4 | BNIP3 | TIPRL | TOMM70 | ATP6V1A |
|---|---|---|---|---|---|
| ΔG = (kcal/mol) | −6.70 | 5.80 | −6.60 | −6.80 | −5.90 |
| Conventional H-bonds |
THR291 (2.72 Å) HIS156 (1.92 Å) PRO220 (3.65 Å) |
THR208 (2.03 Å) SER173 (2.97 Å) PHE254 (3.78 Å) |
SER271 (2.40 Å) |
HIS96 (2.16 Å) | |
| π-alkyl | PRO220 | LEU169 PHE165 LEU162 |
ALA182 PRO194 LEU183 HIS179 |
PHE485 VAL518 |
TYR69 |
| π-sigma | HIS173 | ||||
| van der Waals forces | MET224 GLU221 THR290 PHE292 ALA153 |
SER172 LEU169 PHE161 ILE156 LEU166 |
PHE254 GLU256 PRO255 |
SER268 THR267 GLY521 THR484 GLU488 |
ASP99 GLN68 ALA100 GLU72 |
Table 7.
Hydrophobic contact between antrocin and various targets.
| Target | Amino Acid Residue |
Ligand Atom | Protein Atom | Distance (Å) |
|---|---|---|---|---|
| BNIP3 | PHE165B | 868 | 628 | 3.69 |
| PHE165B | 863 | 629 | 3.66 | |
| LEU166A | 873 | 207 | 3.59 | |
| LEU169A | 869 | 231 | 3.35 | |
| LEU169A | 872 | 230 | 3.85 | |
| LEU169B | 868 | 661 | 3.40 | |
| TIPRL | HIS179F | 42301 | 19984 | 3.68 |
| LEU183F | 42299 | 20029 | 3.63 | |
| PRO194F | 42295 | 20139 | 3.72 | |
| TOMM70 | THR484A | 5020 | 3672 | 3.69 |
| PHE485A | 5014 | 3684 | 3.62 | |
| PHE485A | 5013 | 3686 | 3.51 | |
| PHE485A | 5020 | 3685 | 3.66 | |
| VAL518A | 5020 | 4029 | 3.53 | |
| ATP6V1A | TYR69L | 17251 | 3978 | 3.69 |
| GLU72L | 17251 | 4001 | 3.58 | |
| HIS96L | 17252 | 4191 | 3.64 | |
| CAMK4 | HIS156A | 2587 | 1013 | 3.90 |
| PRO220A | 2588 | 2588 | 3.70 |
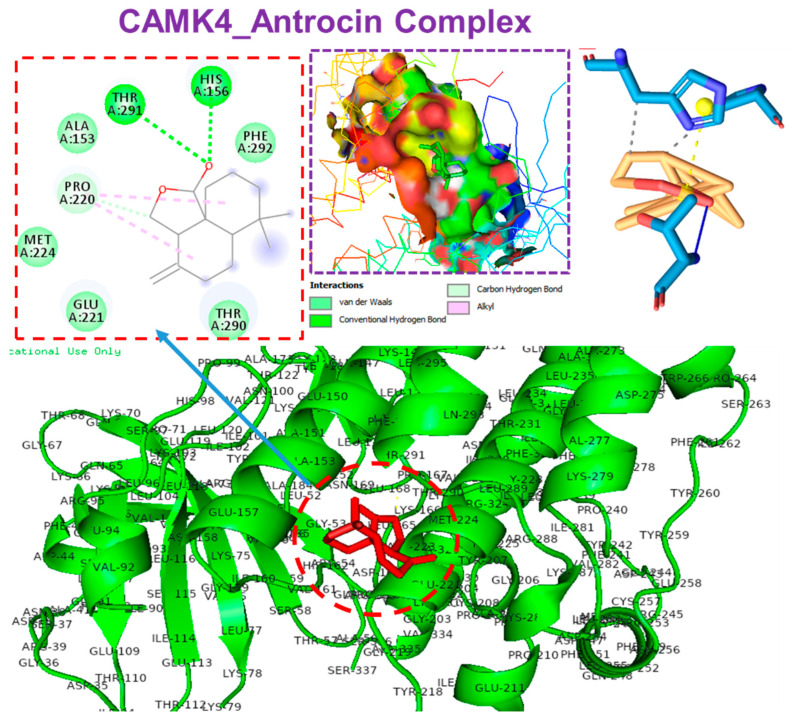
Antrocin bound to CAMK4 with three hydrogen bonds, including THR291, HIS156, and PRO220, with the respective binding distances of 2.72, 1.92, and 3.65 Å. In addition, the antrocin–CAMK4 complex was further stabilized by several van der Waals forces that were formed around the backbone of antrocin with the amino acid residues of MET224, GLU221, THR290, PHE292, and ALA153 in the binding cavity of CAMK4. However, only two hydrophobic contacts (PRO220A and HIS156A) existed between antrocin and the binding cavity of CAMK4 (Figure 8). Antrocin was bound with TIPRL with three hydrogen bonds, including THR208, SER173, and PHE254, with the respective binding distances of 2.03, 2.97, and 3.78 Å, with several π-alkyl, van der Waals forces, and various hydrophobic contacts (Figure 9).
Figure 8.
Molecular docking profile of CAMK4 with antrocin.
Figure 9.
Molecular docking profile of TIPRL with antrocin.
No conventional hydrogen bonds were observed between antrocin and BNIP3, while only a single hydrogen bond was observed between the ligand (antrocin) and the receptors: TOMM70 (SER271, 2.40 Å) and ATP6V1A (HIS96, 2.16 Å). In addition, several van der Waals forces and hydrophobic contacts were also observed between antrocin and the receptors: BNIP3, TOMM70, and ATP6V1A (Figure 10).
Figure 10.
Molecular docking profiles of BNIP3, TOMM70, and ATP6V1A with antrocin. The two dimensional structure of the receptor-ligand complexes formed between antrocin and (A) BN1P3 (B) TOMM70, and (C) ATP6V1A.
4. Discussion
AD, one of the most common types of dementia, afflicts millions of people globally. In addition to its negative effects on physical and mental health, AD places a huge burden on both individuals and societies [53]. Although a number of medications are available for the relief of AD symptoms, no cure for AD presently exists [54]. Therefore, it is evident that identifying DEGs that play pivotal roles in AD pathogenesis is an important step towards the development of appropriate therapeutic strategies. A comparative analysis of the transcriptomic data between AD subjects and healthy controls revealed important molecular pathways and biological processes altered by AD generation and progression.
In terms of upregulated genes, our pathway enrichment results included fatty acid biosynthesis, ferroptosis, long-term potentiation, amphetamine addiction, adipocytokine signaling, PPAR signaling, synaptic vesicle cycle, and peroxisome, all of which are commonly accepted components of the pathogenesis and pathological changes of AD [55,56,57,58,59].
Inflammatory processes play fundamental roles in the pathogenesis of AD [60]. Activated cells strongly produce inflammatory mediators such as proinflammatory cytokines, chemokines, leukotrienes, reactive oxygen species, and other radicals [61,62]. In addition, the enrichment of biological processes, including the regulation of myeloid leukocyte differentiation, dendritic cell cytokine production, myeloid dendritic cell differentiation, cellular responses to oxygen levels, and the catabolism of mitochondrial proteins, indicate important factors, all of which are associated with activation of the inflammatory processes involved in the pathogenesis of AD [61,62].
Furthermore, the enrichment of the regulation of myeloid leukocyte differentiation, the positive regulation of dendritic cell cytokine production, cellular responses to oxygen levels, and the myeloid dendritic cell differentiation in the biological process ontologies of DEGs suggest a mitochondrial dysfunction event, which is an important factor in the pathogenesis of AD and other neurodegenerative disorders such as PD [63]. Collectively, the findings from this study suggest that ATP6V1A/BNIP3/CAMK4/TIPRL/TOMM70 are associated with mitochondrial dysfunction, inflammatory processes, and various pathways involved in AD pathogenesis.
ATP6V1A is a multi-subunit enzyme that is associated with synaptic vesicle proton gradient generation in the brain, energy metabolism, and ATP synthesis. In agreement with a previous study [64], our comprehensive analyses of DEGs, enrichment, and PPI networks strongly suggest that ATP6V1A may play an important role in AD pathogenesis. Moreover, ATP6V1A maturations were implicated in the onset of developmental encephalopathy with epilepsy, suggesting its role in regulating neuronal development [65]. A clinical study by Dutta et al. [66] reported that two patients with de novo mutations (T607I and I554F) in the C-terminus of the TOM70 protein exhibited white matter abnormalities, hypotonia, hyperreflexia, dystonia, and cognitive deficits.
Furthermore, our brain-specific gene co-expression analysis revealed that the DEGs exhibited gene co-expression clustering with OPA1, ITFG1, OXCT1, ATP2A2, MAPK1, CDK14, MAP2K4, YWHAB, PARK2, CMAS, HSPA12A, and RGS17, all of which were reported to play essential roles in the regulation of cell proliferation and AD pathogenesis. Similar to the results obtained in our analysis, Zhang et al. [64] detected the upregulation of ATP6V1A and OXCT1 in the AD cohorts compared to in the healthy cohorts [64]. Experimental evidence links OPA1 to the pathogenesis of Parkinsonian syndrome and dementia [63], while OXCT1 plays a central role in extrahepatic ketone body catabolism [67]. Collectively, the results of the present study suggest that CAMK4, BNIP3, TIPRL, TOMM70, and ATP6V1A are important DEGs that are associated with the pathogenesis of AD and thus serve as attractive targets in the development of therapeutic intervention.
Molecular docking is widely employed as an in silico model for elucidating the interactions between proteins and ligands and also in the estimation of the binding affinities of protein–ligand complexes [68,69]. This enables the depiction of the behavior of a drug candidate within the binding cavity of a receptor and ultimately gives an idea of the biological processes that could be modulated by the drug candidate [70,71]. Consequently, we conducted a molecular docking study to elucidate the potential druggability of the target genes by antrocin, a bioactive natural product. Interestingly, our molecular docking study suggested that antrocin exhibited strong interactions with the crystal structures of CAMK4 (PDB:2W4O), BNIP3 (PDB:2J5D), TIPRL (PDB:5WOW), TOMM70 (PDB:3FP3), and ATP6V1A (PDB:6XBY), with estimated binding affinities of −6.70, −5.80, −6.60, −6.80, and −5.90 kcal/mol, respectively. Our analysis of the protein–antrocin complexes revealed that antrocin interacted with the targets created by several hydrogen bonds, π-alkyl, van der Waals forces, and several hydrophobic contacts. Non-covalent interactions, such as hydrogen, hydrophobic and ionic bondings, and van der Waals forces, play crucial roles in stabilizing the interactions between drug candidates and their protein targets [72,73]. The higher number of interactions that antrocin has with CAMK4, TOMM70, and T1PRL could be responsible for the stronger affinities that antrocin has for these proteins than it does for BNIP3 or ATP6V1A. The van der Waals forces created around the antrocin backbone with the respective amino acids of the proteins would create a strong cohesive environment, which would further stabilize the complexes [74]. However, the lower affinity of antrocin for BNIP3 could be attributed to the absence of H-bonding in the antrocin–BNIP3 complex.
The BBB is a limiting factor in the therapeutic effects of most medications for treating AD. Although a number of AD drug treatment trials targeting BBB dynamics have been conducted, most of them have failed due to inadequate permeability. In addition, a subset of AD cases with chronic hypoperfusion features is complicated by an inadequate BBB [75]. Therefore, BBB permeation is an important factor that must be considered in the development of a new drug for AD. Interestingly, our in silico studies indicated that antrocin has high BBB permeability potential. Only a small fraction of small molecules cross the BBB via lipid-mediated free diffusion, and these molecules must have <8 hydrogen bonds and a molecular weight of < 400 Daltons (Da) [76]. Interestingly, antrocin satisfied these criteria, with a MW of 234.33 Da, a surface area of 26.30 Ų, and forms two hydrogen bonds. The MW threshold is a property of all biological membranes [77]. In agreement with our findings, a screening of CNS-acting drugs showed that all brain drugs have an MW <426 Da [78]. The BBB permeability decreases 100-fold when the surface area of a drug is increased from 50 Å2 to 100 Å2 [78], which would be the case when the MW of a drug increases from 300 Da to 450 Da [76]. Antrocin demonstrated good predictions for ADMET properties, drug-likeness, and adherence to Lipinskís rules. The pan-assay interference compounds (PAINS) are known as substructures of promiscuous molecules that are responsible to yield false-positive biological activities [44]. No alert was evidenced for antrocin in the PAINS analysis, suggesting that this compound is non-promiscuous and hence has potential for use in target therapy [79]. Our results suggest that antrocin is a BBB permeant drug-like molecule and hence may have translational potential for treating AD and other brain disorders.
Intestinal absorption and brain penetration are important factors to consider for therapeutic agents that are intended to treat neurodegenerative diseases in response to oral exposure [80]. Our results showed that antrocin is predicted to be highly absorbed by the human gastrointestinal tract. Increasing evidence has revealed that that the p-glycoprotein (P-gp) efflux may interact with drugs and consequently prevent their absorption by actively repelling them into the lumen of the intestine [81]. Our results indicated that antrocin is not a p-gp substrate, and this could account for the high predicted GIT absorption of antrocin. In the case of metabolism, various cytochrome P450 isoenzymes were evaluated, showing that antrocin is not a substrate for metabolism by CYP1A2, CYP2C19, CYP2D6, and CYP3A4 isoenzymes. In addition to BBB permeability, the high bioavailability of antrocin (0.55, Table 5) could ultimately favour its accessibility to the brain. Altogether, our results suggest that the oral administration of antrocin is likely to result in safer bioavailability and access to the BBB, thus suggesting its potential for AD treatment.
Taken together, the present study strengthened our understanding of the molecular pathogenesis of AD, identified disease targets, and suggested the therapeutic potential of antrocin. The main limitation of our study is the lack of the direct confirmation of these genes by reverse-transcription polymerase chain reaction (RT-PCR). However, experimental validation and the detailed therapeutic efficacy of antrocin in an AD animal model is currently ongoing in our laboratory. In addition, the RT-quantitative (q)PCR validation of these identified targets in clinical samples is ongoing.
5. Conclusions
Our findings identified a potential new gene signature, ATP6V1A/BNIP3/CAMK4/ TIPRL/TOMM70, as critical molecular markers in mitochondrial dysfunction, inflammatory processes, and various pathways participating in AD parthenogenesis. Additionally, in silico assays and docking experiments revealed that antrocin interacted well with the crystal structures of the proteins and exhibited a low acute toxicity level based on the in silico modelling of the various administration routes. Our results suggest the potential of antrocin in targeting the DEGs; however, further investigation is warranted for the clinical translation of antrocin to ameliorate and prevent AD.
Author Contributions
A.T.H.W. and B.L. wrote the manuscript; D.T.W.T. and Y.-T.W. provided the antrocin and helped with the in silico docking analyses; L.W. participated in molecular docking and revision of the manuscript. W.-C.L. oversaw the study. All authors read and agreed to the published version of the manuscript.
Funding
A.T.H.W. is funded by the Ministry of Education, Taipei Medical University (DP2-110-21121-03-C-09 and DP2-110-21121-01-H-03-03). Y.-T.W. is funded by the Ministry of Science and Technology (MOST110-2314-B-038-024).
Institutional Review Board Statement
Not applicable.
Informed Consent Statement
Not applicable.
Data Availability Statement
The datasets generated and analyzed in this study can be made available upon reasonable request.
Conflicts of Interest
The authors declare no conflict of interest.
Footnotes
Publisher’s Note: MDPI stays neutral with regard to jurisdictional claims in published maps and institutional affiliations.
References
- 1.Fleming R., Zeisel J., Bennett K. World Alzheimer Report: Design Dignity Dementia: Dementia Related Design and the Built Environment. Volume 1 Alzheimer’s Disease International; London, UK: 2020. [Google Scholar]
- 2.Evans D.A., Funkenstein H.H., Albert M.S., Scherr P.A., Cook N.R., Chown M.J., Hebert L.E., Hennekens C.H., Taylor J.O. Prevalence of Alzheimer’s disease in a community population of older persons: Higher than previously reported. JAMA. 1989;262:2551–2556. doi: 10.1001/jama.1989.03430180093036. [DOI] [PubMed] [Google Scholar]
- 3.Geldmacher D.S., Whitehouse P.J. Evaluation of Dementia. N. Engl. J. Med. 1996;335:330–336. doi: 10.1056/NEJM199608013350507. [DOI] [PubMed] [Google Scholar]
- 4.Girard H., Potvin O., Nugent S., Dallaire-Théroux C., Cunnane S., Duchesne S. Faster progression from MCI to probable AD for carriers of a single-nucleotide polymorphism associated with type 2 diabetes. Neurobiol. Aging. 2018;64:157.e111–157.e117. doi: 10.1016/j.neurobiolaging.2017.11.013. [DOI] [PubMed] [Google Scholar]
- 5.Sabry R., El Sharkawy R.E., Gad N.M. MiRNA -483-5p as a Potential Noninvasive Biomarker for Early Detection of Alzheimer’s Disease. Egypt. J. Immunol. 2020;27:59–72. [PubMed] [Google Scholar]
- 6.Nestor P.J., Scheltens P., Hodges J.R. Advances in the early detection of Alzheimer’s disease. Nat. Med. 2004;10:S34–S41. doi: 10.1038/nrn1433. [DOI] [PubMed] [Google Scholar]
- 7.Mistur R., Mosconi L., De Santi S., Guzman M., Li Y., Tsui W., de Leon M.J. Current challenges for the early detection of Alzheimer’s disease: Brain imaging and CSF studies. J. Clin. Neurol. 2009;5:153–166. doi: 10.3988/jcn.2009.5.4.153. [DOI] [PMC free article] [PubMed] [Google Scholar]
- 8.Holtzman D.M., Morris J.C., Goate A.M. Alzheimer’s disease: The challenge of the second century. Sci. Transl. Med. 2011;3:sr71–sr77. doi: 10.1126/scitranslmed.3002369. [DOI] [PMC free article] [PubMed] [Google Scholar]
- 9.Cedazo-Minguez A., Winblad B. Biomarkers for Alzheimer’s disease and other forms of dementia: Clinical needs, limitations and future aspects. Exp. Gerontol. 2010;45:5–14. doi: 10.1016/j.exger.2009.09.008. [DOI] [PubMed] [Google Scholar]
- 10.Beckman D., Morrison J.H. Towards developing a rhesus monkey model of early Alzheimer’s disease focusing on women’s health. Am. J. Primatol. 2021:e23289. doi: 10.1002/ajp.23289. [DOI] [PubMed] [Google Scholar]
- 11.Wang N., Zhang Y., Xu L., Jin S. Relationship Between Alzheimer’s Disease and the Immune System: A Meta-Analysis of Differentially Expressed Genes. Front. Neurosci. 2019;12:1026. doi: 10.3389/fnins.2018.01026. [DOI] [PMC free article] [PubMed] [Google Scholar]
- 12.Zhang Y.J., Sun Y.Z., Gao X.H., Qi R.Q. Integrated bioinformatic analysis of differentially expressed genes and signaling pathways in plaque psoriasis. Mol. Med. Rep. 2019;20:225–235. doi: 10.3892/mmr.2019.10241. [DOI] [PMC free article] [PubMed] [Google Scholar]
- 13.Durrenberger P.F., Fernando F.S., Kashefi S.N., Bonnert T.P., Seilhean D., Nait-Oumesmar B., Schmitt A., Gebicke-Haerter P.J., Falkai P., Grünblatt E., et al. Common mechanisms in neurodegeneration and neuroinflammation: A BrainNet Europe gene expression microarray study. J. Neural. Transm (Vienna) 2015;122:1055–1068. doi: 10.1007/s00702-014-1293-0. [DOI] [PubMed] [Google Scholar]
- 14.Areškevičiūtė A., Litman T., Broholm H., Melchior L.C., Nielsen P.R., Green A., Eriksen J.O., Smith C., Lund E.L. Regional Differences in Neuroinflammation-Associated Gene Expression in the Brain of Sporadic Creutzfeldt-Jakob Disease Patients. Int. J. Mol. Sci. 2020;22:140. doi: 10.3390/ijms22010140. [DOI] [PMC free article] [PubMed] [Google Scholar]
- 15.Liang W.S., Dunckley T., Beach T.G., Grover A., Mastroeni D., Ramsey K., Caselli R.J., Kukull W.A., McKeel D., Morris J.C., et al. Altered neuronal gene expression in brain regions differentially affected by Alzheimer’s disease: A reference data set. Physiol. Genom. 2008;33:240–256. doi: 10.1152/physiolgenomics.00242.2007. [DOI] [PMC free article] [PubMed] [Google Scholar]
- 16.Hokama M., Oka S., Leon J., Ninomiya T., Honda H., Sasaki K., Iwaki T., Ohara T., Sasaki T., LaFerla F.M., et al. Altered expression of diabetes-related genes in Alzheimer’s disease brains: The Hisayama study. Cereb. Cortex. 2014;24:2476–2488. doi: 10.1093/cercor/bht101. [DOI] [PMC free article] [PubMed] [Google Scholar]
- 17.Antonell A., Lladó A., Altirriba J., Botta-Orfila T., Balasa M., Fernández M., Ferrer I., Sánchez-Valle R., Molinuevo J.L. A preliminary study of the whole-genome expression profile of sporadic and monogenic early-onset Alzheimer’s disease. Neurobiol. Aging. 2013;34:1772–1778. doi: 10.1016/j.neurobiolaging.2012.12.026. [DOI] [PubMed] [Google Scholar]
- 18.Bertram L., McQueen M.B., Mullin K., Blacker D., Tanzi R.E. Systematic meta-analyses of Alzheimer disease genetic association studies: The AlzGene database. Nat. Genet. 2007;39:17–23. doi: 10.1038/ng1934. [DOI] [PubMed] [Google Scholar]
- 19.Newman D.J., Cragg G.M. Natural products as sources of new drugs over the 30 years from 1981 to 2010. J. Nat. Prod. 2012;75:311–335. doi: 10.1021/np200906s. [DOI] [PMC free article] [PubMed] [Google Scholar]
- 20.Lawal B., Shittu O.K., Oibiokpa F.I., Berinyuy E.B., Mohammed H. African natural products with potential antioxidants and hepatoprotectives properties: A review. Clin. Phytosci. 2017;2:1–66. doi: 10.1186/s40816-016-0037-0. [DOI] [Google Scholar]
- 21.Geethangili M., Tzeng Y.-M. Review of pharmacological effects of Antrodia camphorata and its bioactive compounds. Evid.-Based Complementary Altern. Med. 2011;2011:212641. doi: 10.1093/ecam/nep108. [DOI] [PMC free article] [PubMed] [Google Scholar]
- 22.Geethangili M., Rao Y.K., Tzeng Y.-M. Development and validation of a HPLC-DAD separation method for determination of bioactive antrocin in medicinal mushroom antrodia camphorata. Int. J. Appl. Sci. Eng. 2013;11:195–201. [Google Scholar]
- 23.Chen J.-H., Wu A.T.H., Tzeng D.T.W., Huang C.-C., Tzeng Y.-M., Chao T.-Y. Antrocin, a bioactive component from Antrodia cinnamomea, suppresses breast carcinogenesis and stemness via downregulation of β-catenin/Notch1/Akt signaling. Phytomedicine. 2019;52:70–78. doi: 10.1016/j.phymed.2018.09.213. [DOI] [PubMed] [Google Scholar]
- 24.Yeh C.-T., Huang W.-C., Rao Y.K., Ye M., Lee W.-H., Wang L.-S., Tzeng D.T., Wu C.-H., Shieh Y.-S., Huang C.-Y.F. A sesquiterpene lactone antrocin from Antrodia camphorata negatively modulates JAK2/STAT3 signaling via microRNA let-7c and induces apoptosis in lung cancer cells. Carcinogenesis. 2013;34:2918–2928. doi: 10.1093/carcin/bgt255. [DOI] [PubMed] [Google Scholar]
- 25.Rao Y.K., Wu A.T., Geethangili M., Huang M.-T., Chao W.-J., Wu C.-H., Deng W.-P., Yeh C.-T., Tzeng Y.-M. Identification of antrocin from Antrodia camphorata as a selective and novel class of small molecule inhibitor of Akt/mTOR signaling in metastatic breast cancer MDA-MB-231 cells. Chem. Res. Toxicol. 2011;24:238–245. doi: 10.1021/tx100318m. [DOI] [PubMed] [Google Scholar]
- 26.Chen Y.-A., Tzeng D.T.W., Huang Y.-P., Lin C.-J., Lo U.-G., Wu C.-L., Lin H., Hsieh J.-T., Tang C.-H., Lai C.-H. Antrocin Sensitizes Prostate Cancer Cells to Radiotherapy through Inhibiting PI3K/AKT and MAPK Signaling Pathways. Cancers. 2019;11:34. doi: 10.3390/cancers11010034. [DOI] [PMC free article] [PubMed] [Google Scholar]
- 27.Chiu K.-Y., Wu C.-C., Chia C.-H., Hsu S.-L., Tzeng Y.-M. Inhibition of growth, migration and invasion of human bladder cancer cells by antrocin, a sesquiterpene lactone isolated from Antrodia cinnamomea, and its molecular mechanisms. Cancer Lett. 2016;373:174–184. doi: 10.1016/j.canlet.2015.11.046. [DOI] [PubMed] [Google Scholar]
- 28.Hainfellner J.A., Wanschitz J., Jellinger K., Liberski P.P., Gullotta F., Budka H. Coexistence of Alzheimer-type neuropathology in Creutzfeldt-Jakob disease. Acta Neuropathol. 1998;96:116–122. doi: 10.1007/s004010050870. [DOI] [PubMed] [Google Scholar]
- 29.Calero O., Bullido M.J., Clarimón J., Frank-García A., Martínez-Martín P., Lleó A., Rey M.J., Rábano A., Blesa R., Gómez-Isla T., et al. Genetic cross-interaction between APOE and PRNP in sporadic Alzheimer’s and Creutzfeldt-Jakob diseases. PLoS ONE. 2011;6:e22090. doi: 10.1371/journal.pone.0022090. [DOI] [PMC free article] [PubMed] [Google Scholar]
- 30.Dorey A., Tholance Y., Vighetto A., Perret-Liaudet A., Lachman I., Krolak-Salmon P., Wagner U., Struyfs H., De Deyn P.P., El-Moualij B., et al. Association of Cerebrospinal Fluid Prion Protein Levels and the Distinction Between Alzheimer Disease and Creutzfeldt-Jakob Disease. JAMA Neurol. 2015;72:267–275. doi: 10.1001/jamaneurol.2014.4068. [DOI] [PubMed] [Google Scholar]
- 31.Ritchie M.E., Phipson B., Wu D., Hu Y., Law C.W., Shi W., Smyth G.K. limma powers differential expression analyses for RNA-sequencing and microarray studies. Nucleic Acids Res. 2015;43:e47. doi: 10.1093/nar/gkv007. [DOI] [PMC free article] [PubMed] [Google Scholar]
- 32.Zhou G., Soufan O., Ewald J., Hancock R.E.W., Basu N., Xia J. NetworkAnalyst 3.0: A visual analytics platform for comprehensive gene expression profiling and meta-analysis. Nucleic Acids Res. 2019;47:W234–W241. doi: 10.1093/nar/gkz240. [DOI] [PMC free article] [PubMed] [Google Scholar]
- 33.Selvaraj G., Kaliamurthi S., Kaushik A.C., Khan A., Wei Y.-K., Cho W.C., Gu K., Wei D.-Q. Identification of target gene and prognostic evaluation for lung adenocarcinoma using gene expression meta-analysis, network analysis and neural network algorithms. J. Biomed. Inform. 2018;86:120–134. doi: 10.1016/j.jbi.2018.09.004. [DOI] [PubMed] [Google Scholar]
- 34.Huang S., Wei Y.-K., Kaliamurthi S., Cao Y., Nangraj A.S., Sui X., Chu D., Wang H., Wei D.-Q., Peslherbe G.H., et al. Circulating miR-1246 Targeting UBE2C, TNNI3, TRAIP, UCHL1 Genes and Key Pathways as a Potential Biomarker for Lung Adenocarcinoma: Integrated Biological Network Analysis. J. Pers. Med. 2020;10:162. doi: 10.3390/jpm10040162. [DOI] [PMC free article] [PubMed] [Google Scholar]
- 35.Chen E.Y., Tan C.M., Kou Y., Duan Q., Wang Z., Meirelles G.V., Clark N.R., Ma’ayan A. Enrichr: Interactive and collaborative HTML5 gene list enrichment analysis tool. BMC Bioinform. 2013;14:128. doi: 10.1186/1471-2105-14-128. [DOI] [PMC free article] [PubMed] [Google Scholar]
- 36.Kuleshov M.V., Jones M.R., Rouillard A.D., Fernandez N.F., Duan Q., Wang Z., Koplev S., Jenkins S.L., Jagodnik K.M., Lachmann A., et al. Enrichr: A comprehensive gene set enrichment analysis web server 2016 update. Nucleic Acids Res. 2016;44:W90–W97. doi: 10.1093/nar/gkw377. [DOI] [PMC free article] [PubMed] [Google Scholar]
- 37.Szklarczyk D., Gable A.L., Lyon D., Junge A., Wyder S., Huerta-Cepas J., Simonovic M., Doncheva N.T., Morris J.H., Bork P., et al. STRING v11: Protein-protein association networks with increased coverage, supporting functional discovery in genome-wide experimental datasets. Nucleic Acids Res. 2019;47:D607–D613. doi: 10.1093/nar/gky1131. [DOI] [PMC free article] [PubMed] [Google Scholar]
- 38.Carvalho-Silva D., Pierleoni A., Pignatelli M., Ong C., Fumis L., Karamanis N., Carmona M., Faulconbridge A., Hercules A., McAuley E., et al. Open Targets Platform: New developments and updates two years on. Nucleic Acids Res. 2019;47:D1056–D1065. doi: 10.1093/nar/gky1133. [DOI] [PMC free article] [PubMed] [Google Scholar]
- 39.Kern F., Fehlmann T., Solomon J., Schwed L., Grammes N., Backes C., Van Keuren-Jensen K., Craig D.W., Meese E., Keller A. miEAA 2.0: Integrating multi-species microRNA enrichment analysis and workflow management systems. Nucleic Acids Res. 2020;48:W521–W528. doi: 10.1093/nar/gkaa309. [DOI] [PMC free article] [PubMed] [Google Scholar]
- 40.Daina A., Michielin O., Zoete V. SwissADME: A free web tool to evaluate pharmacokinetics, drug-likeness and medicinal chemistry friendliness of small molecules. Sci. Rep. 2017;7:42717. doi: 10.1038/srep42717. [DOI] [PMC free article] [PubMed] [Google Scholar]
- 41.Poroikov V.V., Filimonov D.A., Gloriozova T.A., Lagunin A.A., Druzhilovskiy D.S., Rudik A.V., Stolbov L.A., Dmitriev A.V., Tarasova O.A., Ivanov S.M., et al. Computer-aided prediction of biological activity spectra for organic compounds: The possibilities and limitations. Russ. Chem. Bull. 2019;68:2143–2154. doi: 10.1007/s11172-019-2683-0. [DOI] [Google Scholar]
- 42.Liu H., Wang L., Lv M., Pei R., Li P., Pei Z., Wang Y., Su W., Xie X.-Q. AlzPlatform: An Alzheimer’s Disease Domain-Specific Chemogenomics Knowledgebase for Polypharmacology and Target Identification Research. J. Chem. Inf. Modeling. 2014;54:1050–1060. doi: 10.1021/ci500004h. [DOI] [PMC free article] [PubMed] [Google Scholar]
- 43.Daina A., Zoete V. A BOILED-Egg To Predict Gastrointestinal Absorption and Brain Penetration of Small Molecules. ChemMedChem. 2016;11:1117–1121. doi: 10.1002/cmdc.201600182. [DOI] [PMC free article] [PubMed] [Google Scholar]
- 44.Baell J.B., Holloway G.A. New substructure filters for removal of pan assay interference compounds (PAINS) from screening libraries and for their exclusion in bioassays. J. Med. Chem. 2010;53:2719–2740. doi: 10.1021/jm901137j. [DOI] [PubMed] [Google Scholar]
- 45.Lagunin A., Zakharov A., Filimonov D., Poroikov V. QSAR Modelling of Rat Acute Toxicity on the Basis of PASS Prediction. Mol. Inform. 2011;30:241–250. doi: 10.1002/minf.201000151. [DOI] [PubMed] [Google Scholar]
- 46.Marcus D., Hanwell D.E.C., David C.L., Tim V., Eva Z., Geoffrey R.H. Avogadro: An advanced semantic chemical editor, visualization, and analysis platform. J. Cheminform. 2012;4:17. doi: 10.1186/1758-2946-4-17. [DOI] [PMC free article] [PubMed] [Google Scholar]
- 47.Trott O., Olson A.J. AutoDock Vina: Improving the speed and accuracy of docking with a new scoring function, efficient optimization, and multithreading. J. Comput. Chem. 2010;31:455–461. doi: 10.1002/jcc.21334. [DOI] [PMC free article] [PubMed] [Google Scholar]
- 48.Lawal B., Liu Y.-L., Mokgautsi N., Khedkar H., Sumitra M.R., Wu A.T.H., Huang H.-S. Pharmacoinformatics and Preclinical Studies of NSC765690 and NSC765599, Potential STAT3/CDK2/4/6 Inhibitors with Antitumor Activities against NCI60 Human Tumor Cell Lines. Biomedicines. 2021;9:92. doi: 10.3390/biomedicines9010092. [DOI] [PMC free article] [PubMed] [Google Scholar]
- 49.Lawal B., Lee C.-Y., Mokgautsi N., Sumitra M.R., Khedkar H., Wu A.T.H., Huang H.-S. mTOR/EGFR/iNOS/MAP2K1/FGFR/TGFB1 Are Druggable Candidates for N-(2,4-Difluorophenyl)-2′,4′-Difluoro-4-Hydroxybiphenyl-3-Carboxamide (NSC765598), With Consequent Anticancer Implications. Front. Oncol. 2021;11:656738. doi: 10.3389/fonc.2021.656738. [DOI] [PMC free article] [PubMed] [Google Scholar]
- 50.Visualizer D.S. BIOVIA, Dassault Systèmes, BIOVIA Workbook. Dassault Systèmes; San Diego, CA, USA: 2020. Release 2020; BIOVIA Pipeline Pilot, Release 2020. [Google Scholar]
- 51.Salentin S., Schreiber S., Haupt V.J., Adasme M.F., Schroeder M. PLIP: Fully automated protein-ligand interaction profiler. Nucleic Acids Res. 2015;43:W443–W447. doi: 10.1093/nar/gkv315. [DOI] [PMC free article] [PubMed] [Google Scholar]
- 52.Lawal B., Kuo Y.-C., Sumitra M.R., Wu A.T., Huang H.-S. In vivo Pharmacokinetic and Anticancer Studies of HH-N25, a Selective Inhibitor of Topoisomerase I, and Hormonal Signaling for Treating Breast Cancer. J. Inflamm. Res. 2021;14:1–13. doi: 10.2147/JIR.S329401. [DOI] [PMC free article] [PubMed] [Google Scholar]
- 53.Brookmeyer R., Johnson E., Ziegler-Graham K., Arrighi H.M. Forecasting the global burden of Alzheimer’s disease. Alzheimers Dement. 2007;3:186–191. doi: 10.1016/j.jalz.2007.04.381. [DOI] [PubMed] [Google Scholar]
- 54.Takizawa C., Thompson P.L., van Walsem A., Faure C., Maier W.C. Epidemiological and economic burden of Alzheimer’s disease: A systematic literature review of data across Europe and the United States of America. J. Alzheimers Dis. 2015;43:1271–1284. doi: 10.3233/JAD-141134. [DOI] [PubMed] [Google Scholar]
- 55.Pan Y., Choy K.H.C., Marriott P.J., Chai S.Y., Scanlon M.J., Porter C.J.H., Short J.L., Nicolazzo J.A. Reduced blood-brain barrier expression of fatty acid-binding protein 5 is associated with increased vulnerability of APP/PS1 mice to cognitive deficits from low omega-3 fatty acid diets. J. Neurochem. 2018;144:81–92. doi: 10.1111/jnc.14249. [DOI] [PubMed] [Google Scholar]
- 56.Zhang G., Zhang Y., Shen Y., Wang Y., Zhao M., Sun L. The Potential Role of Ferroptosis in Alzheimer’s Disease. J. Alzheimers Dis. 2021;80:907–925. doi: 10.3233/JAD-201369. [DOI] [PubMed] [Google Scholar]
- 57.Prieto G.A., Trieu B.H., Dang C.T., Bilousova T., Gylys K.H., Berchtold N.C., Lynch G., Cotman C.W. Pharmacological Rescue of Long-Term Potentiation in Alzheimer Diseased Synapses. J. Neurosci. 2017;37:1197–1212. doi: 10.1523/JNEUROSCI.2774-16.2016. [DOI] [PMC free article] [PubMed] [Google Scholar]
- 58.Arroyo-García L.E., Tendilla-Beltrán H., Vázquez-Roque R.A., Jurado-Tapia E.E., Díaz A., Aguilar-Alonso P., Brambila E., Monjaraz E., De La Cruz F., Rodríguez-Moreno A., et al. Amphetamine sensitization alters hippocampal neuronal morphology and memory and learning behaviors. Mol. Psychiatry. 2020 doi: 10.1038/s41380-020-0809-2. [DOI] [PubMed] [Google Scholar]
- 59.Hu Y.-S., Xin J., Hu Y., Zhang L., Wang J. Analyzing the genes related to Alzheimer’s disease via a network and pathway-based approach. Alzheimers Res. Ther. 2017;9:29. doi: 10.1186/s13195-017-0252-z. [DOI] [PMC free article] [PubMed] [Google Scholar]
- 60.Akiyama H., Barger S., Barnum S., Bradt B., Bauer J., Cole G.M., Cooper N.R., Eikelenboom P., Emmerling M., Fiebich B.L. Inflammation and Alzheimer’s disease. Neurobiol. Aging. 2000;21:383–421. doi: 10.1016/S0197-4580(00)00124-X. [DOI] [PMC free article] [PubMed] [Google Scholar]
- 61.Tuppo E.E., Arias H.R. The role of inflammation in Alzheimer’s disease. Int. J. Biochem. Cell Biol. 2005;37:289–305. doi: 10.1016/j.biocel.2004.07.009. [DOI] [PubMed] [Google Scholar]
- 62.Griffin W., Sheng J., Royston M., Gentleman S., McKenzie J., Graham D., Roberts G., Mrak R. Glial-neuronal interactions in Alzheimer’s disease: The potential role of a ‘cytokine cycle’in disease progression. Brain Pathol. 1998;8:65–72. doi: 10.1111/j.1750-3639.1998.tb00136.x. [DOI] [PMC free article] [PubMed] [Google Scholar]
- 63.Carelli V., Musumeci O., Caporali L., Zanna C., La Morgia C., Del Dotto V., Porcelli A.M., Rugolo M., Valentino M.L., Iommarini L., et al. Syndromic parkinsonism and dementia associated with OPA1 missense mutations. Ann. Neurol. 2015;78:21–38. doi: 10.1002/ana.24410. [DOI] [PMC free article] [PubMed] [Google Scholar]
- 64.Fan Zhang S.Z., Siman Y., Yuting W., Jingjing W., Jinlan H., Dengpan W., Zhenguo Z. Identification of Potential Therapeutic Targets of Alzheimer’s Disease By Weighted Gene Co-Expression Network Analysis. Chin. Med. Sci. J. 2020;35:330–341. doi: 10.24920/003695. [DOI] [PubMed] [Google Scholar]
- 65.Fassio A., Esposito A., Kato M., Saitsu H., Mei D., Marini C., Conti V., Nakashima M., Okamoto N., Olmez Turker A., et al. De novo mutations of the ATP6V1A gene cause developmental encephalopathy with epilepsy. Brain. 2018;141:1703–1718. doi: 10.1093/brain/awy092. [DOI] [PMC free article] [PubMed] [Google Scholar]
- 66.Palmer C.S., Anderson A.J., Stojanovski D. Mitochondrial protein import dysfunction: Mitochondrial disease, neurodegenerative disease and cancer. FEBS Lett. 2021;595:1107–1131. doi: 10.1002/1873-3468.14022. [DOI] [PubMed] [Google Scholar]
- 67.Shafqat N., Kavanagh K.L., Sass J.O., Christensen E., Fukao T., Lee W.H., Oppermann U., Yue W.W. A structural mapping of mutations causing succinyl-CoA:3-ketoacid CoA transferase (SCOT) deficiency. J. Inherit. Metab. Dis. 2013;36:983–987. doi: 10.1007/s10545-013-9589-z. [DOI] [PMC free article] [PubMed] [Google Scholar]
- 68.Kitchen D.B., Decornez H., Furr J.R., Bajorath J. Docking and scoring in virtual screening for drug discovery: Methods and applications. Nat. Rev. Drug Discov. 2004;3:935–949. doi: 10.1038/nrd1549. [DOI] [PubMed] [Google Scholar]
- 69.Chen J.-H., Wu A.T.H., Lawal B., Tzeng D.T.W., Lee J.-C., Ho C.-L., Chao T.-Y. Identification of Cancer Hub Gene Signatures Associated with Immune-Suppressive Tumor Microenvironment and Ovatodiolide as a Potential Cancer Immunotherapeutic Agent. Cancers. 2021;13:3847. doi: 10.3390/cancers13153847. [DOI] [PMC free article] [PubMed] [Google Scholar]
- 70.Meng X.-Y., Zhang H.-X., Mezei M., Cui M. Molecular docking: A powerful approach for structure-based drug discovery. Curr. Comput.-Aided Drug Des. 2011;7:146–157. doi: 10.2174/157340911795677602. [DOI] [PMC free article] [PubMed] [Google Scholar]
- 71.Jorgensen W.L. The many roles of computation in drug discovery. Science. 2004;303:1813–1818. doi: 10.1126/science.1096361. [DOI] [PubMed] [Google Scholar]
- 72.Zhao H., Huang D. Hydrogen bonding penalty upon ligand binding. PLoS ONE. 2011;6:e19923. doi: 10.1371/journal.pone.0019923. [DOI] [PMC free article] [PubMed] [Google Scholar]
- 73.Lawal B., Lo W.-C., Mokgautsi N., Sumitra M.R., Khedkar H., Wu A.T., Huang H.-S. A preclinical report of a cobimetinib-inspired novel anticancer small-molecule scaffold of isoflavones, NSC777213, for targeting PI3K/AKT/mTOR/MEK in multiple cancers. Am. J. Cancer Res. 2021;11:2590–2617. [PMC free article] [PubMed] [Google Scholar]
- 74.Arthur D.E., Uzairu A. Molecular docking studies on the interaction of NCI anticancer analogues with human Phosphatidylinositol 4,5-bisphosphate 3-kinase catalytic subunit. J. King Saud Univ. Sci. 2019;31:1151–1166. doi: 10.1016/j.jksus.2019.01.011. [DOI] [Google Scholar]
- 75.Yang H., Wang W., Jia L., Qin W., Hou T., Wu Q., Li H., Tian Y., Jia J. The Effect of Chronic Cerebral Hypoperfusion on Blood-Brain Barrier Permeability in a Transgenic Alzheimer’s Disease Mouse Model (PS1V97L) J. Alzheimers Dis. 2020;74:261–275. doi: 10.3233/JAD-191045. [DOI] [PubMed] [Google Scholar]
- 76.Pardridge W.M. Brain Drug Targeting: The Future of Brain Drug Development. Cambridge University Press; Cambridge, UK: 2001. [Google Scholar]
- 77.Cohen B., Bangham A. Diffusion of small non-electrolytes across liposome membranes. Nature. 1972;236:173–174. doi: 10.1038/236173a0. [DOI] [PubMed] [Google Scholar]
- 78.Fischer H., Gottschlich R., Seelig A. Blood-brain barrier permeation: Molecular parameters governing passive diffusion. J. Membr. Biol. 1998;165:201–211. doi: 10.1007/s002329900434. [DOI] [PubMed] [Google Scholar]
- 79.Feldmann C., Bajorath J. Machine learning reveals that structural features distinguishing promiscuous and non-promiscuous compounds depend on target combinations. Sci. Rep. 2021;11:1–7. doi: 10.1038/s41598-021-87042-z. [DOI] [PMC free article] [PubMed] [Google Scholar]
- 80.Han J., Ji Y., Youn K., Lim G., Lee J., Kim D.H., Jun M. Baicalein as a Potential Inhibitor against BACE1 and AChE: Mechanistic Comprehension through In Vitro and Computational Approaches. Nutrients. 2019;11:2694. doi: 10.3390/nu11112694. [DOI] [PMC free article] [PubMed] [Google Scholar]
- 81.Chedik L., Mias-Lucquin D., Bruyere A., Fardel O. In Silico Prediction for Intestinal Absorption and Brain Penetration of Chemical Pesticides in Humans. Int. J. Environ. Res. Public Health. 2017;14:708. doi: 10.3390/ijerph14070708. [DOI] [PMC free article] [PubMed] [Google Scholar]
Associated Data
This section collects any data citations, data availability statements, or supplementary materials included in this article.
Data Availability Statement
The datasets generated and analyzed in this study can be made available upon reasonable request.


