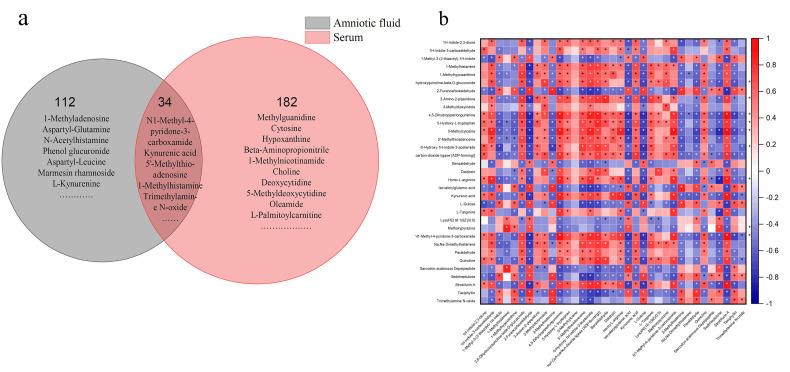
Figure 6.
The common differential metabolites in serum and AF samples and their association. (a) The Venn diagram of common metabolites in serum and AF samples. (b) The correlation heat map of metabolites. The vertical axis: differential metabolites in AF; the horizontal axis: differential metabolites in serum samples. The red represents positive association; the blue represents negative association. The darker the color, the stronger the correlation between the two kinds of samples. The asterisk meant the statistical significance (p < 0.05).

