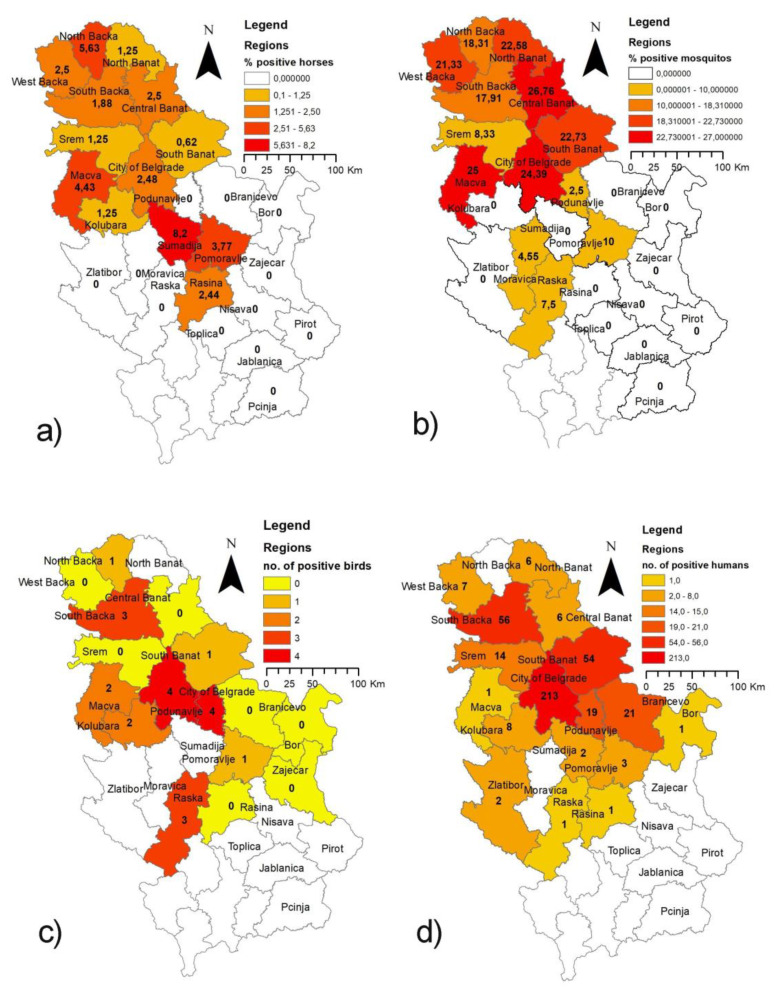
Figure 1.
Distribution of WNV activity detected during the 2018 surveillance program at the district level. (a,b) show WNV infection rates as percentages (number of positive samples/number of samples tested) for a horses, and b mosquito pools. The comma instead of the point in the percentage values represent the decimal separator shown by the software that was used for the preparation of the maps. (c) presents the number of found WNV positive wild birds and (d) presents the number of clinical and laboratory-confirmed human West Nile cases reported to the ECDC. The basic administrative maps were extracted from the GADM database of Global Administrative Areas (www.gadm.org), version 3.6 (accessed on 15 February 2021), and were changed subsequently according to the data presented in them.

