

Summary
The microtubule associated protein tau oligomerizes, but the actions of oligomeric tau (oTau) are unknown. We have used Cry2-based optogenetics to induce tau oligomers (oTau-c). Optical induction of oTau-c elicits tau phosphorylation, aggregation and a translational stress response that includes stress granules and reduced protein synthesis. Proteomic analysis identifies HNRNPA2B1 as a principle target of oTau-c. The association of HNRNPA2B1 with endogenous oTau was verified in neurons, animal models and human Alzheimer brain tissues. Mechanistic studies demonstrate that HNRNPA2B1 functions as a linker, connecting oTau with N6-methyladenosine (m6A) modified RNA transcripts. Knockdown of HNRNPA2B1 prevents oTau or oTau-c from associating with m6A or from reducing protein synthesis, and reduces oTau-induced neurodegeneration. Levels of m6A and the m6A-oTau-HNRNPA2B1 complex are increased up to 5-fold in brains of Alzheimer subjects and P301S tau mice. These results reveal a complex containing oTau, HNRNPA2B1 and m6A that contributes to the integrated stress response of oTau.
eTOC Blurb:
Oligomerization of microtubule-associated protein tau recruits RNA binding proteins and methylated RNA transcripts, termed N6-methyladenosine RNA. This complex regulates the stress response and inhibits protein synthesis. In Alzheimer’s disease and related models, this complex becomes persistent and pathological, leading to tau fibrillization, nuclear membrane disruption and progressive neurodegeneration.
Graphical Abstract

INTRODUCTION
The microtubule associated protein tau stabilizes microtubules in healthy conditions. However, tau oligomerizes, becomes phosphorylated, and accumulates in the somatodendritic arbor in response to stress and diseases, such as Alzheimer’s disease (AD) and other tauopathies (Scheltens et al., 2016; Wang and Mandelkow, 2016). An immense body of literature describes the biochemical changes occurring in tau under these conditions (Wang and Mandelkow, 2016), but left largely undiscovered are the biological functions of tau in stress and disease states.
Previous studies suggest that tau pathology is associated with strong changes in the biology of RNA binding proteins (RBPs) as well as the nuclear membrane (Apicco et al., 2018; Eftekharzadeh et al., 2018; Vanderweyde et al., 2016). Induction of stress responses drives pathological tau to associate with RBPs, co-localize with stress granules (SGs) and induce a translational stress response (Bishof et al., 2018; Chauderlier et al., 2018; Maziuk et al., 2018; Silva et al., 2019; Thompson et al., 2012; Vanderweyde et al., 2016). However, these studies were unable to distinguish the effects caused by tau itself from the effects caused by the other pathways induced by concomitant stress. We now apply the light-reactive bacterial cytochrome 2 (Cry2) protein to generate oligomers of the tau-Cry2 chimeras (Lamprecht, 2019; Shin et al., 2017), creating the ability to optically, selectively induce tau oligomerization in a temporally controlled manner.
We report that the optically induced tau-Cry2 oligomers (oTau-c) behave in a manner similar to untagged oligomers, exhibiting an ability to seed tau aggregation in tau K18 tau sensor lines and a pattern of biochemical fractionation similar to that of oTau (Apicco et al., 2018; Sanders et al., 2014). Characterization of the tau protein-protein interaction (PPI) networks demonstrates a temporal evolution exhibiting greatly increased binding to RBPs, particularly HNRNPA2B1, as well as binding to multiple proteins genetically associated with AD and other neurodegenerative diseases. The role of HNRNPA2B1 as an indirect reader of N6-methyladenosine (m6A) tagged transcripts led us to investigate the role of m6A in the biology of tau (Zaccara et al., 2019). We observe that tau oligomerization induces striking cytoplasmic translocation of m6A to co-localizations with HNRNPA2B1 and oTau. HNRNPA2B1 is required for localization of oTau with m6A, which suggests that HNRNPA2B1 functions as a m6A reader (indirect) that links oTau to m6A labeled transcripts.
RESULTS
Optogenetic Cry2 drives tau oligomerization in primary cortical neurons.
We created tau::mCherry::Cry2Olig (Tau::Cry2) and mCherry::Cry2Olig (control, mCherry::Cry2) chimeras in which the Cry2Olig protein was added to the C-terminus of 4R1N WT tau::mCherry constructs (or mCherry alone) in lentiviral expression constructs (Fig. 1A).
Figure 1. Optogenetic Cry2Olig drives tau oligomerization in primary cortical neurons.
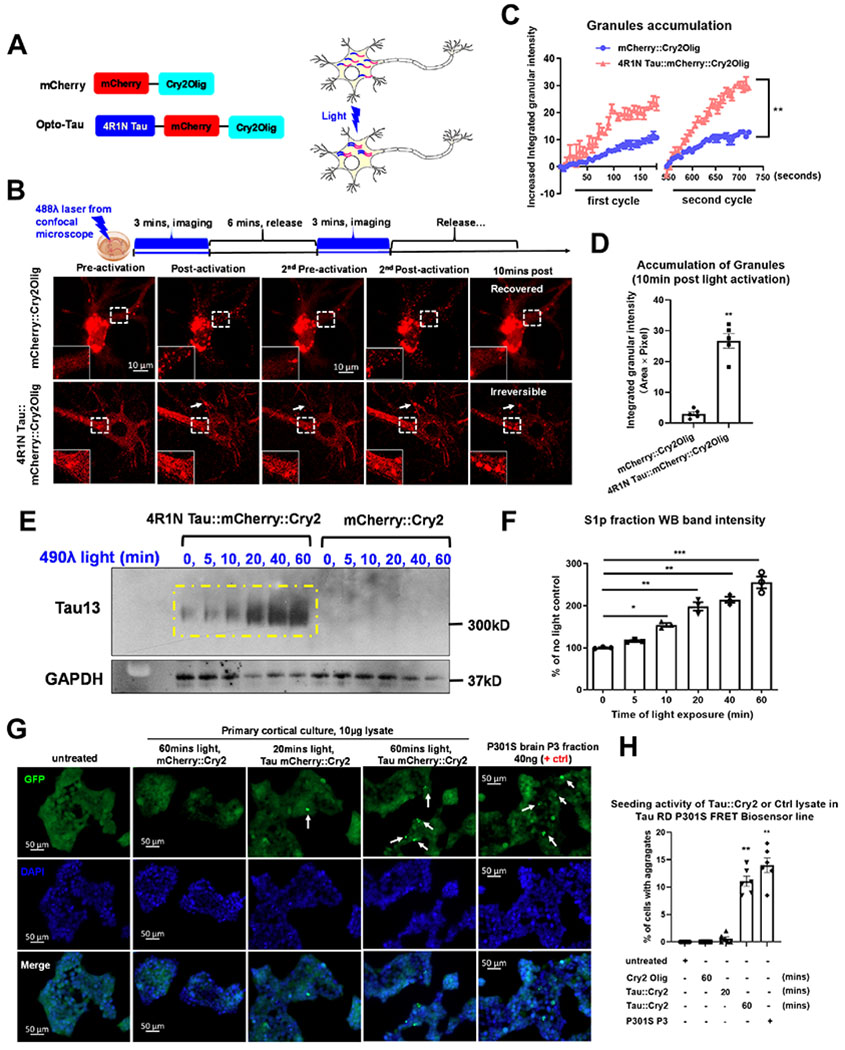
(A) Schematic diagram of the optogenetic platform. (B) Images of blue light-activated assembly of mCherry::Cry2 or 4R1N Tau::Cry2 chimeras in living cells. Scale bar, 20μm. (C) Quantification of rapid clustering of mCherry::Cry2 or 4R1N Tau::Cry2 chimeras in the first and second cycles of 488λ blue light activation in (B), n=10. Linear regression XY analyses **p<0.01. (D) Quantification of long-lasting oligomers at 10 mins after the termination of light. n=10. (E) The Tau::Cry2 and mCherry::Cry2 transduced cultures were exposed to light for 0, 5, 10, 20, 40 and 60 min. S1p TBS-extracted oTau-c fraction was quantified by IB with the Tau13. (F) Quantification of the IB in (E) with GAPDH as an internal control followed by being normalized to the “no light” negative control group. N=3. (G) Images of the seeding activity of total lysate extracted from neurons expressing Tau::Cry2 exposed to 20 or 60 min light. The P3 fraction of fibrillar tau from PS19 P301S mice (9 months old) was used as a positive control. Scale bar, 50μm. (H) Quantification of seeding induced by tau aggregates from the Tau::Cry2 or mCherry::Cry2 neurons. N=6. Error bars = SEM. One-way ANOVA with Tukey’s multiple comparisons test were used for experiments with > 2 groups, *p<0.05, **p<0.01, ***p<0.005.
Tau::Cry2 constructs were transduced into SH-SY5Y, N2a and HEK cells. Transduction was readily evident, as shown by the presence of mCherry in all of the lines (Suppl. Videos. 1 & 2). Exposure to 488λ blue light (200μW/cm2), induced rapid and robust translocation of tau from the dispersed, soluble fraction to microtubules in all the cell lines (Suppl. Videos. 1 & 2), consistent with a prior report (Zhang et al., 2020). Formation of cytoplasmic granules, such as those formed using FUS::Cry2 or DDX4::Cry2 constructs, was rare (Shin et al., 2017). However, upon transducing Tau::Cry2 into cultured cortical neurons, light induced robust formation of large cytoplasmic inclusions containing Tau::Cry2 (Fig. 1A–D). Thus, further studies of Tau::Cry2 were performed in cultured cortical neurons.
Transduction into cultured cortical neurons showed Tau::Cry2 associated with microtubules, consistent with the known homeostatic function of tau (Suppl. Fig. 1A). The distribution of Tau::Cry2 and microtubules were examined using immunofluorescence with anti-α-tubulin antibody labeling (green) and Tau::mCherry::Cry2 fluorescence (red). With no blue light stimulation or short light exposure (5 min) Tau::Cry2 formed filaments that colocalized with α-tubulin (Suppl. Fig. 1A, Suppl. Video 5). Increasing duration of light exposure (>10 min) caused Tau::Cry2 to form round granules in neurons that did not colocalize with α-tubulin (Suppl. Fig. 1A, Suppl. Video 6). This Tau::Cry2 granule formation was most abundant in the somatic region, while Tau::Cry2 in the dendritic fields largely retained its association with microtubules (Suppl. Fig. 1A).
Tau::Cry2 was transduced in 60% of the neurons, but Tau::Cry2 oligomerization occurred only in 30% of transduced neurons exhibiting strong Tau::Cry2 expression (Suppl. Video 3–6). Transient light exposure lasting <4 min induced granules for both Tau::Cry2 and mCherry::Cry2 constructs, with both sets of granules rapidly dispersing upon termination of the illumination (Fig. 1B). However, with repeated or increasing duration of light exposure, the oTau-c became more stable, showing no dispersion upon termination of the illumination (Fig. 1B–D, Suppl. Video 5, 6). In contrast, the mCherry::Cry2 oligomers remained rapidly reversible even after prolonged light exposures (Fig. 1B–D, Suppl. Video 3, 4).
Light-induced oligomerization of Tau::Cry2 was confirmed in neuronal lysates through biochemical fractionation. Tau::Cry2 and mCherry::Cry2 transduced cultures were exposed to light for up to 60 min. The S1p biochemical fractions (the pellet resulting from centrifugation of the S1 TBS-soluble material) (Apicco et al., 2018; Berger et al., 2007; Santacruz et al., 2005) were analyzed by Native PAGE immunoblot (IB) with the pan-tau antibody Tau13 (Fig. 1E). Increasing duration of light exposure was associated with the progressive accumulation of high molecular weight oligomeric tau (Fig. 1F). This species of corresponds to the expected molecular weight of dimeric oTau-c (~300 KDa); in contrast, no such accumulation of the mCherry::Cry2 occurred (Suppl. Fig. 1B, C). Increasing light exposure also produced a progressive increase in TOC1 positive oligomers in the Tau::Cry2 cells, but not in mCherry::Cry2 cells (Suppl. Fig. 1D, E) (Koss et al., 2016). The Tau::Cry2 neurons (but not mCherry::Cry2 neurons) exposed to 60 min of light (488λ) also showed thioflavin S positive inclusions, indicating fibrillization (Suppl. Fig. 1F, G).
Note that this manuscript uses TOC1 and TOMA2 to detect tau oligomers (Combs and Kanaan, 2017; Kanaan et al., 2016; Koss et al., 2016; Ruan et al., 2020). TOC1 is used for dot blots and IBs, while TOMA2 is used for imaging.
Tau sensor lines were used to detect tau aggregates capable of propagating pathology (Sanders et al., 2014). Tau::Cry2 and mCherry::Cry2 transduced neurons were exposed to light for 20 or 60 min, from which 10 μg of lysate was applied to tau sensor line; fractions from 9 month PS19 P301S tau mouse brain (S1p tau oligomer and P3 tau fibril, 40 ng each) were used as positive controls. After 24 hrs, fluorescence resonance energy transfer (FRET) reactivity was evaluated. Robust seeding was induced in the sensor line by lysate from the Tau::Cry2 60 min but not 20 min light exposure (Fig. 1G, H). These data suggest that prolonged light exposure induces tau to pass from an oligomeric state into a fibrillar state. Together, these data demonstrate that Tau::Cry2 is capable of rapidly inducing reversible tau oligomerization that, upon prolonged induction, evolves into stable, poorly reversible, propagation-competent aggregates of tau exhibiting thioflavin S reactivity.
Tau oligomerization elicits phosphorylation at disease-associated epitopes.
Light mediated tau oligomerization induced robust phosphorylation of T181 (Suppl. Fig. 2A–B, antibody AT270) and S262 (Suppl. Fig. 2C–D, antibody 12E8); light did not increase tau phosphorylation in cells expressing just mCherry::Cry2Olig (Suppl. Fig. 2B, D). No increase in pS202 phosphorylation was observed (antibodies CP13 and AT8, data not shown), which could reflect differential signaling or steric hinderance. The kinetics of phosphorylation were markedly slower than the kinetics of oligomerization (Suppl. Fig. 2A–D). Interestingly, Tau phosphorylation accumulated both in neurons expressing Tau::Cry2 and in adjacent neurons, perhaps reflecting a transcellular response.
Light-induced Tau oligomerization elicits neurotoxicity.
We proceeded to test whether light-induced tau oligomers also are capable of inducing neurodegeneration, similar to prior studies (Ash et al., 2021). Cortical neuron cultures were transduced with Tau::Cry2 or mCherry::Cry2 and exposed to light (488λ) for 20 min each day for 3 consecutive days (Suppl. Fig. 3A). The cultured neurons were then examined using 3 independent measures of neurodegeneration: neurite length, LDH release and cleaved caspase 3 reactivity (Suppl. Fig. 3B–G).
Tau::Cry2 neurons exposed to light in a chronic manner (20 min/day x 3 days) exhibited striking reductions in dendritic length, aberrant dendritic morphology and eventually reduced cell number, which are indications of cell death (Suppl. Fig. 3B–D). Immunofluorescence labeling also demonstrated that the neurons exhibited increases in cleaved caspase3 intensity in light-exposed 4R1N Tau::Cry2 and MAP-2 positive neurons, indicating increased pro-apoptotic activity (Suppl. Fig. 3E, F). Conditioned medium collected from Tau::Cry2 (and mCherry::Cry2) transduced cultures exposed to light exhibited elevated levels of LDH (Suppl. Fig. 3G).
Inhibition of protein synthesis, which is part of the translational stress response, was monitored using SUnSET (Koren et al., 2019); 10 μg/ml of puromycin was added to Tau::Cry2 or mCherry::Cry2 cortical neurons prior to light exposure. Anti-puromycin antibody was used to detect puromycin incorporation into nascent proteins by IB (normalized to total protein levels observed by Ponceau S). Tau::Cry2 neurons exposed to light exhibited decreased protein synthesis throughout the cytoplasm and reduced levels of puromycin labeling by IB (Suppl. Fig. 3H–J).
Proteomic profiling reveals the evolution of PPI with tau oligomerization.
We proceeded to explore the oTau PPI network using mCherry co-immunoprecipitations (co-IP) experiments after 0, 20 or 60 min of light exposure (Fig. 2A). Label-free-quantitative protein intensities were normalized to the corresponding mCherry::Cry2 intensity in each sample (N=3/condition).
Figure 2. Proteomic profiling revealed the evolution of protein-protein interactions in the process of tau oligomerization.

(A) Experimental design. Each condition was performed in triplicate. (B) Volcano plot showing the relative abundance of increased and decreased proteins that were bound to 4R1N Tau::Cry2 chimeras at 20min or 60min of light exposure in comparison to no light control group. Proteins significantly increased or decreased more than 3-fold (p≤ 0.05 and absolute log2 FC ≥1.58) are shown in red, whereas those exhibiting significant change but less than 3-fold (p≤ 0.05 but absolute log2 FC < 1.58) are shown in blue. Proteins showing variable changes > 3-fold are marked as green while those without significant change are marked as gray. (C) Venn diagram and gene enrichment of unique proteins binding to oTau-c at 20 and or 60 min. (D) The functional analysis of proteins that exhibit significantly enriched binding to oTau-c at early (20 mins) and late (60 mins) stages of oligomerization. (E) STRING network analysis of proteins that have significantly enriched binding to the complex of oTau-c at 20min and 60mins of light exposure. Proteins were filtered by p<0.05 and absolute log2FC≥1.58 (more than 3-fold change). Only interactions with a STRING score ≥ 0.8 are shown. Evidence of interaction is represented by the distance between nodes, with more tightly packed nodes having a higher STRING score. Proteins that did not display interactions are not shown. Node color are linearly related to fold-change.
Volcano plots characterizing the tau oligomer PPI network at 20 min vs. no light (Fig. 2B, left panel), 60 min vs. no light (Fig. 2B, right panel) and 60 min vs. 20 min (Suppl. Fig. 4) identify proteins that selectively bind oTau. The ALS-associated Heterogeneous Nuclear Ribonucleoprotein A2/B1 (HNRNPA2B1) stands out as a major interactor with oTau-c at both 20 and 60 min, identifying a key RBP binding partner for tau (Supplemental Table 1) (Kim et al., 2013a). VCP, another ALS-linked protein, that is known to mediate tau removal, showed up as the 3rd ranked oTau-c binding protein at 20 min (Johnson et al., 2010; Kim et al., 2013b; McEwan et al., 2017). The nuclear envelope proteins Lamin A, B1 and B2 also bind selectively to oTau at both 20 and 60 min, but the Lamin B receptor (LBR) stands out because it shows increased binding at 60 min compared to 20 min. This suggests that oTau might play a key role contributing to the nuclear envelope disassembly that occurs during the toxic phase of tau oligomerization.
A Venn diagram was created to characterize the composition of the tau binding protein networks at each time point (Fig. 2C). Tau oligomerization at 20 min shows enriched interactions with RBPs (Fig. 2C), while tau oligomerization for 60 min shows GO annotation groups for programmed cell death and signaling by receptor tyrosine kinases (Fig. 2D) (Szklarczyk et al., 2019). Analysis of the PPI network using the STRING database showed enrichment for ribosome and RNA metabolism at 20 min and nuclear envelope components (LBR, LMNA, LMNB1, LMNB2, Nup93 and Nup133) at 60 min (Fig. 2C, E). This shift occurs in parallel with dysfunction of the nuclear envelope and concomitant binding of multiple nuclear proteins including PCNA, POLR2A, TOP2B, HIST1H2B and HIST1H1D (Fig. 2B, E and Suppl. Fig. 4C, D and Suppl. Table 2), many of which function in pathways associated with lamin and LBR action (Frost et al., 2016; Maraldi, 2018).
Comparing tau PPI networks among multiple studies identifies tau binding proteins that show up most consistently (Evans et al., 2019; Maziuk et al., 2018; Wang et al., 2017; Wang et al., 2019). 32 interactors were present in at least 3 of the 5 tau PPI networks, including RBPs such as EWSR1, HNRNPA’s (a0, k, r), EEFs (1a1 and 2), PCBP1 and ribosomal proteins (RPS3, 14, 27a, RPL8) (Suppl. Table 2–3).
Tau oligomerization elicits disruption of the nuclear envelope.
To test for interaction of oTau-c with the nuclear envelope proteins lamins and LBR, Tau::Cry2 was immunoprecipitated (IP’d) with anti-mCherry antibody following 0, 20 or 60 min of light exposure, and the resulting complex analyzed by IB. LaminB2 and LBR were selectively and strongly increased at the 60 min time point (Suppl. Fig. 5A–C). Immunocytochemical labeling of LaminB2, demonstrated major redistribution beginning as early as 10 min after light exposure (Suppl. Fig. 5D, E).
Biochemical studies showed that the redistributed LaminB2 became insoluble. Total cell lysates from light-exposed Tau::Cry2 and mCherry::Cry2 transduced neurons were fractionated by ultracentrifugation to generate soluble and insoluble fractions, and levels of LaminB2 in the fractions were measured by dot blot (Suppl. Fig. 5F, G) (Vanderweyde et al., 2016). Inducing oTau-c produced increased LaminB2 and TIA1 insolubility in Tau::Cry2 vs. mCherry::Cry2 groups (Suppl. Fig. 5F, G).
Disruption of the nuclear envelope was also readily apparent in the PS19 P301S mice (Suppl. Fig. 5H–K). LaminB2 was IP’d and immunoblotted with TOC1 antibody (Suppl. Fig. 5H, I). The binding of oTau to LaminB2 was increased in 6-month PS19 P301S tau mice brain compared to age-matched WT control or 3-month PS19 P301S tau. Altered distribution of LBR was apparent in PS19 P301S mouse brains by 3 months of age (Suppl. Fig. 5J, K). This abnormal LBR distribution was abundant but only partially co-localized with oTau in 6 and 9-month old mice (Suppl. Fig. 5J, K).
HNRNPA2B1 associates with oTau and tau pathology in vitro and in vivo.
The PPIs were validated for oTau-c and native oTau. Tau::mCherry::Cry2Olig was IP’d with anti-mCherry antibody from transduced cortical neurons following 0, 20 or 60 min of exposure to 488λ light. The resulting complexes were successfully IB’d with antibodies to HNRNPA2B1, Heterogeneous Nuclear Ribonucleoprotein H (HNRNPH) and Eukaryotic Translation Initiation Factor 3 Subunit L (EIF3l) (Fig. 3A–D). Endogenous oTau exhibited binding patterns similar to oTau-c. HNRNPA2B1, HNRPH and Eif3l were successfully IP’d from 3- and 6-month PS19/P301S tau mice brain tissue and IB’d with TOC1 antibody to detect levels of oTau (Suppl. Fig. 6A–F).
Figure 3. Tau oligomerization elicits striking change in HNRNPA2B1 localization.

(A) Validation of the mCherry IP samples by IB, including HNRNPA2B1, HNRNPH and Eif3l. (B, C and D) Quantification of the HNRNPH, HNRNPA2B1 and Eif3l band intensities. The integrated intensity of each RBP band was normalized to the band intensity in the corresponding mCherry labeling and then compared to the control group with no light exposure. N=3. (E) Translocation and co-localization of HNRNPA2B1 with tau oligomers at 0, 5, 10, 20, 40, and 60 mins of light exposure. Scale bar, 10μm. (F) Quantification of tau-HNRNPA2B1 co-localization by the ratio of yellow to total green. N=5. (G) Quantification of cytoplasmic granular HNRNPA2B1 intensity. N=5. (H) Images showing the translocation and co-localization of HNRNPA2B1 (green) with tau oligomers (TOMA2, red) in the lateral entorhinal cortex (LEnt) of PS19 P301S tau transgenic mice at age of 3-month, 6-month and 9-month. Scale bar, 5μm. (I) Quantification for the accumulation of tau oligomers in PS19 P301S mice compared to age-matched WT control by the total fluorescence of TOMA2 labeling. N=5. (J) Quantification for the co-localization of HNRNPA2B1 with tau oligomers by the co-efficiency Pearson’s R value of green (HNRNPA2B1) to red (TOMA2). N=5. (K) Proximity ligation assay (PLA) show the co-localization of HNRNPA2B1 and tau aggregates in 9-month aged PS19 P301S mouse brain in comparison to WT control. HNRNPA2B1 was probed using a rabbit antibody and tau aggregates were probed with the mouse Tau 13 antibody. The λex 554 nm; λem 576 nm (Cyanine 3; Zeiss Filter set 20) fluorescence activity reflects the co-localization of protein molecules within 40nm. Scale bar 10μm. (L) Quantification of the PLA assay as shown in (K). The data were collected based on the total orange fluorescence intensity and normalized to the fold-change of WT control group. Error bars = SEM. Two-way ANOVA with Tukey’s multiple comparisons test or two-tailed Welch’s t-test, *or #p<0.05, **p<0.01. ****p<0.001.
Tau oligomerization elicits cytoplasmic translocation of HNRNPA2B1
Tau::Cry2 or mCherry::Cry2 expressed in cultured cortical mouse neurons were exposed to light for up to 60 min, fixed and labeled with anti-HNRNPA2B1 antibody (Fig. 3E–G). Tau oligomerization elicited nuclear-cytoplasmic translocation of HNRNPA2B1 that progressively colocalized with tau (Fig. 3E–G). Induction of oTau-c also elicited TIA1 nucleo-cytoplasmic translocation within 5 min of illumination (Suppl. Fig. 7A, B). Cytoplasmic TIA1 was initially diffuse but became granular by 60 min. Co-localization of Tau::Cry2 with the SG markers PABP and eIF3η was evident after 20 min of light exposure (Suppl. Fig. 7C–F).
Co-localization between HNRNPA2B1 and oTau was observed in vivo by immunofluorescence (Fig. 3H–J, Suppl. Fig. 7G, H) or proximity ligation assay (PLA, Fig. 3K, L). (Note that pathology of TIA1 and many RBPs including HNRNPA2B1 require fixation of ≤ 2 hrs for robust detection (Maziuk et al., 2018).) HNRNPA2B1 showed notable cytoplasmic translocation at 6 and 9 months in PS19 P301S mice, and co-localized strongly with oTau at 6 and 9 months (Fig. 3H–L, Suppl. Fig. 7G, H). Indeed, HNRNPA2B1 co-localized better with tau pathology in this model than any other RBP studied previously (Apicco et al., 2018; Maziuk et al., 2018).
Phosphorylation of tau enhances binding to HNRNPA2B1 via accelerated oligomerization
In order to elucidate the mechanism of interaction, we prepared recombinant human proteins and compared the binding of tau or phosphorylated tau (4R1N, pTau) to HNRNPA2B1 (Liu et al., 2020b). The kinetics of Thioflavin S+ fibril formation using only RNA (200 ng/μl) was more robust for pTau than tau (Suppl. Fig. 8A). TOMA2 ELISAs showed that oTau formation was more robust for pTau than tau (Suppl. Fig. 8B). Interestingly, HNRNPA2B1 enhanced oligomerization of tau but not pTau; similar stimulation of oligomerization is also observed with TIA1 (Apicco et al., 2018; Ash et al., 2021). Next, we compared the effects of phosphorylation and aggregation on binding of tau or pTau to HNRNPA2B1. Tau or pTau (5 μM) were pre-incubated ± RNA (200 ng/μl) at 37aC for 2 or 18 hrs, then mixed with equimolar HNRNPA2B1 for 2 hrs. The complex was then IP’d with Tau13 and then probed by IB for HNRNPA2B1. Tau and pTau both pulled down HNRNPA2B1 to similar extents, but with different kinetics (Suppl. Fig. 8C). HNRNPA2B1 associated with pTau better at 2 hrs than 18 hrs, but associated with tau better at 18 hrs than 2 hrs (Suppl. Fig. 8C). These data suggest that pTau enhances interactions with HNRNPA2B1 by stimulating tau oligomerization.
To identify tau domains needed to bind HNRNPA2B1, tau constructs corresponding to the amino domains (aa 9-155 and 1 - 224), the microtubule binding domain (MTBD, aa 244-372) and the carboxy domain (aa 344 – 441) were incubated with HNRNPA2B1, IP’d by anti-HNRNPA2B1 antibodies and IB’d for tau13 or tauC4 antibodies (for N-terminal or C-terminal tau domains respectively). Only the tau MTBD associated with HNRNPA2B1 (Suppl. Fig. 8D).
HNRNPA2B1 links oTau with cytoplasmic m6A in cultured neurons and in PS19 P301S tau mice.
HNRNPA2B1 has been shown to act as a reader of m6A in the nucleus where it regulates transcription, but its function in the cytoplasm is unknown (Alarcon et al., 2015). We hypothesized that HNRNPA2B1 might also function in the cytoplasm as a m6A reader and explored whether oTau-c might co-localize with m6A. Cortical neurons were transduced with Tau::Cry2 or mCherry::Cry2 and then exposed to light for 0, 20 or 60 min (Suppl. Fig. 9A). The neurons were then labeled with antibodies to m6A and HNRNPA2B1. Light exposure induced formation of cytoplasmic puncta containing oTau-c (Suppl. Fig. 9A, top row). Increasing duration of light exposure induced an increase in the association of oTau-c puncta with m6A puncta of about 40% (Suppl. Fig. 9A, B).
We proceeded to investigate whether oTau and HNRNPA2B1 co-localize with m6A in P301S tau mice and human AD tissues. Lateral entorhinal cortex (LEnt) from 3-, 6- and 9-month P301S mice or wild type (WT) littermate controls were labeled with antibodies to m6A and HNRNPA2B1 and examined by PLA or immunohistochemistry (Fig. 4A–E, Suppl. Fig. 9C, D). Cytoplasmic m6A and HNRNPA2B1 immuno-reactivities steadily increased in the P301S tau mice from 3-9 months, with robust co-localization at 6- and 9-months (Fig. 4A–B, Suppl. Fig. 9C, D). For the WT mice, m6A and HNRNPA2B1 reactivity was restricted to the nucleus at 3- and 6-months, while at 9-month some cytoplasmic m6A reactivity was apparent (Fig. 4A–B, Suppl. Fig. 9D). Cytoplasmic co-localization of m6A and HNRNPA2B1in 9-month old P301S tau mice was validated by PLA analysis (Fig. 4D–E).
Figure 4. m6A co-localizes with HNRNPA2B1 and oligomeric tau in P301S tau transgenic mice brain.

(A) Co-localization of HNRNPA2B1 (green) and m6A (red) in the lateral entorhinal cortex (LEnt) of PS19 P301S tau transgenic mice at age of 6-month and 9-month, respectively. Scale bar, 20<m. (B, C) Quantification of the increase of m6A and HNRNPA2B1 in PS19 P301S mice compared to age-matched WT control based upon the total fluorescence of m6A labeling. N=5. (D) Proximity ligation assay (PLA) show the co-localization of HNRNPA2B1 protein with m6A transcripts in 9-month aged PS19 P301S mouse brain in comparison to WT control. HNRNPA2B1 was probed with rabbit antibody and m6A transcripts were probed with mouse anti-m6A antibody. Orange fluorescence intensity reflects the co-localization of HNRNPA2B1 and m6A transcripts within 40nm. Scale bar 10μm. (E) Quantification of the PLA assay as shown in (D). The data were collected with the total orange fluorescence intensity and normalized to the fold-change of WT control group. N=5. (F) Translocation and co-localization of m6A (red) with oTau (labeled by TOMA2 antibody, green) in the lateral entorhinal cortex (LEnt) of PS19 P301S tau transgenic mice at age of 6-month and 9-month, respectively. Scale bar, 20<m. (G) Quantification of the co-localization of TOMA2 with m6A based upon the raw co-localized pixels. N=5. (H) Quantification for the percentage of m6A co-localized to tau oligomers by the co-efficiency Pearson’s R value of red (m6A) to green (TOMA2). N=5. (I) PLA assay showed the co-localization of m6A transcripts with tau aggregates in 9-month aged PS19 P301S mouse brain in comparison to WT control. Tau aggregates were probed with a mouse antibody and m6A transcripts were probed with a rabbit anti-m6A antibody. Orange fluorescence intensity reflects the co-localization of m6A transcripts and tau aggregates within 40nm. Scale bar 10μm. (J) Quantification of the PLA assay as shown in (D). The data were collected based on the total orange fluorescence intensity and normalized to the fold-change of WT control group. N=5 (K) Immunoprecipitation of m6A from 6-month PS19 P301S brain cortex lysate. IgG antibody was used to exclude the non-specific binding. The amount of HNRNPA2B1 and tau bound to m6A was detected by immunoblot. RNase A or FTO groups were used to deplete the m6A in the lysate to confirm the specific binding of HNRNPA2B1 and tau to m6A. (L-M) Quantification of HNRNPA2B1 and tau band intensity as shown in (K). N=3. (N-O) The quantity of m6A from Tau13 or HNRNPA2B1 immuno-precipitation samples were measure by ELISA. Data were collected from 5 mice brain in each group. Error bars = SEM. Two-way ANOVA with Tukey’s multiple comparisons test was used, Error bars = SEM. Two-way ANOVA with Tukey’s multiple comparisons test or two-tailed Welch’s t-test, **p<0.01, ***p< 0.005, ****p<0.001.
The response of oTau paralleled the observations for m6A and HNRNPA2B1, with 6- and 9-month P301S tau mice exhibiting progressively more oTau reactivity and co-localization of m6A with oTau (Fig. 4F–H, Suppl. Fig. 9F, G). PLA analysis again demonstrated robust reactivity for m6A and TOMA2 interactions in the 9-month old P301S tau mice, but only very little reactivity in 9-month old WT mice (Fig. 4I, J).
Next we pretreated lysates from 9-month P301S mice with FTO (an RNA demethylase that removes m6A modification) or RNAse (to digest RNA), then IP’d with anti-m6A antibody and IB’d with antibodies to HNRNPA2B1 or tau. Treatment with FTO or RNAse reduced the amount of HNRNPA2B1 or tau pulled down, validating the specificity of both interactions as well as the anti-m6A antibody (Fig. 4K–M). The amount of m6A associated with IP’d HNRNPA2B1 or tau in 9-month P301S tau or WT mice was quantified by m6A ELISA. The results demonstrated robust amounts of m6A associated with tau and HNRNPA2B1 in 9-month P301S Tau mice but not in WT mice nor in IP’s performed with control IgG antibody (Fig. 4N, O).
HNRNPA2B1 links oTau with cytoplasmic m6A in human AD cases.
Next, we examined human temporal cortex tissues (Brodmann 41/42) from age-matched AD and Normal Control cases (80 AD/10 Ctl), ranging from Braak stages I - VI. The m6A reactivity showed a striking shift in abundance and distribution with increasing disease severity, being predominantly nuclear in control cases (Braak I) but spreading into the cytoplasm in early-stage AD cases (Braak II/III) (Fig. 5A, C, D). Late-stage AD cases showed largely cytoplasmic m6A reactivity (Fig. 5A, C, D). The plot intensity profiles showed a correspondence between peak intensities for m6A (green) and oTau (TOMA2) or HNRNPA2B1 (magenta) for Braak stages III-IV (Fig. 5A). Quantification by m6A immunofluorescence showed an increase in total m6A reactivity in AD vs. control cases of greater than 2.5-fold (Fig. 5C). Analysis of oTau (TOMA2) and HNRNPA2B1 in the same sections showed strongest co-localization of the tau, HNRNPA2B1 and m6A at Braak II – IV (Fig. 5A–G). The cytoplasmic distribution of m6A in severe AD cases was much broader than for oTau or HNRNPA2B1, suggesting that m6A began to exhibit actions unrelated to these two proteins in late-stage disease.
Figure 5. m6A co-localizes with oligomeric tau in post-mortem human AD brain tissue.

(A) Accumulation and co-localization of m6A (green) and cytosolic HNRNPA2B1 (magenta) with tau oligomers (red, labeled with the TOMA2 antibody) in post-mortem human AD brain cortical tissue in comparison to different Braak stages. The Plot Profile provides a spatially resolved graph indicating the fluorescence intensity for each channel. Scale bar, 20<m. (B-D) Quantification of oTau accumulation in post-mortem human AD brain tissue of each different Braak stages based on the total fluorescence intensity of TOMA2 labeling (B). Quantification for the increase of m6A in post-mortem human AD brain temporal tissue by the total fluorescence intensity of labeling (C). Quantification of HNRNPA2B1 accumulated in the cytosol in which nucleus fraction was subtracted by using DAPI as mask (D). Data were collected from 3 cases of each stage and 5 images of each case. (E-G) The co-localization of TOMA2, HNRNPA2B1 and m6A were quantified and analyzed by the total over-lapping intensity as shown in (A). Data were collected from 3 cases of each stage and 5 images of each case. (H) Immunoprecipitation of HNRNPA2B1 from post-mortem human AD brain tissues or age-matched controls. IgG antibody was used to exclude the non-specific binding. The amount of oligomeric tau bound to HNRNPA2B1 was detected by IB using TOC1 antibody. The amount of pull-down HNRNPA2B1 was also probed by HNRNPA2B1 antibody. Quantification of oligomeric tau bound to HNRNPA2B1. Band intensity of TOC1 was normalized to the HNRNPA2B1 band. N=7 human age-matched control and 7 AD cases. (I) The quantity of m6A from Tau13 IP samples was measured by ELISA. Data were collected using samples of human cortical grey matter from individuals at each Braak stage (4 individuals per stage). Data are shown as mean ± SEM. One-way ANOVA with Tukey’s multiple comparisons test or two-tailed Welch’s t-test were used, **p< 0.01, ***p< 0.005, ****p<0.001.
Next, we sought biochemical evidence of interaction between m6A, HNRNPA2B1 and tau oligomers in human frontal cortex tissues (Brodmann 10) using age-matched AD and Normal Control cases (6 AD/6 Ctl). HNRNPA2B1 was IP’d from AD and Control cortical brain tissue, and IB’d for oTau (with the TOC1 antibody). The amount of oTau associated with HNRNPA2B1 was increased over 2-fold in AD compared to control brain, despite pulling down similar amounts of HNRNPA2B1 from AD and Ctrl tissues (Fig. 5H). The interaction of m6A-RNA with tau complexes was interrogated in AD and Control tissue by UV crosslinking RNA to associated proteins, then IP of tau and quantification of m6A by ELISA. The results demonstrated that total m6A increased >4-fold in a stage dependent manner, while the amount of m6A associated with tau and HNRNPA2B1 increased ~6-fold in middle to late stages of AD (Fig. 5I).
HNRNPA2B1 is required for the association of tau oligomers with m6A.
The importance of HNRNPA2B1 for the association between oTau and m6A was explored. Neurons expressing Tau::Cry2 or mCherry::Cry2 were subjected to knockdown with siRNA targeting HNRNPA2B1 or a non-targeting control. Knockdown of HNRNPA2B1 was approximately 50% (Fig. 6B, C). Depletion of HNRNPA2B1 elicited a marked ~40% reduction in the association of oTau-c with m6A puncta compared to control knockdown (Fig. 6A, E).
Figure 6. HNRNPA2B1 knockdown reduces oTau-c induced translational stress, DNA damage and association with N6-methyladenosine RNA.

(A) The effects of HNRNPA2B1 knockdown on the association between oTau-c and m6A. Neurons were transduced with Tau::Cry2 (red) plus siRNA directed against HNRNPA2B1 or scrambled control. The neurons were then exposed to 488 nm light for 0, 20 or 60 min, fixed and labeled for HNRNPA2B1 (purple), m6A (green) or DAPI (blue). Scale bar 10 μm. (B, C) Quantification of siRNA mediated knockdown of HNRNPA2B1. B: IB of lysates run on a 12% reducing gel and probed with anti-HNRNPA2B1 antibody and actin antibody as the internal control. C: N=5. (D) Quantification of the colocalization between oTau-c and m6A. Image analysis shows that HNRNPA2B1 knockdown elicited a strong reduction in the fraction of oTau-c colocalized with m6A, which is apparent in the reduction of yellow pixels evident visually or by scatterplot (bottom row). (E) Quantitative imaging demonstrates that HNRNPA2B1 knockdown produced a statistically significant reduction in nuclear m6A puncta after 60 min of light exposure. (F) IB of puromycin showing the newly synthesized proteins in conditions with siRNA towards HNRNPA2B1 or scrambled control in conditions with no light or 30min light. (G) Quantification of puromycin band intensities, which were internalized by GAPDH band intensity before being normalized to the control group without light or HNRNPA2B1 knockdown. N=4. (H) TUNEL labeling show that 60mins of continuous tau oligomerization induced DNA damage that can be ameliorated by HNRNPA2B1 knockdown. Red shows the mCherry::Cry2Olig or 4R1N Tau::mCherry::Cry2Olig positively transfected neurons. Green represents the TUNEL signaling in the nucleus and DAPI was used for the labeling of nucleus. Scale bar 50μm. (I) Quantification of TUNEL labeling intensity. (J) Cleaved caspase3 labeling show that HNRNPA2B1 knockdown abrogates toxicity induced by extended light exposure in Tau::Cry2 neurons. Red shows the mCherry::Cry2Olig or 4R1N Tau::mCherry::Cry2Olig positively transfected neurons. Green represents cleaved caspase 3 reactivity, and DAPI labels nuclei. Scale bar 20<m. (K) Quantification of cleaved caspase 3 labeling intensity. Data were normalized to the fold-change to their compared control group. Data are shown as mean ± SEM. Two-way ANOVA with Tukey’s multiple comparisons test or unpaired T-test with Welch’s correction, two-tailed, *p<0.05, **p<0.01.
Tau oligomerization greatly increased formation of m6A puncta in the nucleus, although no Tau::Cry2 was observed in the nucleus (Fig. 6A). These results are consistent with known associations between m6A and nuclear transcription and chromatin structure (Alarcon et al., 2015; Chen et al., 2019; Liu et al., 2020a). Such changes might be expected, since tau pathology is known to induce changes in DNA function and structure (Cornelison et al., 2019; Frost et al., 2016; Sun et al., 2018). Surprisingly, knockdown of HNRNPA2B1 elicited a dramatic loss of nuclear oTau-c-induced m6A reactivity, suggesting a link between HNRPA2B1 and the nuclear stress response (Fig. 6A, D).
Next we tested whether HNRNPA2B1 is required for the regulation of stress granules and translation by oTau-c. We hypothesized that the changes in association of oTau-c with m6A might be reflected by changes in translation, because both oTau and m6A are known to regulate RNA translation (Anders et al., 2018; Chen et al., 2019). Neurons expressing Tau::Cry2 and siRNA for HNRNPA2B1 or control were exposed to light for 20 min, fixed and analyzed by immunocytochemistry. HNRNPA2B1 knockdown robustly reduced formation of stress granules containing PABP or eIF3η (Suppl. Fig. 10A, B). Repeating the experiment in the presence of puromycin showed that knockdown of HNRNPA2B1 partially rescued protein synthesis (Fig. 6F, G).
HNRNPA2B1 is required for tau-mediated neurodegeneration in vitro.
Knockdown of HNRNPA2B1 was also used to test whether it participates in toxicity caused by oTau-c. DNA cleavage and caspase activity are well-documented readouts of apoptosis. Neurons expressing Tau::Cry2 were transduced with siRNA for HNRNPA2B1 or control, exposed to 488λ light for 60 min, fixed and analyzed by the Terminal deoxynucleotidyl transferase dUTP nick end labeling (TUNEL) assay. Light-induced oTau-c increased TUNEL reactivity in neurons, while HNRNPA2B1 knockdown reduced the amount of TUNEL reactivity (Fig. 6H, I). We also tested the effects of HNRNPA2B1 knockdown in an assay reflecting chronic conditions. Neurons expressing Tau::Cry2 treated with siRNA for HNRNPA2B1 or control were treated with light for 20 min per day for 3 days. Knocking down HNRNPA2B1 reduced the amount of cleaved caspase 3 reactivity in the light exposed Tau::Cry2 neurons (Fig. 6J, K). These results demonstrate a strong role for HNRNPA2B1 in the neurotoxicity elicited by oTau-c.
Knockdown of METTL3, which methylates adenosines at the N6 position, also inhibited the HNRNPA2B1/m6A complex. Cultures of cortical neurons were transduced with lentivirus expressing METTL3 or control shRNA for 3 days. Next they were transduced with Tau::Cry2 and after a further 72hours, they were exposed to 488 nm light for 60 min, fixed, and analyzed by immunocytochemistry. Knockdown of METTL3 strongly reduced levels of m6A and prevented the accumulation of both cytoplasmic m6A and HNRNPA2B1 in response to tau oligomerization (Suppl. Fig. 10C).
HNRNPA2B1 is required for tau-mediated neurodegeneration in vivo.
The CA1 hippocampal regions of 3-month old P301S tau mice (N=6 per cohort) were injected with lentivirus coding for the HNRNPA2B1 shRNA on the ipsilateral side and scrambled control on the contralateral side (Fig. 7A). Two weeks (day 15) later the same mice were injected with oTau or vehicle, using oTau generated from P301S tau mice as described previously (Fig. 7A) (Jiang et al., 2019). Three weeks later (day 36) the mice were sacrificed and tau pathology was examined, focusing on the CA3 region (Fig. 7A). Mice injected with oTau (but not vehicle) exhibited robust pathologies for oTau, HNRNPA2B1 and m6A (Fig. 7B–E). Mice injected with AAV9 HNRNPA2B1 shRNA (but not control shRNA) exhibited robust knockdown of HNRNPA2B1 (Fig. 7B, C). Importantly, knockdown of HNRNPA2B1 elicited statistically significant reductions in labeling for oTau, m6A and cleaved caspase 3 (Fig. 7F, G).
Figure 7. HNRNPA2B1 is required for tau-mediated neurodegeneration in vivo.

(A) The design for the in vivo experiments. (B) The accumulation and co-localization of oligomeric tau (by TOMA2 antibody, red), m6A (magenta) and HNRNPA2B1 (grey) in the experimental mice brain of CA3 brain region. The efficiency of lentivirus transduction are shown by the GFP-tag (green) co-expressed in the viral construct. Scale bar 50μm, (C-E) Quantification of the HNRNPA2B1, TOMA2 and m6A fluorescence intensity in the CA3, respectively. N=5 Data are shown as mean ± SEM. Two-way ANOVA with Tukey’s multiple comparisons test was used, *p<0.05, ***p<0.005, ****p<0.001. (F) Cell apoptosis by cleaved caspase 3 labelling (magenta) and it’s co-localization to oligomeric tau (by TOMA2 antibody, red) and HNRNPA2B1 (grey) in the experimental mice brain of CA3 brain region. The efficiency of lentivirus transduction is shown by the GFP-tag (green). Scale bar 50μm. (G) Quantification of fluorescence cleaved caspase 3 intensity in the CA3, respectively. N=5 Data are shown as mean ± SEM. Two-way ANOVA with Tukey’s multiple comparisons test was used, *p<0.05, ***p<0.005.
DISCUSSION
Stress induces tau oligomerization and phosphorylation. oTau is known to be toxic, but the molecular targets of oTau are unknown. Studies of the role of tau in the stress response have been hampered by the pleiotropic nature of the stress response, which confounds many experimental designs. We now present a Tau::Cry2 system, in which the selective response of neurons to oligomers of tau (oTau-c) are investigated. Using the Tau::Cry2 system, we identified a molecular complex containing tau, HNRNPA2B1 and m6A modified RNA. This complex is evident in cultured neurons, the P301S tau mouse model and in human AD brains. We show that interaction of HNRNPA2B1 with tau contributes to neurodegeneration mediated by oTau in vivo, using P301S tau mice, and in primary cultures of cortical neurons. Importantly, we also show that levels of m6A are strongly increased in P301S tau mice and in human AD cases. Finally, we show that reducing m6A, by knocking down the m6A writer, METTL3, prevents the ability of oTau-c to induce cytoplasmic translocation of HNRNPA2B1 and neurodegeneration.
HNRNPA2B1 is known to act as a reader of m6A in the nucleus, where it regulates chromatin state and transcription (Anders et al., 2018; Arguello et al., 2017; Chen et al., 2019). Our evidence suggests that HNRNPA2B1 also functions as a m6A reader in the cytoplasm, allowing oTau to interact with m6A transcripts. These actions appear to revolve around SGs and the translational stress response. We show that tau oligomerization, perhaps in conjunction with tau phosphorylation, induces a translational stress response and that oTau associates with SGs during this response; these SGs include numerous classical markers such as eIF3η, TIA1 and PABP, and also include HNRNPA2B1. In addition to inhibiting translation via the SG response, accumulating data also points to direct interactions between tau and the ribosome as a mechanism for translational inhibition (Evans et al., 2019; Koren et al., 2019; Meier et al., 2016). A prior study shows that m6A also associates with SGs (Anders et al., 2018). Our studies bring all of these localization studies together by showing that oTau and HNRNPA2B1 both co-localize with cytoplasmic m6A granules, and that HNRNPA2B1 is required for colocalization of oTau with m6A. The association of this complex with m6A appears to contrast with those SG complexes containing G3BP1 or 2, CAPRIN1 and USP10, which are repelled by RNA containing m6A (Edupuganti et al., 2017); these contrasting responses to m6A highlights potential heterogeneity among SGs and suggest a reason why G3BP1 is absent from the oTau proteome and why oTau does not colocalize with G3BP1 or 2 (Maziuk et al., 2018; Vanderweyde et al., 2012). These data suggest that HNRNPA2B1 acts as a reader that tethers oTau to m6A, and enables a translational stress response mediated by oTau.
The involvement of m6A in tauopathy and AD represents a major finding for the field. The association of m6A with disease is well-studied in the oncology literature, but has been investigated minimally in neurodegeneration (Chen et al., 2019). A prior study noted increased levels of m6A in brains of transgenic mice over-expressing amyloid precursor protein (Han et al., 2020). However, our study is the first to compare m6A levels in human AD vs. control cases, and is also the first study linking the pathophysiology of tau to m6A biology. m6A is one of the most abundant modifications of RNA (Tong et al., 2018). Under basal conditions m6A is mostly confined to the nucleus, where it regulates the turnover of newly synthesized RNA (Liu et al., 2020a; Tong et al., 2018). With stress, m6A translocates into the cytoplasm, where it enhances liquid-liquid phase separation and associates with SGs (Anders et al., 2018; Ries et al., 2019). Our observations now bring m6A into the context of neurodegenerative disease. m6A showed a striking accumulation in the cytoplasm upon induction of oTau-c. Similar cytoplasmic accumulation of m6A was evident in vivo in P301S tau mice as well as in AD-affected human brain. The changes in m6A abundance are particularly striking, showing a 2.5-5-fold increases in disease tissues. The magnitude of this change raises the possibility that increases in m6A extend beyond mRNA to also include other RNA species, such as rRNA and tRNA, both of which are known to contain m6A modifications. It is also possible that HNRNPA2B1 binds to transcripts lacking m6A, and that oTau binds to other m6A labeled transcripts independently of HNRNPA2B1.
Analysis of the oTau PPI network reveals that oTau binds to many RBPs, with RNA metabolism comprising 2 of the top 4 GO annotations. The prominence of HNRNPA2B1 in the oTau PPI network is notable because HNRNPA2B1 is genetically linked to neurodegenerative diseases. Mutations in HNRNPA2B1 cause familial ALS, multisystem proteinopathy and Paget’s disease (Kim et al., 2013a; Qi et al., 2017). Expression or mislocalization of HNRNPA2B1 is also prominent in ALS, muscular diseases and cancers (Martinez et al., 2016) (Kataoka et al., 2015; Pinkus et al., 2014). Our studies suggest a role for the oTau/HNRNPA2B1/m6A complex in the molecular neuropathology of tauopathies. We observe a disease-dependent increase in the amount of cytoplasmic m6A and HNRNPA2B1 in mouse and human tauopathy, and this complex also co-localizes with oTau. These observations are supported by proteomic studies of neurodegenerative diseases where HNRNPs appear prominently, as well as a recent study showing increases in m6A in the brains of AD cases (Han et al., 2020; Johnson et al., 2020; Johnson et al., 2018; Umoh et al., 2018). These multiple intersecting lines of evidence suggest that HNRNPA2B1 contributes to the pathophysiology of tauopathies by enabling oTau to control the utilization of m6A modified transcripts.
PPI network analysis shows that oTau interacts with multiple proteins that are genetically linked to AD and related disorders. These proteins include CLU (clusterin, ApoJ), which links to the LDL receptor related protein (Lrp1) and APOE in the oTau PPI network (Figure 2E). Lrp1 binds both APOE and CLU, mediates tau propagation and all three genes are risk factors for AD (Farrer et al., 1997; Harold et al., 2009; Lauren et al., 2009; Rauch et al., 2020; Wijsman et al., 2011; Zhou et al., 2014). The putative interaction of CLU with tau is further supported by prior reports showing that CLU binds tau and protects against tau mediated degeneration (Gregory et al., 2017; Zhou et al., 2014). CELF2 (CUGP2) and PICALM are also risk factors for AD that are members of the oTau PPI network (Harold et al., 2009; Wijsman et al., 2011); PICALM has been shown to regulate tau accumulation (Moreau et al., 2014).
Our observations support a role for nuclear envelope dysfunction in the pathophysiology of AD and ALS (Eftekharzadeh et al., 2018)’(Zhang et al., 2018; Zhang et al., 2015). Persistent accumulation of oTau is associated with striking redistribution of Lamin B away from nuclear envelope. Additional dysfunction could arise from excessive nuclear cytoplasmic transport, as RBPs translocate to the cytoplasm.
Many other biochemical characteristics of oTau-c share features in common with oTau. Both oTau and oTau-c are recognized with antibodies (TOC1 and TOMA2) directed against native oTau. As with oTau, prolonged oligomerization causes oTau-c to progress from a reversible to an irreversible oligomer that shows reduced solubility. Both oTau and oTau-c are neurotoxic (Jiang et al., 2019; Lasagna-Reeves et al., 2011). Finally, the proteins observed to associate with oTau-c also associate with native tau in cultured neurons, P301S tau mice and human AD brain cases.
One question that remains with our study is the relative importance of oligomerization versus tau phosphorylation. We compared native tau to pTau, where pTau was generated using the PIMAX system in which recombinant tau is phosphorylated by GSK3β, a proline directed stress kinase (Liu et al., 2020b). Both tau and pTau associate with HNRNPA2B1, however pTau binds better to HNRNPA2B1 at shorter preincubation periods, while tau binds better at longer preincubation periods (Guzman-Martinez et al., 2013; Liu et al., 2020b; Scheltens et al., 2016). These results suggest that tau oligomerization is key to HNRNPA2B1 binding, but phosphorylation accelerates formation of the oligomeric species.
In conclusion, our work suggests that tau oligomerization and phosphorylation occur as part of a normal physiological response to stress. oTau associates with m6A modified mRNA through binding to HNRNPA2B1, a reader of m6A modified transcripts. The oTau/HNRNPA2B1/m6A complex regulates the RNA translational stress response and promotes SG formation. This complex is increased in AD. Persistent accumulation of oTau leads to formation of insoluble complexes and toxicity, but the toxicity can be partially reversed by knockdown of HNRNPA2B1, which inhibits the association of oTau with m6A transcripts and dampens the stress response. Thus, this work presents a model that demonstrates how oTau functions in the stress response, presents potential mechanisms of neurotoxicity and suggest putative targets for pharmacotherapy of tauopathies.
LIMITATIONS OF THE STUDY
The mCherry::Cry2 domains could impact on the biochemistry by creating steric hinderance, by altering the conformation adopted by tau oligomers or by exhibiting off-target binding. We have controlled for binding interactions by demonstrating that the key findings from this study are replicated in studies examining protein and RNA interactions with endogenous tau in vivo and in human brain. However, the PPI network contains many components that are not validated. The mCherry::Cry2 domains could also exert steric impact on tau conformations, which means that structural studies using the Tau::mCherry::Cry2 chimera should be pursued with caution.
STAR METHODS
RESOURCE AVAILABILITY
Lead contact
Further information and requests for resources should be directed to and will be fulfilled by the Lead Contact, Benjamin Wolozin (bwolozin@bu.edu).
Materials availability
Plasmids generated in this study are available upon request. This study did not generate new unique reagents. KEY RESOURCES TABLE is in the supplemental material.
KEY RESOURCES TABLE
| REAGENT or RESOURCE | SOURCE | IDENTIFIER |
|---|---|---|
| Antibodies | ||
| Chicken polyclonal anti-MAP2, for ICC 1:250 | Aves Labs | Cat# MAP, RRID:AB_2313549 |
| Mouse monoclonal anti-Tau13, for IB 1:1000 | provided by Peter Davies (Northwell) | N/A |
| Rabbit polyclonal anti-TIA1, for ICC 1:300, for IB 1:800 | Abcam | Cat# ab40693, RRID:AB_2201438 |
| Goat polyclonal anti-mCherry, for ICC 1:300, for IB 1:500 | MyBioSource | Cat# MBS448057 |
| Mouse monoclonal anti-TOC1, for IB 1:500 | provided by Nicholas Kanaan | N/A |
| Rabbit monoclonal anti-Lamin B2, for ICC 1:500, for IB 1:1000 | Abcam | Cat# ab151735 |
| Mouse monoclonal anti-Puromycin, clone 12D10, for IB 1:1000, for ICC 1: 500 | Millipore Sigma | Cat# MABE343, RRID:AB_2566826 |
| Rabbit monoclonal anti-EIF2α, for IB 1:500 | Cell Signaling Technology | Cat# 5324, RRID:AB_10692650 |
| Rabbit monoclonal phospho-eIF2α (Ser51) (119A11), for IB 1:500 | Cell Signaling Technology | Cat# 3597, RRID: AB_390740 |
| Rabbit monoclonal anti-Cleaved Caspase 3 (Asp175) (5A1E), for ICC 1:400 | Cell Signaling Technology | Cat# 9664, RRID:AB_2070042 |
| Rabbit Polyclonal anti-eIF3l, for IB 1:500 | Thermo Fisher Scientific, Invitrogen | Cat# PA531647, RRID:AB_2549120 |
| Mouse monoclonal anti-TOMA2, for ICC 1:300 | provided by Rakez Kayed | N/A |
| Rabbit Polyclonal anti-hnRNP H, for IB 1:500 | Bethyl Labs | Cat# A300-511A |
| Rabbit Polyclonal anti-PAWR, for IB 1:500 | Thermo Fisher Scientific | Cat# 20688-1-AP, RRID:AB_10733473 |
| Mouse monoclonal phospho-Tau (Thr181) antibody AT270, for ICC 1:400 | Thermo Fisher Scientific | Cat# MN1050, RRID:AB_223651 |
| Mouse monoclonal phospho-Tau (S262) antibody 12E8, for ICC 1:400 | provided by Philip Dolan, Prothena | N/A |
| Rabbit Polyclonal anti-hnRNP A2B1, IHC, 1:300 | Thermo Fisher Scientific | Cat# PA534939, RRID:AB_2552288 |
| Rabbit Polyclonal anti-m6a | Synaptic Systems | Cat# 202 003, RRID:AB_2279214 |
| Rabbit Polyclonal anti-Lbr, IHC, 1:300 | Proteintech | Cat# 12398-1-AP, RRID:AB_2138334 |
| Rabbit Polyclonal anti-TDP43, IHC, 1:300 | Proteintech | Cat# 12892-1-AP, RRID:AB_2200505 |
| Alexa Fluor594 Donkey Anti-Mouse IgG | Jackson ImmunoResearch | Cat#715-585-150, RRID:AB_2340854 |
| Alexa Fluor488 Donkey Anti-Rabbit IgG | Jackson ImmunoResearch | Cat#711-545-152, RRID:AB_2313584 |
| DyLight405 Donkey Anti-Chicken IgG | Jackson ImmunoResearch | Cat#703-475-155, RRID:AB_2340373 |
| Alexa Fluor647 Donkey Anti-Chicken IgG | Jackson ImmunoResearch | Cat#703-605-155, RRID:AB_2340379 |
| RFP-Trap manganese beads | Chromotek | Cat# 20 |
| Bacterial and virus strains | ||
| pHR-mCherry-Cry2 Lentivirus | This paper | N/A |
| pHR-4R1N Tau-mCherry-Cry2 Lentivirus | This paper | N/A |
| NEB Stable Competent E. coli (High Efficiency) | New England Biolabs | Cat# C3040H |
| Biological samples | ||
| Human temporal superior gyrus tissues (Broadman areas 41/42) | provided by Boston medical center and The Mount Sinai Hospital | N/A |
| Human Ctrl/AD brain cortex of each Braak stage | Provided by Emory U. | N/A |
| Chemicals, peptides, and recombinant proteins | ||
| FuGENE HD transfection reagent | Promega | Cat# E2311 |
| Lenti-X™ Concentrator | Takara Bio USA | Cat# 631231 |
| Neurobasal medium | Thermo Fisher Scientific | Cat#21103049 |
| B-27 Supplement (50x), serum free | Life Technologies | Cat#17504-044 |
| DNase I Solution (1 mg/mL) | STEMCELL Technologies | Cat #07900 |
| Critical commercial assays | ||
| LDH kit | Promega | Cat#G1780 |
| RFP-Trap Magnetic Agarose beads IP kit | ChromoTek | Cat# rtma-20 |
| NuPAGE™ 3-8% Tris-Acetate Protein Gels | Invitrogen | Cat# EA03785BOX |
| PLA Duolink™ In Situ Orange Starter Kit Mouse/Rabbit | Millipore Sigma | Cat# DUO92102 |
| EpiQuik m6A RNA Methylation Quantification Kit | Epigentek | Cat# P-9005-96 |
| Deposited data | ||
| Raw Imaging Files | This study, Mendeley Data | http://dx.doi.org/10.17632/p288s6snps.1 |
| mass spectrometry of mcherry IP samples | This paper | Table S1 |
| Experimental models: Cell lines | ||
| HEK-293T cell line | ATCC | Cat# CRL-11268 |
| Tau RD P301S FRET Biosensor line | ATCC | Cat# CRL-3275 |
| Experimental models: Organisms/strains | ||
| C57BL/6 primary cortical neurons | This paper | |
| PS19 P301S tau transgenic mice | Jackson Laboratories | stock# 008169 |
| Oligonucleotides | ||
| Recombinant DNA | ||
| pHR-mCherry-Cry2 plasmid | This paper | N/A |
| pHR-4R1N Tau-mCherry-Cry2 plasmid | This paper | N/A |
| V-SVG helper plasmid | provided by Clifford P. Brangwynne lab | N/A |
| PSP helper plasmid | provided by Clifford P. Brangwynne lab | N/A |
| Software and algorithms | ||
| Graphpad Prism 9 | https://www.graphpad.com/scientific-software/prism/ | Need to purchase license |
| R package limma | Ref. Ritchie et al., 2015 | N/A |
| STRING | https://string-db.org/ | N/A |
| Cytoscape 3.7.2 | https://cytoscape.org/download_old_versions.html | N/A |
| Fiji ImageJ | https://imagej.net/software/fiji/ | N/A |
| Other | ||
| 490λ LED light source | This paper | N/A |
| Black frame plate with high performance #1.5 cover glass | Cellvis | Cat# P24-1.5H-N |
| 35 mm Dish, High Precision 1.5 Coverslip, 14 mm Glass Diameter | MatTek | Cat# P35G-0.170-14-C |
| Optical Power and Energy Meter | Thorlabs | Ref# PM100D |
Data and Code Availability
Proteomics data have been attached as supplemental table-1 to this manuscript. Original western blot and immunofluorescence images have been deposited at Mendeley and are publicly available as of the date of publication. The DOI is listed in the key resources table. Microscopy data reported in this paper will be shared by the lead contact upon request.
This paper does not report original code.
Any additional information required to reanalyze the data reported in this paper is available from the lead contact upon request.
EXPERIMENTAL MODEL AND SUBJECT DETAILS
Animals
Use of all animals was approved by the Boston University Institutional and Animal Care and Use Committee. All animals were housed in IACUC-approved vivaria at Boston University School of Medicine. Timed pregnant C57BL/6 were purchased from Charles River laboratories and delivered at E-14. The tau knockout B6.129X1-Mapttm1Hnd/J mice were purchased from the Jackson laboratory (Stock No:007251) and breeding in-house for the postnatal day 0 pups.
PS19 mice overexpressing human P301S Tau (B6;C3-Tg(Prnp-MAPT*P301S)PS19Vle/J, stock #008169) were purchased from Jackson Laboratories. Male and female PS19 P301S tau+/− mice were used as breeding pairs and the F1 generation of P301S tau+/− (PS19) and P301S tau−/−(wild type) were used for the experiment. Littermates of the same sex were randomly assigned to experimental groups. Mice were sacrificed for experiment at the age of 3, 6 and 9 months old, respectively.
The fixation method of the brain tissue is critical for the successful immuno-labeling of tauopathy and RNA binding proteins in this study. Mice were anaesthetized with Ketamine/xylazine cocktail (Contains: 87.5 mg/kg Ketamine and 12.5 mg/kg Xylazine) at 0.1ml/20g.bw by i.p. injection. The mice were then perfused through the heart with 20ml ice cold PBS at the speed of 4ml/min for 5 mins, followed by perfusion with 20ml ice cold 4% PFA for 10 mins until the mouse tail became curved and stiff (note to change the speed set-up as 2ml/min when running with PFA). The mouse brains were dissected and placed in 4% PFA on ice for 1-2 hrs before they were transferred into PBS and stored at 4°C. To prepare for collecting brain sections, the fixed mice brains were transferred into 30% sucrose/PBS until the brains sank to the bottom of the tube (about 48h), and then sectioned. The fixed brains were sliced into 30μm coronal sections by cryostat, and stored in 0.005% sodium azide/PBS solution at 4°C for up to 3 months. For long-term storage, the sections were transferred into cryoprotectant solution (30% glycerol and 30% ethylene glycol in PBS), and stored at −20 °C.
Human brain samples for immunohistochemistry
Anonymous human brain tissue used in this project was obtained from the Goizuetta Alzheimer’s Disease Center and was collected in accordance with IRB protocols of Emory University. Human temporal superior gyrus tissues (Broadman areas 41/42) were used for the immunohistochemical studies. The samples were de-identified, and are described below. The tissue was fixed in periodate-lysine-paraformaldehyde (PLP) fixative for 2 hours, followed by overnight incubation in 30% sucrose, after which tissue sections were cut at thickness of 30 μm.
All our studies used both sexes, and integrated results by covariate analysis. The human brain tissue for immunofluorescence labelling cohorts are at N=3 per Braak stage.
Fixed human brain samples
| Primary Neuropathologic Diagnosis | Braak Stage | CERAD | PMI (hr) | Age at Death/Bx | Race | Sex |
|---|---|---|---|---|---|---|
| Control | I | 0 | 6 | 59 | B | M |
| Control | I | 0 | 2.5 | 70 | B | M |
| Control | I | 0 | 7 | 72 | W | M |
| Control | II | 0 | 10 | 57 | W | M |
| Aymptomatic AD | II | 3 | 17 | 64 | W | F |
| Aymptomatic AD | II | 2 | 20 | 81 | W | M |
| Aymptomatic AD | III | 3 | ~30 | 72 | W | M |
| Aymptomatic AD | III | 3 | 5 | 87 | W | F |
| Aymptomatic AD | III | 3 | 38 | 82 | W | F |
| Aymptomatic AD | IV | 3 | 35.5 | 76 | W | M |
| Aymptomatic AD | IV | 3 | 5.5 | 80 | W | M |
| Aymptomatic AD | IV | 3 | 2 | 91 | W | M |
| AD | V | 3 | 19 | 78 | W | F |
| AD | V | 3 | 12 | 92 | W | M |
| AD | V | 3 | 40 | 94 | W | M |
| AD | VI | 3 | 4 | 61 | W | M |
| AD | VI | 3 | 3.5 | 69 | W | M |
| AD | VI | 3 | 8 | 59 | W | M |
Frozen human brain samples
| Diagnosis | Age | Sex | Braak Stage | Region |
|---|---|---|---|---|
| Control | 60 | M | NA | Frontal cortex |
| Control | 58 | F | NA | Frontal cortex |
| Control | 92 | M | NA | Frontal cortex |
| Control | 92 | M | NA | Frontal cortex |
| Control | 73 | F | NA | Frontal cortex |
| Control | 63 | M | NA | Frontal cortex |
| AD | 87 | F | IV | Frontal cortex |
| AD | 89 | M | IV | Frontal cortex |
| AD | 90 | M | IV | Frontal cortex |
| AD | 88 | M | IV | Frontal cortex |
| AD | 91 | F | IV | Frontal cortex |
| AD | 94 | F | IV | Frontal cortex |
Primary cortical culture with P0 pups
Primary cortical cultures were generated from postnatal P0 pups. For culturing primary cortical neurons, fresh cortical tissues were dissected from postnatal day 0 pups. Briefly, C57BL/6 pups were anesthetized via hypothermia by wrapping in gauze and placing in aluminum foil pouch on ice. Then the pups were sprayed with 70% ethanol and transferred to 60 cm dish. We then isolated the brain from the skull and separated the two cortical hemispheres from the midbrain and transferred them to 10 cm culture dish filled with HBSS dissection buffer. The meninges of the cortex tissue were then completely removed. We then transferred all the cortical tissue into a 15 mL conical tubes and replaced HBSS dissection buffer with 5ml 0.25% Trypsin-EDTA supplemented with 150 μL DNase. The cortical tissue was incubated in a 37°C water bath for 15 min. Afterwards, the tissue was carefully removed of trypsin and gently washed 3 times with HBSS dissection buffer, followed by centrifugation (2000rcf for 2 mins at room temperature). The tissues were resuspended in 25ml plating medium (MEM Gibco #11090, 2.5% FBS, 1x Penicillin/streptomycin, L-glutamine, 0.6% D-glucose) and triturated gently with a 5 ml pipette. Single cells were passed through a 70 μm cell strainer and cell number was counted. Based on the purpose of the experiment, the cortical cells were then plated on different types of culture plates or dishes with feeding medium (Neurobasal media, 1×B27 supplement, 1× Penicillin/streptomycin, 1× L-glutamine).
For live-cell imaging, 35-mm glass-bottom dishes (MatTek) were coated for 1 hour with 0.1 mg/ml poly-D-lysine and then washed 3 times with biology grade water. 2×10⁵ primary cortical cells were plated on the glass coverslip in the center of the dish.
We used 24-well glass bottom black plates (Cellvis, cat#P24-1.5H-N) for the cortical neuron time course experiments with 488λ blue LED light exposure. The plates were pre-coated with 300 μl of 1mg/ml poly-D-lysine for 1 hour at room temperature in the culture hood. Then the plates were washed three times with sterile biology grade water and dried in the hood overnight covered in foil. On the day of cell culturing, 2×10⁵ cortical cells suspended in 200μl plating medium were plated in each well, placed in the incubator for 2 hrs, and then received1ml feeding medium.
For the collection of fresh cell lysate for biochemical analysis or Mass spectrometry, 10cm dishes were used. Briefly, the dishes were coated with poly-D-lysine prior to plating of cortical neurons (4×10⁶ cells/dish).
For all plate or dish types, the cultures were maintained at 37°C in the incubator with 5% CO2 and 95% air. For cell maintenance, ~1/2 volume of feeding media was replaced every 3-4 days until each experiment began (on day 11 to day 14).
METHOD DETAILS
Tau oligomers (S1p fractions) extraction from aged PS19 brain tissue
Frozen hippocampus and cortical tissues of 9-month old PS19 mice were weighed (100mg-250mg) and put in a Beckman Centrifuge Tube, polycarbonate thick wall (cat # 362305). A 10x volume of homogenization buffer was used to homogenize brain tissue with TBS buffer (50 mM Tris, pH 8.0, 274 mM NaCl, 5 mM KCl) supplemented with protease and phosphatase inhibitor cocktails (Roche, cat#05892791001 and cat#04906837001), as described previously (Jiang et al., 2019; Jiang et al., 2020). The homogenate was centrifuged at 48,300 g for 20 min at 4°C. The supernatant is designated as the S1 (TBS-soluble) fraction. The supernatant (S1) fraction was centrifuged a second time at 186,340 g at 4°C for 40 min. The TBS-extractable pellet (S1p) fraction was resuspended in a 4x volume of TE buffer relative to the starting weight of the tissue homogenate, aliquoted and frozen. The molecular weight of tau in the S1p fractions was documented by native page gel electrophoresis, and the concentration of total tau was measured by IB using 3-12% reducing SDS-PAGE gel by comparison to a gradient concentrations of recombinant tau ladders, using the tau-5 antibody (detecting total tau) by IB as described previously (Jiang et al., 2019). All the fractions were then normalized and divided into fractions of 20μg/ml tau for storage and future use.
Mouse brain stereotactic injection
Littermates PS19 P301S mice were stereotaxically injected with 2μl control lentiviral vector or shHNRNPA2B1 lentivirus at each left and right hemisphere of CA1 region at 3-month old. The coordinates of the lentivirus injection site were: 1.8 mm posterior and 1.5 mm lateral to bregma, 1.5 mm ventral to cortical surface (Jiang et al., 2019). Oligomeric Tau fraction S1p (40ng oligomeric tau) or Vehicle control were bilaterally injected into the CA1 region at 2 weeks after HNRNPA2B1 knock down. The coordinates of oligomeric tau injection were: 1.5 mm posterior and 1.5 mm lateral to bregma, 1.5 mm ventral to cortical surface. The procedure of stereotaxic injection was performed with KOPF instruments. Briefly, mice were deeply anaesthetized with isoflurane (4%, Abbot Laboratories) and placed in a stereotaxic frame. Anesthesia was kept constant with 1.5–2% isoflurane and oxygen pressure 6-8 kPa supplied per anesthesia nosepiece. After injecting 1 unit of meloxicam for every 10 grams of body weight for each mouse under the skin as analgesia, the skull was exposed and perforated with a stereotaxic drill at the desired coordinates bilaterally. After the skull was drilled with a robot drill, the syringe was switched for saline or fraction injection. The speed for needle insertion into the brain was 0.2mm/min and the speed for solution injection was 1μl/min. The needle was left in place for 15 min after the injection volume was delivered. Then, the syringe was removed at a rate of 0.2mm/min, and the skin over the entry point sutured. The mice were transferred to a single cage with a hot pad on the bottom. Meloxicam was injected every 12 hours until the mice were completely recovered.
Plasmid construction
The mCherry::Cry2 and 4R1N Tau::Cry2 construct were designed by Dr. Brangwynne’s group. Briefly, sequences for mCherry and Cry2Olig (Addgene) were cloned into the pHR lentiviral backbone to generate the pHR-mCh-Cry2Olig plasmid. A DNA fragment encoding human 4R1N full length tau was amplified by PCR using tau cDNA (Addgene). Then, the DNA fragment encoding 4R1N tau was inserted into the linearized pHR-mCh-Cry2Olig backbone using In-Fusion Cloning Kit (Takara). The resulting constructs were fully sequenced to confirm the absence of unwanted substitutions.
Lentivirus production
HEK293T cells were plated at a concentration of 1x10⁶ cells/well in a 6-well plate. 18 hrs later, cells were transiently co-transfected with PSP (1200 ng), VSV-G (400 ng), and target plasmids (400 ng) using 6 μL FuGene HD (Promega, Cat# E2311). 72 hrs later, conditioned media was harvested and centrifuged at 1000xg for 5 min to remove dead cells and debris. Supernatant was stored at −80°C until use. For primary neuron transduction, lentivirus was concentrated 10x using lenti-X concentrator (Takara Bio USA, Cat# 631231) with the concentrated pellet being re-suspended in PBS with 25 mM HEPES, pH 7.4.
Lentivirus transduction
For cell transduction of lentivirus, at day 2, neurons were transduced with lentivirus vectors at MOI 10 followed by medium change 48 hrs later. The process was repeated on day 5 for a double hit of transduction to increase the transfection efficacy. With this double-hit transduction procedure, the final transfection efficiency will be increased to ~60% while the transfection efficiency with a single time of lentivirus addition was ~30%. For the percentage of neurons response sensitively to light, it will be around 10% to total based on their diverse expression levels.
Knock down gene expression by siRNA
Primary cortical cultures of neurons were transduced with lentivirus coding for Tau::Cry2 (or Cry2Olig) on DIV2 and 4. On DIV6 the cultures were transduced with siRNA HNRNPA2B1 or scrambled control siRNA. On DIV10 the neurons were exposed to 20 or 60 min of 488 λ light, fixed and imaged. The HNRNPA2B1 siRNA (catalog# MBS829521) and control siRNA (catalog# MBS8241404) were purchased from MyBioSource. The siRNA oligo duplexes were resuspend and treated in cell culture as directed by the manufacture’s instruction. Briefly, the pre-designed sets of 3 different target-specific siRNA oligo duplexes of mouse HNRNPA2B1 gene were resuspend in each vial with DEPC water. Then the 3 vials of siRNA oligos were combined into one vial. The stock concentration of each oligomer was 100μM. On the day of transfection, 300μl neuronal feeding medium containing 20 pmol of each siRNA oligo was used to completely replace the old medium in each well of the 24-well plate. The oligomer sequence of each siRNA pool are as follows:
siRNA Negative Control:
UUCUCCGAACGUGUCACGUTT
ACGUGACACGUUCGGAGAATT
siRNA HNRNPA2B1:
HNRNPA2B1 siRNA (Mouse)-A:
CCACCUUAGAGAUUACUUUTT
AAAGUAAUCUCUAAGGUGGTT
HNRNPA2B1 siRNA (Mouse)-B:
CCGAUAGGCAGUCUGGAAATT
UUUCCAGACUGCCUAUCGGTT
HNRNPA2B1 siRNA (Mouse)-C:
CCAGCAGCCUUCUAACUAUTT
AUAGUUAGAAGGCUGCUGGTT
Live-cell imaging
The live-cell imaging procedure was referenced from precious publications (Shin et al., 2017). Briefly, on day 12 to day 14 of the primary cortical neurons, prior to imaging, the medium was replaced with imaging medium consisting of 2% FBS in HBSS (Corning cellgro). All live cell imaging was performed using 63× oil immersion objective on a Zeiss LSM880 laser scanning confocal microscope equipped with a temperature stage at 37°C and CO2 5%. For global activation, cells were imaged typically by use of two laser wavelength (488 nm for Cry2Olig activation /560 nm for mCherry imaging). To execute activation protocols with varying activation intervals, the repetitive ON/OFF cycle was applied by varying the length of OFF time (the activation duration, ta, was fixed to 1 s in all measurements). Localized activation experiments were performed using the stimulation setting where the blue laser scans only a designated region of interest.
Blue light exposure with 488λ LED bulb
Optogenetic gene control utilizes a light-activated protein which transfers light energy from photons to chemical energy, facilitating high-affinity binding for the cryptochrome-2 protein (Cry2Olig). For this research, a Cry2Olig protein fused to Tau is engineered to facilitate oligomeric tau formation by inducing strong affinity binding of the Cry2Olig protein. To reach certain threshold energy for Cry2Olig protein, a mounted LED was utilized to reach a light intensity of 2.5nW/mm2. Here we utilized the ThorLabs M488L4 LED, which emits 488 nm with a minimum LED power output of 205mW, a forward voltage of 3.8V and a maximum current of 350mA, and the LEDD1B T-Cube LED driver, which regulates at a maximum current of 1.2A.
Model and calculation
Two cell culture containers were used for the optogenetic Cry2Olig activation: 100x18mm Petri Dish and 24 well plates by Thermo Fisher. The petri dish has a diameter of 88mm for the inner ring holding the cell and the 24 well plates contain 24 inner rings of 15.6mm. The LED is placed 4 cm above all cell cultures. For 10 cm petri dish, the light activates the whole dish, while for 24-well plate, the light activates half the plate. To activate the Cry2Olig gene, an intensity of 200μW/cm2 is required.
The total light power for disks in different diameters is governed by the multiplying two properties (Equation 1):
| Equation 1 |
I is the intensity required, 200μW/cm2 and d is the diameter of the culture disk and A is the area of the culture disk holding all the cells.
For 10cm petri dish and 24-well plate, the area and light power are shown below (Table 1):
Table 1.
Light Power Calculation for Culture Disks
| 10cm Petri Dish | 24-Well Plate | |
|---|---|---|
| Intensity(μW/cm2) | 200 | 200 |
| Height(cm) | 4 | 4 |
| Diameter(mm)/Dimension(mm) | 88 | 85.5x63.9 |
| Area(cm2) | 60.82 | 54.63 |
| Light Power(mW) | 12.2 | 10.9 |
The M488L4 LED, as a photodiode, holds a coefficient for the electron to photon conversion. The maximum output power at a distance of 200mm (20cm) is 240mW. Since the LED is located 4cm above the light cell, by the inverse square law, the intensity increases 25 folds with a maximum irradiance at 4cm of 6W, above our required light power.
Assuming the LED functions linearly and based on the sphere illumines model, the source strength at 20cm is 240mW, governed by the spatial radiation distribution theory with the equation shown below (equation 2). S is the source strength at 4 cm, r is the diameter between the light source and the measured point, and I is the maximum irradiance measured.
| Equation2 |
Taken by the experimental data presented in the datasheet, we calculate the coefficient using equation 3 below:
| Equation 3 |
The coefficient for the electron to photon conversion is approximated as 0.945 for ThorLab M488L4LED. Therefore the electrical power is governed by equation 4 below:
| Equation 4 |
Moreover, the electrical power for a photodiode is governed by the forward voltage and currents shown by equation 5 below:
| Equation 5 |
The M470L4 LED has a forward voltage of 3.2 to reach the threshold for proton conversion. Consequently, the power calculations and currents required to activate Cry2Olig protein for different culture disk is shown below in Table2.
Table 2.
Electrical Power Calculation for Culture Disks
| 10cm Petri Dish | 24-Well Plate | |
|---|---|---|
| ε | 0.18 | 0.18 |
| Light Power(mW) | 12.2 | 10.9 |
| Electrical power (mW) | 67 | 61 |
| Forward Voltage(V) | 3.8 | 3.8 |
| Current(mA) | 17.6 | 16.1 |
The current is controlled by ThorLabs T-Cube LED Driver (LEDD1B) with a maximum current of 1200mA. The designated current is selected by tuning the knob of the system.
Preparation of Aβ oligomers
0.5mg A-β (human beta-Amyloid 1-42, Ultra-Pure, HFIP, cat# AS-64129-05, Molecular Mass: 4514.4) was dissolved in 50ul of filtered DMSO followed by completely transferring the aliquot into a 1.5 mL microcentrifuge tube (note: low-binding affinity, untreated, not siliconized). The A-β aliquot was sonicated on ice for 2 min (the sonicator was set up on the high power level: ~12), moving up and down to avoid the tube becoming burned. Then the aliquot was resuspended with 60 ul neurobasal medium to obtain a final concentration of 1mM. Next the aliquot of A-β was rotated for 24 hours at 4°C to promote oligomerization. On the next day, a native-page gel followed by coomassie labeling was performed to confirm the oligomerization quality. The 1mM A-β oligomers were aliquoted and stored in the −80 °C freezer until use.
Immuno-fluorescence labeling of fixed primary culture
In the glass bottom 24-well plate with cells, cells were fixed with 0.5 ml 4% PFA/PBS for 15 min followed by 3 washes in PBS, 5 min each. In the specific experiments where the m6A was to be detected, the cells were be exposed to UV light for 10 minutes before being fixed by PFA. Cells were permeabilized in 0.5ml PBS/0.1% Triton X-100 (PBST) for 15-30 min before being blocked in 0.5ml of 5% BSA - 5% donkey Serum in PBST for 1 hour. Then the cells were incubated in 1° antibody diluted in 5% BSA/PBST overnight at 4°C. The next day, cells were washed 3x in PBS-T, 10 min each before being incubated in 2° antibody diluted in 5% BSA/PBST, 2 hrs at RT. All the 2° antibodies were purchased from Thermo Fisher Scientific made in donkey and used for 1:800 dilution in labeling. After 2° antibody incubation, cells were incubated in DAPI diluted 1:10,000 in PBST (5 mg/ml stock solution) for 5 min after the first wash. Then cells were washed 2x with PBST, and once of with PBS, 10 min each, prior to being covered in Prolong Gold Antifade mounting media with 12mm coverslips. Plates were dried in the fume hood (or store at 4°C until ready to dry in fume hood). The primary antibodies used in this study for ICC are as follows: Chicken polyclonal anti-MAP2, 1:250 (Aves Labs, Cat#MAP, RRID: AB_2313549); Goat polyclonal anti-mCherry, 1:300 (MyBioSource, Cat# MBS448057); Rabbit monoclonal anti-Lamin B2, 1:500 (Abcam, Cat# ab151735); Mouse monoclonal anti-Puromycin, clone 12D10, 1: 500 (Millipore Sigma, Cat# MABE343, RRID:AB_2566826); Rabbit monoclonal anti-Cleaved Caspase 3 (Asp175) (5A1E), 1:400 (Cell Signaling Technology, Cat# 9664, RRID:AB_2070042); Mouse monoclonal phospho-Tau (Thr181) antibody AT270, 1:400 (Thermo Fisher Scientific, Cat# MN1050, RRID:AB_223651); Mouse monoclonal phospho-Tau (S262) antibody 12E8, 1:400 (provided by Philip Dolan, Prothena); Rabbit Polyclonal anti-HNRNP A2B1, 1:300 (Thermo Fisher Scientific, Cat# PA534939, RRID:AB_2552288); TIA1 (rabbit, abcam, cat# ab40693, specifically lot# GR3202325-1, 1:400); Monoclonal mouse anti- m6A IgG, 1:500 (Synaptic Systems, Cat# 202 111); Mouse monoclonal anti-TOMA2, 1:300 (provided by Rakez Kayed). All the secondary antibodies were purchased from Jackson ImmunoResearch.
Click-iT™ Plus TUNEL Assay
The Click-iT™ Plus TUNEL Assay kit for in situ apoptosis detection with Alexa Fluor488 dyes was purchased from Invitrogen (Catalog Nos. C10617). The labeling protocol was as instructed by the manufacture’s manual.
LDH assay
50 μl supernatant were collected as designed time point into a 96-well plate for lactate dehydrogenase (LDH) release assay as manufacture’s protocol (Promega, cat# G1780). Briefly, 50μl of the CytoTox 96® Reagent was added to each sample aliquot. The plate was covered with foil to protect it from light, and incubated for 30 minutes at room temperature on shaker. 50μl of Stop Solution was added to each well of the 96-well plate, and the absorbance recorded at 490nm with the plate reader. Each experiment was repeated at least 3 times with triplicate wells each time.
Surface sensing of translation (SUnSET)
Cells were treated with 10 μg/ml puromycin (Research Products International P33020, resuspended in water) into media for 30mins, with or without light. Cells were washed twice with ice-cold PBS before lysis. Cell lysate was mechanically lysed in homogenization buffer containing 50 mM Tris (pH 8.0), 274 mM NaCl, 5 mM KCl, with protease inhibitors (Sigma 4693159001), PMSF (1 mM final concentration), and phosphatase inhibitors (Gibco 786-452 and −451). Samples were centrifuged at 4° C at 13,000 g for 15 min, and the supernatant was used for immunoblot. If the visualization of newly synthesized protein by immunolabeling was desired, the cell culture was fixed by 4% PFA after PBS washing and then the immunofluorescence labeling steps were performed as described above. The dilution of puromycin antibody hereby in WB was 1:2000 and in IF labeling 1:1000.
Immunoprecipitation of mCherry-fusion Proteins
After light exposure, we aspirated the culture medium completely and washed cells with 10ml cold PBS twice, and then the dish was flash-frozen on dry ice. On ice, 800ul homogenization buffer were added in to each 10cm dishes of primary cortical neurons (~4×10⁶ cells) which were transfected with either mCherry::Cry2 or 4R1N Tau::Cry2 lentivirus. The cells were scraped from the bottom of the dish and transferred into 1.5ml tubes (low binding affinity, cat#z666505). Then the cells were homogenized using cordless motorized tissue grinder with blue plastic pestles, 3 cycles of 30 sec with 10 sec pause. Cell lysate were stored at −80° C for future use.
On the day of mCherry IP, 0.5mM EDTA was added into the cell lysate before it was centrifuged at 20,000x g for 10 min at 4°C. Then the supernatant was transferred to a pre-cooled tube. We prepared the RFP-Trap magnetic agarose beads (Chromotek, Cat# rtma-20) by vortex and pipetted 25 μl bead slurry into 500 μl ice-cold dilution buffer. The beads were magnetically separated until supernatant was clear. We discarded the supernatant and washed beads twice. Then we added the cell lysate to equilibrate RFP-Trap beads following by tumbling end-over-end overnight at 4°C. On the second day, we magnetically separated beads until supernatant was clear. After that, we resuspended RFP-Trap beads in 500 μl dilution buffer and washed beads twice. Then the bound proteins were eluted by adding 50 μl 2×LDS sample buffer followed by boiling at 95 °C for 10 min.
To purify the eluted proteins for the following Nano-LC Mass Spectrometry, we loaded all the samples into a 12% gel and isolated each sample when they went through about 1 cm out of the gel well.
In-gel digestion and LC-MS analysis
Protein bands were excised and sliced into pieces (2×2mm), then washed with water, 50% Ambic/ACN, and ACN sequentially, and dried. Afterwards, gel pieces were rehydrated with 1ug of trypsin in 100uL of 50mM Ambic with 10% ACN on ice for 30mins, after sufficient Ambic was added to cover the gel piece. Proteins in gel were digested at 37 °C overnight followed by the addition of formic acid to 1% in solution. Samples were evaporated to dryness in a vacuum concentrator, and reconstituted in 1% formic acid before LC-MS analysis.
The C18 PepMap pre-column (3 μm, 100 Å, 75 μm × 2cm) hyphenated to a RSLC C18 analytical column (2μm, 100 Å, 75μm × 50cm) was used to separate peptides. High performance nanoflow liquid chromatography – Orbitrap tandem mass spectrometry (LC-MS/MS) analyses were completed using an EASY nLC 1200 system coupled to a Q Exactive HF-X mass spectrometer (Thermo Scientific). Full MS precursor ion profile spectra were collected at a resolution of 60,000 using an automatic gain control of AGC target of 3×10⁶ or a maximum injection time of 50 ms over a scan range of 300 ~1650 m/z. Data-dependent acquisition of high energy collision dissociation (HCD) MS2 fragmentation scans were performed at 15,000 resolution using 27% total normalized collision energy, with dynamic exclusion set to 30 sec.
The acquired data was searched by MaxQuant against the UniProt mouse proteome, specifying a fragment ion mass tolerance of 20 ppm, maximum of missed cleavage sites, oxidation as variable modification, and a false discovery rate of 0.01%. Protein candidates tentatively identified by less than 2 unique peptides were excluded.
Isolation of TBS Soluble (S1p)
The S1p fractions were generated as described previously (Apicco et al., 2018). The cell lysis protocol was done as described in the SUnSET section above. Brain tissue was mechanically lysed in homogenization buffer containing 50 mM Tris (pH 8.0), 274 mM NaCl, 5 mM KCl, with protease inhibitors (Sigma 4693159001), PMSF (1 mM final concentration), and phosphatase inhibitors (Gibco 786-452 and −451). The lysate was centrifuged at 4°C at 13,000 g for 15 min. The resulting supernatant was ultracentrifuged at 28k rpm (29800 x g) in a TLA-55 rotor for 20 min at 4°C. Thenwe aliquot supernatant to new microtubes as S1 (TBS-SOLUBLE). The S1 fraction was centrifuged @ 60k rpm (150000g) for 60 min at 4 °C (Rotor TLA-55). Then pellet was marked as S1p. S1p and P fractions were then tested by dot blot or immunoblot.
Immunoprecipitation with PS19 P301S brain tissue
Whole brain cell lysates from 3- and 6-month old PS19 P301S tau transgenic, and WT mice were used for the immunoprecipitation of HNRNPA2B1, HNRNPH, Eif3l and Lamin B2. To prepare the cell lysate, half of a hemisphere from each brain was lysed in homogenization buffer containing 0.02% NP40. Supernatant from each lysed brain was collected after centrifugation for 15 minutes at 12000g at 4°C and further used for immunoprecipitation.
For immunoprecipitation, 25 μl of completely re-suspended magnetic Dynabeads (Invitrogen, 10003D) were washed 3 times with the homogenization buffer by placing the tubes on the magnet rack to separate the beads from the solution. After washing the beads, 3.5 μg of control rabbit IgG or HNRNPA2/B1 (Invitrogen, PA5-34939), HNRNPH (Bethyl Laboratories, A300-511A-M), Eif3l (Invitrogen, PA531647) and Lamin B2 (Abcam, ab151735) antibodies diluted with 200 μl homogenization buffer, were incubated for 1 hour with magnetic Dynabeads. Antibody bound beads were washed 3 times to remove unbound fractions and incubated for 1 hour with 500 μg of respective total brain cell lysates described previously. The brain cell lysates were diluted 4 times with homogenization buffer without NP40, prior to the incubation step. After 1 hour, the beads were washed 2 times with homogenization buffer followed by 4 washes with homogenization buffer without NP40 to avoid the disruption of Tau oligomers. The bound fraction was then eluted by incubating the beads with 20 ul of 200mM Glycine, pH 2.5, for 10 minutes in ice. The elution step was repeated 2 times followed by adding equal volume of 1M Tris pH 10. Eluted fractions from each IP were then loaded in 4-12% SDS PAGE gel with native page running buffer and transferred on nitrocellulose membrane. Each blot was probed with TOC1 antibody to detect oligomeric Tau. The blots were then stripped and reprobed with HNRNPA2B1, HNRNPH, Eif3l and Lamin B2 antibodies respectively (use information shown in the Key Resources Table).
Immunoblotting
For the detection of high molecular weight 4R1N Tau::Cry2 chimeras, we used a NuPAGE™ 3-8% Tris-Acetate Protein Gels, the samples were prepared homogenization buffer as described above and without detergent. Reducing reagent or boiling steps were also omitted to protect the oligomer structure.
For the detection of TIA1 and LaminB2 in the soluble and insoluble fractions, dot blots were performed using an apparatus obtained from Bio-Rad (Serial number 84BR 30185) when the proteins were transferred to 0.2μm nitrocellulose membranes.
For the puromycin IB to detect the newly synthesized proteins, cell lysates were collected from frozen cultures with RIPA lysis buffer. Reducing and non-reducing protein samples were separated by gel electrophoresis and transferred to 0.2μm nitrocellulose membranes using the Bolt SDS-PAGE system (Life Technologies).
After IB or dot blot, the membranes were blocked in 5% nonfat dry milk (NFDM) in PBS supplemented with 0.025% Tween-20 (PBST) for 1 hour RT, followed by incubation overnight at 4°C in primary antibody diluted in 5% bovine serum albumin/PBST. Primary antibodies used were as follows: Anti-Puromycin Antibody (1:2000, mouse, Millipore, cat# MABE343), Tau13 (1:10,000, Davies Lab, Northwell), TOC1 (1:1000, mouse, Kanaan lab, MSU), Lamin B2 (1:2000, Rabbit, Abcam, cat# ab151735), mCherry antibody (1:500, goat, MyBioSource, cat# MBS448057), Rabbit monoclonal anti-EIF2α (1:500, Cell Signaling Technology, Cat# 5324, RRID:AB_10692650), Rabbit monoclonal phospho-eIF2α (Ser51) (119A11), 1:500 (Cell Signaling Technology, Cat# 3597, RRID: AB_390740); Rabbit Polyclonal anti-eIF3l, 1:500 (Thermo Fisher Scientific, Invitrogen, Cat# PA531647, RRID:AB_2549120), Rabbit Polyclonal anti-HNRNPH, 1:500 (Bethyl Labs, Cat# A300-511A); Rabbit Polyclonal anti-LBR, 1:600 (Proteintech, Cat# 12398-1-AP, RRID:AB_2138334); Rabbit Polyclonal anti-HNRNPA2B1, 1:300 (Thermo Fisher Scientific, Cat# PA534939, RRID:AB_2552288).
In vitro co-immunoprecipitation of tau and HNRNPA2B1
Recombinant tau was made as previously described (Ash et al., 2021; Cook et al., 2014). Briefly, wild-type 0N4R tau was expressed in Rosetta DE3 (Novagen) competent bacteria using IPTG (isopropyl β-D-1-thiogalactopyranoside), then extracted by freeze/thaw lysis, purified by HiTrap SP HP (GE) ion-exchange column, and dialyzed into 10 mM HEPES buffer at pH 7.4.
Recombinant MBP::HIS::HNRNPA2B1 was expressed and purified as described previously in (Verma et al., 2017). Briefly, MBP-hnRNPA2_FL_WT plasmid (Addgene #98662) was isolated and transformed in Escherichia coli BL21-DE3 (Novagene) for protein expression. Eluted protein was buffer exchanged with the buffer containing 10mM HEPES, pH 7.4, 100mM NaCl, 5% Glycerol and were loaded in 12% SDS-PAGE to analyse purity of the proteins.
10μM tau, domains of tau and 10μM MBP::HIS::HNRNPA2B1 were incubated alone or together in 10mM HEPES, pH7.4, 100mM NaCl, 1mM DTT and, where indicated, 200ng/μl RNA and 40ng/μl dextran sulfate. Mixes were reacted at 37°C with 1000rpm rotation for 2 hours. Immunoprecipitations were performed by conjugating 2.5μg of (mouse) anti-tau5 antibody (N.K., MSU), 2.5μg of (rabbit) anti-HNRNPA2B1 antibody (Thermo, PA534939) or 2.5μg of mouse (Santa Cruz, sc-2025) or rabbit (ProteinTech, 30000-0-AP) IgG to Direct IP AminoLink Coupling Resin (Pierce) according to the manufacturer’s protocol. After conjugation and washing, the resin was blocked for 30 mins in 5% non-fat dry milk in PBS, then washed in PBS. Reaction mixes containing tau and/or MBP::HIS::HNRNPA2B1 were incubated with antibody charged resins overnight at 4°C, then washed in PBS containing 0.1% tween-20 and eluted by boiling with 2x LDS buffer (Thermo) containing reducing agent. Inputs and eluted immunoprecipitates were analyzed by IB using Bolt 4-12% Bis-Tris gels (Thermo) using standard protocols. PVDF Immunoblots were probed with the antibodies (rabbit) anti-tau R1 (1:2000; NK, MSU), (rabbit) anti-HNRNPA2B1 antibody (1:2000, Thermo), (mouse) anti-tau5 (1:10000), (mouse) anti-tau13 (1:10000; N.K., MSU), (mouse) anti-tauC4 (1:2000; Millipore). Secondary HRP-conjugated antibodies were from Jackson ImmunoResearch.
Immuno-fluorescence labeling of fixed brain tissues
For immuno-labeling, selected brain sections of LEnt from bregma −2.8 were washed in PBS for 10 mins and then permeabilized in 0.5ml PBS/0.25% Triton X-100 (PBST). Tissues were blocked in blocking solution supplemented with 5% BSA and 5% normal donkey serum in PBST, 1.5-2 hrs at room temperature (RT). Then sections were incubated in primary antibodies diluted in 5% BSA/PBST overnight at 4°C. On the second day, we washed the brain sections 3x in PBST, 15 min each and then incubated the brain sections in 2° antibodies (1:700 for Dylight/Alexa-conjugated antibodies made in donkey purchased from Thermo Fisher Scientific) in 5% BSA/PBST for 2 hrs at RT. For DAPI nuclei stain, DAPI (1:10,000) was diluted in PBST and incubated with brain sections for 15 min followed by brain section washing 2x with PBST then 1x with PBS, 10 min each. The brain sections were mounted onto microscope glass slides in Prolong gold antifade reagent. Images were captured by Carl Zeiss confocal LSM700. Primary antibodies used for brain tissue labeling were as follows: Mouse monoclonal anti-TOMA2, 1:300 (provided by Rakez Kayed); Rabbit Polyclonal anti-HNRNPA2B1, 1:300 (Thermo Fisher Scientific, Cat# PA534939, RRID:AB_2552288); Rabbit Polyclonal anti-LBR, 1:300 (Proteintech, Cat# 12398-1-AP, RRID:AB_2138334); Rabbit Polyclonal anti-TDP43, 1:300 (Proteintech, Cat# 12892-1-AP, RRID:AB_2200505).
Immunoprecipitation of HNRNPA2B1 from Human AD and Ctrl Brain tissue
Whole brain cell lysates from control and AD human brain tissue were used for the immunoprecipitation of HNRNPA2B1. To prepare the cell lysate, 400 mg of each brain was lysed in lysis buffer containing 50mM Tris, pH 8, 274 mM NaCl, 5mM KCL with 0.02% NP40 supplemented with HALT protease inhibitor and phosphatase inhibitor (ThermoFisher). Supernatant from each lysed brain was collected after centrifugation for 15 minutes at 12,000 rcf at 4°C and further used for immunoprecipitation.
For immunoprecipitation, 25 ul of completely re-suspended magnetic Dynabeads (Invitrogen, 10003D) were washed 3 times with the lysis buffer by placing the tubes on the magnet rack to separate the beads from the solution. After washing the beads, 5 μg of control rabbit IgG or HNRNPA2/B1 (Invitrogen, PA5-34939 antibodies diluted with total of 200 μl lysis buffer, were incubated for 1 hour with magnetic Dynabeads. Antibody-bound beads were washed 3 times to remove unbound fractions and incubated for 30 min with 5% BSA prepared in lysis buffer to avoid nonspecific binding. The blocking buffer was removed after incubation and the antibody-bound beads were incubated for 1 hour with 1 mg of respective total brain cell lysates described previously. The brain cell lysates were diluted 4 times with lysis buffer without NP40, prior to the incubation step. After 1 hour, the beads were washed 2 times with lysis buffer followed by 4 washes with buffer without NP40 to avoid the disruption of Tau oligomers. The bound fraction was then eluted by incubating the beads with 30 μl of 200mM Glycine, pH 2.5, for 10 minutes in ice. The elution step was repeated one more time followed by adding equal volume of 1M Tris pH 10. Eluted fractions from each IP were then loaded in 4-12% SDS PAGE gel with native page running buffer and transferred on nitrocellulose membrane. Each blot was probed with TOC1 antibody to detect oligomeric Tau. The blots were then stripped and reprobed with HNRNPA2/B1 antibody.
Detection of m6A-RNA in Tau complex from Brain tissue
Step-1:
For mouse/human brain tissue, we crushed 100mg of the tissue with pestle until a fine powder was formed on dry ice. Then the powder was poured into a 5cm dish (one sample per dish). We put the dish on dry ice and subjected the samples to 3 rounds of cross linking using an energy dose of 400 mJ/cm^2 (“4000” on the Spectroline XL-1000 ENERGY setting) with 254 nm ultraviolet radiation. The tissue powder was then homogenized in 500ul pre-chilled iCLIP lysis buffer (50 mM Tris-HCl pH 7.4, 100 mM NaCl, 0.02% NP-40, 0.1% SDS, 0.5% sodium deoxycholate, Protease Inhibitor Cocktail III, RNase inhibitor 22U and DNase I 4U) and ground with a motorized pestle for 30 sec on ice followed by addition of another 0.5ml Lysis buffer and mixing. The lysate was centrifuged 20,000g, 4°C for 20 min and the supernatant was transferred to a new tube. Then we removed 50μl (5%) of the sample, which was reserved as the “Input” for subsequent RNA extractions.
Step-2:
30 μl of protein A/G Dynabeads were washed, resuspend in 100μl iCLIP lysis buffer and mixed with 5 μg Tau13/HNRNPA2B1 antibody or 5μg IgG per experiment. The tubes were rotated for 60 min at room temperature followed by washing 3 times with 900 μl lysis buffer.
Step-3:
The remaining supernatant from Step-1 was added to a prepared tube of beads. Next, the beads/lysate mix was rotated overnight at 4°. On the second day, the beads were washed once with 900μL lysis buffer, 3 times with 900μL cold High salt wash buffer ((50 mM Tris-HCl pH 7.4, 1 M NaCl, 1 mM EDTA, 0.02% NP-40, 0.1% SDS, 0.5% sodium deoxycholate), 3 times of 500μL cold Wash buffer (20 mM Tris-HCl pH 7.4, 10 mM MgCl2, 0.2% Tween-20) and 2 times of 500μL cold PK buffer (100mM Tris-HCl pH 7.4, 50mM NaCl, 10mM EDTA). After the washes, the beads were resuspended in 100μl PK buffer.
Step-4:
RNA from the beads was released by mixing with Proteinase K mix (75 μl of Protein K buffer containing Proteinase K 800ng/25 μl), and incubation in an Eppendorf Thermomixer at 1200 rpm, 55 °C, 60 min.
Step-5:
RNA from Step-4 and the 50ul Input lysate from Step-1 were purified with TRIZOL reagent. The RNA purification procedure was based on the InVitrogen’s User Guide for TRIZOL (Cat#: 15596026.PPS). Briefly, supernatant or input cell lysate were diluted to 250 μl and then mixed with 750μl TRIZOL followed by transfer to Phaselock gel HEAVY tube. 200μl of chloroform was then added to the tube. Note that we used 1μl glycogen, 1:1 volume of isopropanol and 1:10 volumes NaAc to precipitate the RNA in −80 °C for ~1h before the RNA washing in 75% ethanol.
Step-6:
purified RNA from Step-5 was then detected for the m6A with an ELISA kit.
N6-Methyladenosine quantification by ELISA
Quantification of N6-Methyladenosine in the immune-precipitated samples from human brain or P301S mouse tissue with Tau13 or HNRNPA2B1 antibody was performed using the EpiQuik m6A RNA Methylation Quantification Kit (EpigenTek, Cat# P-9005). The experiment procedures were as instructed by the manufacture.
QUANTIFICATION AND STATISTICAL ANALYSIS
Bioinformatics analysis of the proteomics data
To adjust for baseline expression, the average value of each protein in each mCherry::Cry2 groups was subtracted from that of corresponding Tau::Cry2 samples at each time point, respectively. Baseline-adjusted protein levels were then normalized to mCherry-Cry2 LFQ protein intensity in each sample. Differential analysis for tau 20min light vs. tau no light, tau 60min light vs. tau 20min light and tau 60min vs. tau no light was performed using the baseline-adjusted, normalized LFQ intensity using linear model with R package limma (Ritchie et al., 2015).
The cutoffs set for volcano plot were fold-change as FC>3 (which is log2FC>1.58) and adjust p value p<0.05 for the colored dots in volcano plots, which were labeled as Green FC>3, Red both FC>3 and P<0.05, Blue FC<3 but P<0.05. The cutoff for functional analysis was set as FC>3 and P<0.05. We performed separate GO analyses using the STRING database on proteins that were uniquely and significantly decreased and increased at 20 min or 60 min of light exposure in comparison to the no light group. We also analyzed the Reactome pathways in the functional annotation of STRING database with all the proteins that were significantly changed at 20min or 60min, respectively.
A network analysis was carried out using Cytoscape (V3.7.2). Data from the mCherry IP MS analysis were loaded into Cytoscape and mapped to the STRING protein query database for Mus musculus using the official gene-symbol. The filter for the dataset was established as P<0.05 and (log2 FC≥1.58 or log2 FC≤−1.58) and a confidence score cut-off was set as 0.8. A protein interaction network based on the STRING interaction score was then formed from the 477 proteins at 20min light group and 372 proteins at 60min group, using the Edge-weighted Spring embedded Layout.
Image analysis
The dendritic length measurement of neurons in MAP-2 labeling were quantified using ImageJ plug-ins NeuronJ to trace the MAP2 positive processes(Schmitz et al., 2011). The labeling intensity in immuno-fluorescence was measured by ImageJ. Co-localization of mCherry positive tau oligomers to TIA1 granules in neuronal soma was analyzed with z-stacks images and Pearson coefficient assay by FIJI (ImageJ) coloc2 plug-in. The quantification of cell numbers was done blindly by at least two investigators in the lab.
The imaging processing of the human brain tissue is based on a customized MATLAB program. The MATLAB program first converts the RGB fluorescence images into gray-scale images. The total areas and light intensities are then calculated using these gray-scale images. To extract statistical data in the overlapping region of images with different labeling, the MATLAB program first extracts the superposed area coordinates. The area and intensity data within the overlapping region are calculated for each image with the extracted coordinates. The coordinates of the non-overlapping area can also be extracted following a similar workflow. Related area and intensity data of non-overlapping regions can be calculated accordingly. The detailed MATLAB program code is described previously (Jiang et al., 2020).
Statistical analysis
Statistical analyses and figures artwork were performed using GraphPad Prism version 6.00 for Windows with a two-sided α of 0.05. All group data are expressed as mean ± SEM. Column means were compared using one-way ANOVA with treatment as the independent variable. Group means were compared using two-way ANOVA using factors of genotype and fraction treatment, respectively. When ANOVA showed a significant difference, pair wise comparisons between group means were examined by Tukey’s, Dunnett or uncorrected Fisher’s LSD multiple comparison test. Significance was defined when p< 0.05.
Supplementary Material
S Table-1_Normalization and statistics of protein intensity, Related to Fig 2.
S Table-2_Venn p0.05 up_gene list, Related to Fig 2.
S Table-3_Venn p0.05 down_gene list, Related to Fig 2.
S Table-4_Functional annotation_Reactome pathways, Related to Fig 2.
S Table-5 comparisons of tau proteomics with published dataset, Related to Fig 2.
Supplemental-Video 1_opto-Tau_first activation in SHSY5Y cell, Related to Fig 1.
Supplemental-Video 2_opto-Tau_Re-activation in SHSY5Y cell, Related to Fig 1.
Supplemental-Video 3_mcherry 1st activation in primary cortical neuron, Related to Fig 1.
Supplemental-Video 4_mcherry 2nd activation in primary cortical neuron, Related to Fig 1.
Supplemental-Video 5_opto-Tau_first activation in primary cortical neuron, Related to Fig 1.
Supplemental-Video 6_opto-Tau_second activation in primary cortical neuron, Related to Fig 1.
Highlights:
Tau oligomerization exhibits rapid aggregation of proteins linked to RNA metabolism
Oligomeric Tau complexes with HNRNPA2B1 and m6A-RNA to regulate RNA translation
Knockdown of HNRNPA2B1 reduces the response to pathological tau
m6A progressively increases with disease severity in human AD brains
ACKNOWLEDGEMENTS
We thank Cliff Brangwynne and David Sanders (Princeton) for the Cry2Oligo constructs, Peter Davies (Northwell/Hofstra) for the Tau13 antibody, and Philip Dolan (Prothena) for the 12E8 antibody. Brain tissues were provided by the Alzheimer Disease Centers (ADC) of Boston University (NIH grant AG50204517 and P30-AG13846), Emory University (P30 AG066511), the Mayo Clinic and Mount Sinai Medical Center. We would like to thank the following funding agencies for their support: BW: NIH (AG050471, NS089544, AG056318, AG064932, AG061706) and the BrightFocus Foundation.
Footnotes
Publisher's Disclaimer: This is a PDF file of an unedited manuscript that has been accepted for publication. As a service to our customers we are providing this early version of the manuscript. The manuscript will undergo copyediting, typesetting, and review of the resulting proof before it is published in its final form. Please note that during the production process errors may be discovered which could affect the content, and all legal disclaimers that apply to the journal pertain.
DECLARATION OF INTERESTS
B.W. is co-founder and Chief Scientific Officer for Aquinnah Pharmaceuticals Inc.
REFERENCES
- Alarcon CR, Goodarzi H, Lee H, Liu X, Tavazoie S, and Tavazoie SF (2015). HNRNPA2B1 Is a Mediator of m(6)A-Dependent Nuclear RNA Processing Events. Cell 162, 1299–1308. [DOI] [PMC free article] [PubMed] [Google Scholar]
- Anders M, Chelysheva I, Goebel I, Trenkner T, Zhou J, Mao Y, Verzini S, Qian SB, and Ignatova Z (2018). Dynamic m(6)A methylation facilitates mRNA triaging to stress granules. Life Sci Alliance 1, e201800113. [DOI] [PMC free article] [PubMed] [Google Scholar]
- Apicco DJ, Ash PEA, Maziuk B, LeBlang C, Medalla M, Al Abdullatif A, Ferragud A, Botelho E, Ballance HI, Dhawan U, et al. (2018). Reducing the RNA binding protein TIA1 protects against tau-mediated neurodegeneration in vivo. Nat Neurosci 21, 72–80. [DOI] [PMC free article] [PubMed] [Google Scholar]
- Arguello AE, DeLiberto AN, and Kleiner RE (2017). RNA Chemical Proteomics Reveals the N(6)-Methyladenosine (m(6)A)-Regulated Protein-RNA Interactome. J Am Chem Soc 139, 17249–17252. [DOI] [PubMed] [Google Scholar]
- Ash PEA, Lei S, Shattuck J, Boudeau S, Carlomagno Y, Medalla M, Mashimo BL, Socorro G, Al-Mohanna LFA, Jiang L, et al. (2021). TIA1 potentiates tau phase separation and promotes generation of toxic oligomeric tau. Proc Natl Acad Sci U S A 118. [DOI] [PMC free article] [PubMed] [Google Scholar]
- Berger Z, Roder H, Hanna A, Carlson A, Rangachari V, Yue M, Wszolek Z, Ashe K, Knight J, Dickson D, et al. (2007). Accumulation of pathological tau species and memory loss in a conditional model of tauopathy. J Neurosci 27, 3650–3662. [DOI] [PMC free article] [PubMed] [Google Scholar]
- Bishof I, Dammer EB, Duong DM, Kundinger SR, Gearing M, Lah JJ, Levey AI, and Seyfried NT (2018). RNA-binding proteins with basic-acidic dipeptide (BAD) domains self-assemble and aggregate in Alzheimer’s disease. J Biol Chem 293, 11047–11066. [DOI] [PMC free article] [PubMed] [Google Scholar]
- Chauderlier A, Gilles M, Spolcova A, Caillierez R, Chwastyniak M, Kress M, Drobecq H, Bonnefoy E, Pinet F, Weil D, et al. (2018). Tau/DDX6 interaction increases microRNA activity. Biochim Biophys Acta Gene Regul Mech 1861, 762–772. [DOI] [PubMed] [Google Scholar]
- Chen XY, Zhang J, and Zhu JS (2019). The role of m(6)A RNA methylation in human cancer. Mol Cancer 18, 103. [DOI] [PMC free article] [PubMed] [Google Scholar]
- Combs B, and Kanaan NM (2017). Exposure of the Amino Terminus of Tau Is a Pathological Event in Multiple Tauopathies. Am J Pathol 187, 1222–1229. [DOI] [PMC free article] [PubMed] [Google Scholar]
- Cook C, Carlomagno Y, Gendron TF, Dunmore J, Scheffel K, Stetler C, Davis M, Dickson D, Jarpe M, DeTure M, et al. (2014). Acetylation of the KXGS motifs in tau is a critical determinant in modulation of tau aggregation and clearance. Hum Mol Genet 23, 104–116. [DOI] [PMC free article] [PubMed] [Google Scholar]
- Cornelison GL, Levy SA, Jenson T, and Frost B (2019). Tau-induced nuclear envelope invagination causes a toxic accumulation of mRNA in Drosophila. Aging Cell 18, e12847. [DOI] [PMC free article] [PubMed] [Google Scholar]
- Edupuganti RR, Geiger S, Lindeboom RGH, Shi H, Hsu PJ, Lu Z, Wang SY, Baltissen MPA, Jansen P, Rossa M, et al. (2017). N(6)-methyladenosine (m(6)A) recruits and repels proteins to regulate mRNA homeostasis. Nat Struct Mol Biol 24, 870–878. [DOI] [PMC free article] [PubMed] [Google Scholar]
- Eftekharzadeh B, Daigle JG, Kapinos LE, Coyne A, Schiantarelli J, Carlomagno Y, Cook C, Miller SJ, Dujardin S, Amaral AS, et al. (2018). Tau Protein Disrupts Nucleocytoplasmic Transport in Alzheimer’s Disease. Neuron 99, 925–940 e927. [DOI] [PMC free article] [PubMed] [Google Scholar]
- Evans HT, Benetatos J, van Roijen M, Bodea LG, and Gotz J (2019). Decreased synthesis of ribosomal proteins in tauopathy revealed by non-canonical amino acid labelling. EMBO J 38, e101174. [DOI] [PMC free article] [PubMed] [Google Scholar]
- Farrer LA, Cupples LA, Haines JL, Hyman B, Kukull WA, Mayeux R, Myers RH, Pericak-Vance MA, Risch N, and van Duijn CM (1997). Effects of age, sex, and ethnicity on the association between apolipoprotein E genotype and Alzheimer disease. A meta-analysis. APOE and Alzheimer Disease Meta Analysis Consortium. Jama 278, 1349–1356. [PubMed] [Google Scholar]
- Frost B, Bardai FH, and Feany MB (2016). Lamin Dysfunction Mediates Neurodegeneration in Tauopathies. Curr Biol 26, 129–136. [DOI] [PMC free article] [PubMed] [Google Scholar]
- Gregory JM, Whiten DR, Brown RA, Barros TP, Kumita JR, Yerbury JJ, Satapathy S, McDade K, Smith C, Luheshi LM, et al. (2017). Clusterin protects neurons against intracellular proteotoxicity. Acta Neuropathol Commun 5, 81. [DOI] [PMC free article] [PubMed] [Google Scholar]
- Guzman-Martinez L, Farias GA, and Maccioni RB (2013). Tau oligomers as potential targets for Alzheimer’s diagnosis and novel drugs. Front Neurol 4, 167. [DOI] [PMC free article] [PubMed] [Google Scholar]
- Han M, Liu Z, Xu Y, Liu X, Wang D, Li F, Wang Y, and Bi J (2020). Abnormality of m6A mRNA Methylation Is Involved in Alzheimer’s Disease. Front Neurosci 14, 98. [DOI] [PMC free article] [PubMed] [Google Scholar]
- Harold D, Abraham R, Hollingworth P, Sims R, Gerrish A, Hamshere ML, Pahwa JS, Moskvina V, Dowzell K, Williams A, et al. (2009). Genome-wide association study identifies variants at CLU and PICALM associated with Alzheimer’s disease. Nat Genet 41, 1088–1093. [DOI] [PMC free article] [PubMed] [Google Scholar]
- Jiang L, Ash PEA, Maziuk BF, Ballance HI, Boudeau S, Abdullatif AA, Orlando M, Petrucelli L, Ikezu T, and Wolozin B (2019). TIA1 regulates the generation and response to toxic tau oligomers. Acta Neuropathol 137, 259–277. [DOI] [PMC free article] [PubMed] [Google Scholar]
- Jiang L, Zhao J, Cheng JX, and Wolozin B (2020). Tau Oligomers and Fibrils Exhibit Differential Patterns of Seeding and Association With RNA Binding Proteins. Front Neurol 11, 579434. [DOI] [PMC free article] [PubMed] [Google Scholar]
- Johnson ECB, Dammer EB, Duong DM, Ping L, Zhou M, Yin L, Higginbotham LA, Guajardo A, White B, Troncoso JC, et al. (2020). Large-scale proteomic analysis of Alzheimer’s disease brain and cerebrospinal fluid reveals early changes in energy metabolism associated with microglia and astrocyte activation. Nat Med 26, 769–780. [DOI] [PMC free article] [PubMed] [Google Scholar]
- Johnson ECB, Dammer EB, Duong DM, Yin L, Thambisetty M, Troncoso JC, Lah JJ, Levey AI, and Seyfried NT (2018). Deep proteomic network analysis of Alzheimer’s disease brain reveals alterations in RNA binding proteins and RNA splicing associated with disease. Mol Neurodegener 13, 52. [DOI] [PMC free article] [PubMed] [Google Scholar]
- Johnson JO, Mandrioli J, Benatar M, Abramzon Y, Van Deerlin VM, Trojanowski JQ, Gibbs JR, Brunetti M, Gronka S, Wuu J, et al. (2010). Exome sequencing reveals VCP mutations as a cause of familial ALS. Neuron 68, 857–864. [DOI] [PMC free article] [PubMed] [Google Scholar]
- Kanaan NM, Cox K, Alvarez VE, Stein TD, Poncil S, and McKee AC (2016). Characterization of Early Pathological Tau Conformations and Phosphorylation in Chronic Traumatic Encephalopathy. J Neuropathol Exp Neurol 75, 19–34. [DOI] [PMC free article] [PubMed] [Google Scholar]
- Kataoka K, Nagata Y, Kitanaka A, Shiraishi Y, Shimamura T, Yasunaga J, Totoki Y, Chiba K, Sato-Otsubo A, Nagae G, et al. (2015). Integrated molecular analysis of adult T cell leukemia/lymphoma. Nat Genet 47, 1304–1315. [DOI] [PubMed] [Google Scholar]
- Kim HJ, Kim NC, Wang YD, Scarborough EA, Moore J, Diaz Z, Maclea KS, Freibaum B, Li S, Molliex A, et al. (2013a). Mutations in prion-like domains in hnRNPA2B1 and hnRNPA1 cause multisystem proteinopathy and ALS. Nature. [DOI] [PMC free article] [PubMed] [Google Scholar]
- Kim NC, Tresse E, Kolaitis RM, Molliex A, Thomas RE, Alami NH, Wang B, Joshi A, Smith RB, Ritson GP, et al. (2013b). VCP Is Essential for Mitochondrial Quality Control by PINK1/Parkin and this Function Is Impaired by VCP Mutations. Neuron 78, 65–80. [DOI] [PMC free article] [PubMed] [Google Scholar]
- Koren SA, Hamm MJ, Meier SE, Weiss BE, Nation GK, Chishti EA, Arango JP, Chen J, Zhu H, Blalock EM, et al. (2019). Tau drives translational selectivity by interacting with ribosomal proteins. Acta Neuropathol 137, 571–583. [DOI] [PMC free article] [PubMed] [Google Scholar]
- Koss DJ, Jones G, Cranston A, Gardner H, Kanaan NM, and Platt B (2016). Soluble pre-fibrillar tau and beta-amyloid species emerge in early human Alzheimer’s disease and track disease progression and cognitive decline. Acta Neuropathol 132, 875–895. [DOI] [PMC free article] [PubMed] [Google Scholar]
- Lamprecht R (2019). Regulation of signaling proteins in the brain by light. Prog Neurobiol 180, 101638. [DOI] [PubMed] [Google Scholar]
- Lasagna-Reeves CA, Castillo-Carranza DL, Sengupta U, Clos AL, Jackson GR, and Kayed R (2011). Tau oligomers impair memory and induce synaptic and mitochondrial dysfunction in wild-type mice. Mol Neurodegener 6, 39. [DOI] [PMC free article] [PubMed] [Google Scholar]
- Lauren J, Gimbel DA, Nygaard HB, Gilbert JW, and Strittmatter SM (2009). Cellular prion protein mediates impairment of synaptic plasticity by amyloid-beta oligomers. Nature 457, 1128–1132. [DOI] [PMC free article] [PubMed] [Google Scholar]
- Liu J, Dou X, Chen C, Chen C, Liu C, Xu MM, Zhao S, Shen B, Gao Y, Han D, et al. (2020a). N (6)-methyladenosine of chromosome-associated regulatory RNA regulates chromatin state and transcription. Science 367, 580–586. [DOI] [PMC free article] [PubMed] [Google Scholar]
- Liu M, Sui D, Dexheimer T, Hovde S, Deng X, Wang KW, Lin HL, Chien HT, Kweon HK, Kuo NS, et al. (2020b). Hyperphosphorylation Renders Tau Prone to Aggregate and to Cause Cell Death. Mol Neurobiol 57, 4704–4719. [DOI] [PMC free article] [PubMed] [Google Scholar]
- Maraldi NM (2018). The lamin code. Biosystems 164, 68–75. [DOI] [PubMed] [Google Scholar]
- Martinez FJ, Pratt GA, Van Nostrand EL, Batra R, Huelga SC, Kapeli K, Freese P, Chun SJ, Ling K, Gelboin-Burkhart C, et al. (2016). Protein-RNA Networks Regulated by Normal and ALS-Associated Mutant HNRNPA2B1 in the Nervous System. Neuron 92, 780–795. [DOI] [PMC free article] [PubMed] [Google Scholar]
- Maziuk BF, Apicco DJ, Cruz AL, Jiang L, Ash PEA, da Rocha EL, Zhang C, Yu WH, Leszyk J, Abisambra JF, et al. (2018). RNA binding proteins co-localize with small tau inclusions in tauopathy. Acta Neuropathol Commun 6, 71. [DOI] [PMC free article] [PubMed] [Google Scholar]
- McEwan WA, Falcon B, Vaysburd M, Clift D, Oblak AL, Ghetti B, Goedert M, and James LC (2017). Cytosolic Fc receptor TRIM21 inhibits seeded tau aggregation. Proc Natl Acad Sci U S A 114, 574–579. [DOI] [PMC free article] [PubMed] [Google Scholar]
- Meier S, Bell M, Lyons DN, Rodriguez-Rivera J, Ingram A, Fontaine SN, Mechas E, Chen J, Wolozin B, LeVine H 3rd, et al. (2016). Pathological Tau Promotes Neuronal Damage by Impairing Ribosomal Function and Decreasing Protein Synthesis. J Neurosci 36, 1001–1007. [DOI] [PMC free article] [PubMed] [Google Scholar]
- Moreau K, Fleming A, Imarisio S, Lopez Ramirez A, Mercer JL, Jimenez-Sanchez M, Bento CF, Puri C, Zavodszky E, Siddiqi F, et al. (2014). PICALM modulates autophagy activity and tau accumulation. Nat Commun 5, 4998. [DOI] [PMC free article] [PubMed] [Google Scholar]
- Pinkus JL, Amato AA, Taylor JP, and Greenberg SA (2014). Abnormal distribution of heterogeneous nuclear ribonucleoproteins in sporadic inclusion body myositis. Neuromuscul Disord 24, 611–616. [DOI] [PubMed] [Google Scholar]
- Qi X, Pang Q, Wang J, Zhao Z, Wang O, Xu L, Mao J, Jiang Y, Li M, Xing X, et al. (2017). Familial Early-Onset Page’s Disease of Bone Associated with a Novel hnRNPA2B1 Mutation. Calcif Tissue Int 101, 159–169. [DOI] [PubMed] [Google Scholar]
- Rauch JN, Luna G, Guzman E, Audouard M, Challis C, Sibih YE, Leshuk C, Hernandez I, Wegmann S, Hyman BT, et al. (2020). LRP1 is a master regulator of tau uptake and spread. Nature. [DOI] [PMC free article] [PubMed] [Google Scholar]
- Ries RJ, Zaccara S, Klein P, Olarerin-George A, Namkoong S, Pickering BF, Patil DP, Kwak H, Lee JH, and Jaffrey SR (2019). m(6)A enhances the phase separation potential of mRNA. Nature 571, 424–428. [DOI] [PMC free article] [PubMed] [Google Scholar]
- Ritchie ME, Phipson B, Wu D, Hu Y, Law CW, Shi W, and Smyth GK (2015). limma powers differential expression analyses for RNA-sequencing and microarray studies. Nucleic Acids Res 43, e47. [DOI] [PMC free article] [PubMed] [Google Scholar]
- Ruan Z, Pathak D, Venkatesan K, Yoshii-Kitahara A, Muraoka S, Bhatt N, Yukawa-Takamatsu K, Hu J, Wang Y, Hersh S, et al. (2020). Alzheimer’s disease brain-derived extracellular vesicles spread tau pathology in interneurons. Brain (in press). [DOI] [PMC free article] [PubMed] [Google Scholar]
- Sanders DW, Kaufman SK, DeVos SL, Sharma AM, Mirbaha H, Li A, Barker SJ, Foley AC, Thorpe JR, Serpell LC, et al. (2014). Distinct tau prion strains propagate in cells and mice and define different tauopathies. Neuron 82, 1271–1288. [DOI] [PMC free article] [PubMed] [Google Scholar]
- Santacruz K, Lewis J, Spires T, Paulson J, Kotilinek L, Ingelsson M, Guimaraes A, DeTure M, Ramsden M, McGowan E, et al. (2005). Tau suppression in a neurodegenerative mouse model improves memory function. Science 309, 476–481. [DOI] [PMC free article] [PubMed] [Google Scholar]
- Scheltens P, Blennow K, Breteler MM, de Strooper B, Frisoni GB, Salloway S, and Van der Flier WM (2016). Alzheimer’s disease. Lancet 388, 505–517. [DOI] [PubMed] [Google Scholar]
- Shin Y, Berry J, Pannucci N, Haataja MP, Toettcher JE, and Brangwynne CP (2017). Spatiotemporal Control of Intracellular Phase Transitions Using Light-Activated optoDroplets. Cell 168, 159–171 e114. [DOI] [PMC free article] [PubMed] [Google Scholar]
- Silva JM, Rodrigues S, Sampaio-Marques B, Gomes P, Neves-Carvalho A, Dioli C, Soares-Cunha C, Mazuik BF, Takashima A, Ludovico P, et al. (2019). Dysregulation of autophagy and stress granule-related proteins in stress-driven Tau pathology. Cell Death Differ 26, 1411–1427. [DOI] [PMC free article] [PubMed] [Google Scholar]
- Sun W, Samimi H, Gamez M, Zare H, and Frost B (2018). Pathogenic tau-induced piRNA depletion promotes neuronal death through transposable element dysregulation in neurodegenerative tauopathies. Nat Neurosci 21, 1038–1048. [DOI] [PMC free article] [PubMed] [Google Scholar]
- Szklarczyk D, Gable AL, Lyon D, Junge A, Wyder S, Huerta-Cepas J, Simonovic M, Doncheva NT, Morris JH, Bork P, et al. (2019). STRING v11: protein-protein association networks with increased coverage, supporting functional discovery in genome-wide experimental datasets. Nucleic Acids Res 47, D607–D613. [DOI] [PMC free article] [PubMed] [Google Scholar]
- Thompson AD, Scaglione KM, Prensner J, Gillies AT, Chinnaiyan A, Paulson HL, Jinwal UK, Dickey CA, and Gestwicki JE (2012). Analysis of the tau-associated proteome reveals that exchange of Hsp70 for Hsp90 is involved in tau degradation. ACS Chem Biol 7, 1677–1686. [DOI] [PMC free article] [PubMed] [Google Scholar]
- Tong J, Flavell RA, and Li HB (2018). RNA m(6)A modification and its function in diseases. Front Med 12, 481–489. [DOI] [PubMed] [Google Scholar]
- Umoh ME, Dammer EB, Dai J, Duong DM, Lah JJ, Levey AI, Gearing M, Glass JD, and Seyfried NT (2018). A proteomic network approach across the ALS-FTD disease spectrum resolves clinical phenotypes and genetic vulnerability in human brain. EMBO Mol Med 10, 48–62. [DOI] [PMC free article] [PubMed] [Google Scholar]
- Vanderweyde T, Apicco DJ, Youmans-Kidder K, Ash PE, Cook C, Lummertz da Rocha E, Jansen-West K, Frame AA, Citro A, Leszyk JD, et al. (2016). Interaction of tau with the RNA-binding Protein TIA1 Regulates tau Pathophysiology and Toxicity. Cell reports 15, 1–12. [DOI] [PMC free article] [PubMed] [Google Scholar]
- Vanderweyde T, Yu H, Varnum M, Liu-Yesucevitz L, Citro A, Ikezu T, Duff K, and Wolozin B (2012). Contrasting Pathology of Stress Granule Proteins TIA-1 and G3BP in Tauopathies. J Neurosci 32, 8270–8283. [DOI] [PMC free article] [PubMed] [Google Scholar]
- Verma M, Charles RCM, Chakrapani B, Coumar MS, Govindaraju G, Rajavelu A, Chavali S, and Dhayalan A (2017). PRMT7 Interacts with ASS1 and Citrullinemia Mutations Disrupt the Interaction. J Mol Biol 429, 2278–2289. [DOI] [PubMed] [Google Scholar]
- Wang P, Joberty G, Buist A, Vanoosthuyse A, Stancu IC, Vasconcelos B, Pierrot N, Faelth-Savitski M, Kienlen-Campard P, Octave JN, et al. (2017). Tau interactome mapping based identification of Otub1 as Tau deubiquitinase involved in accumulation of pathological Tau forms in vitro and in vivo. Acta Neuropathol 133, 731–749. [DOI] [PMC free article] [PubMed] [Google Scholar]
- Wang X, Williams D, Muller I, Lemieux M, Dukart R, Maia IBL, Wang H, Woerman AL, and Schmitt-Ulms G (2019). Tau interactome analyses in CRISPR-Cas9 engineered neuronal cells reveal ATPase-dependent binding of wild-type but not P301L Tau to non-muscle myosins. Sci Rep 9, 16238. [DOI] [PMC free article] [PubMed] [Google Scholar]
- Wang Y, and Mandelkow E (2016). Tau in physiology and pathology. Nat Rev Neurosci 17, 5–21. [DOI] [PubMed] [Google Scholar]
- Wijsman EM, Pankratz ND, Choi Y, Rothstein JH, Faber KM, Cheng R, Lee JH, Bird TD, Bennett DA, Diaz-Arrastia R, et al. (2011). Genome-wide association of familial late-onset Alzheimer’s disease replicates BIN1 and CLU and nominates CUGBP2 in interaction with APOE. PLoS Genet 7, e1001308. [DOI] [PMC free article] [PubMed] [Google Scholar]
- Zaccara S, Ries RJ, and Jaffrey SR (2019). Reading, writing and erasing mRNA methylation. Nat Rev Mol Cell Biol 20, 608–624. [DOI] [PubMed] [Google Scholar]
- Zhang K, Daigle JG, Cunningham KM, Coyne AN, Ruan K, Grima JC, Bowen KE, Wadhwa H, Yang P, Rigo F, et al. (2018). Stress Granule Assembly Disrupts Nucleocytoplasmic Transport. Cell 173, 958–971 e917. [DOI] [PMC free article] [PubMed] [Google Scholar]
- Zhang K, Donnelly CJ, Haeusler AR, Grima JC, Machamer JB, Steinwald P, Daley EL, Miller SJ, Cunningham KM, Vidensky S, et al. (2015). The C9orf72 repeat expansion disrupts nucleocytoplasmic transport. Nature 525, 56–61. [DOI] [PMC free article] [PubMed] [Google Scholar]
- Zhang X, Vigers M, McCarty J, Rauch JN, Fredrickson GH, Wilson MZ, Shea JE, Han S, and Kosik KS (2020). The proline-rich domain promotes Tau liquid-liquid phase separation in cells. J Cell Biol 219. [DOI] [PMC free article] [PubMed] [Google Scholar]
- Zhou Y, Hayashi I, Wong J, Tugusheva K, Renger JJ, and Zerbinatti C (2014). Intracellular clusterin interacts with brain isoforms of the bridging integrator 1 and with the microtubule-associated protein Tau in Alzheimer’s disease. PLoS One 9, e103187. [DOI] [PMC free article] [PubMed] [Google Scholar]
Associated Data
This section collects any data citations, data availability statements, or supplementary materials included in this article.
Supplementary Materials
S Table-1_Normalization and statistics of protein intensity, Related to Fig 2.
S Table-2_Venn p0.05 up_gene list, Related to Fig 2.
S Table-3_Venn p0.05 down_gene list, Related to Fig 2.
S Table-4_Functional annotation_Reactome pathways, Related to Fig 2.
S Table-5 comparisons of tau proteomics with published dataset, Related to Fig 2.
Supplemental-Video 1_opto-Tau_first activation in SHSY5Y cell, Related to Fig 1.
Supplemental-Video 2_opto-Tau_Re-activation in SHSY5Y cell, Related to Fig 1.
Supplemental-Video 3_mcherry 1st activation in primary cortical neuron, Related to Fig 1.
Supplemental-Video 4_mcherry 2nd activation in primary cortical neuron, Related to Fig 1.
Supplemental-Video 5_opto-Tau_first activation in primary cortical neuron, Related to Fig 1.
Supplemental-Video 6_opto-Tau_second activation in primary cortical neuron, Related to Fig 1.
Data Availability Statement
Proteomics data have been attached as supplemental table-1 to this manuscript. Original western blot and immunofluorescence images have been deposited at Mendeley and are publicly available as of the date of publication. The DOI is listed in the key resources table. Microscopy data reported in this paper will be shared by the lead contact upon request.
This paper does not report original code.
Any additional information required to reanalyze the data reported in this paper is available from the lead contact upon request.