

Abstract
Introduction:
Although risk factors often co-occur, previous studies examining lifestyle or psychosocial factors often treat these factors as individual predictors of health. This study aims to identify underlying subgroups of women characterized by distinct lifestyle and psychosocial risk patterns, and investigate prospective associations between risk patterns and mortality among postmenopausal women.
Methods:
A total of 64,812 postmenopausal women aged 50–79 years without prevalent diabetes, cardiovascular disease, and cancer at baseline (1993–1998) were followed until 2019 with a mean follow-up of 14.6 (SD=6.4) years. Latent class analysis was used to identify latent classes of women with homogeneous combinations of lifestyle and psychosocial variables and test whether the classes were prospectively associated with mortality. Analyses were stratified by race/ethnicity and performed in 2020.
Results:
Four latent classes (“Healthy Lifestyle and Psychosocial,” “Risky Psychosocial,” “Risky Lifestyle,” and “Risky Lifestyle and Risky Psychosocial”) were identified for Hispanic, Black, and White Women, and 2 classes (“High Risk” or “Low Risk”) for American Indian and Asian women. Compared with the Healthy Lifestyle and Psychosocial group, the Risky Lifestyle and Risky Psychosocial group had the highest hazard ratios for all outcomes studied for all race/ethnicity groups, followed by the Risky Lifestyle group. Risky Psychosocial class was significantly associated with elevated risk of overall and cardiovascular disease mortality only in Black women.
Conclusions:
The class with concurrent risky lifestyle and psychosocial factors conveyed greatest risk of all types of mortality compared with a low-risk ref group. Health promotion should address both behavioral and psychosocial risks concurrently.
INTRODUCTION
Approximately half of annual deaths in the U.S. are attributable to modifiable lifestyle behaviors1,2 such as smoking, physical inactivity, and poor diet. Therefore, promoting positive health behaviors among older people is vital to helping them maintain functional independence and lead healthy lives.
To develop effective interventions, it is essential to have a clear understanding of the risk profiles of the target populations. Currently, only 3% of adults in the U.S. meet all 4 health behavior goals of being a nonsmoker, having a healthy weight, being physically active, and eating ≥5 fruits and vegetables a day.3 From this statistic, it is clear that multiple unhealthy behaviors often co-occur.4,5 Likewise, a growing literature has reported negative consequences for health associated with psychosocial factors such as depression, chronic stress, low social support, low optimism, and cynical hostility.6-8 Also, psychosocial factors and health behavior factors often co-occur. For example, unfavorable psychosocial factors (such as chronic stress) often trigger unhealthy behaviors as ways of coping.9,10 Previous studies examining lifestyle or psychosocial factors often empirically treat these factors as individual predictors of health. There is considerably less knowledge about how multiple risk factors cluster and how distinct clusters of multiple risk factors influence health outcomes.11
Using the Women’s Health Initiative (WHI) national prospective cohort data, this study employs latent class analysis (LCA) to identify population subgroups with distinct risk profiles and analyze and interpret higher-order interactions among multiple risks.12 How these distinct clusters of risk factors are associated with subsequent mortality outcomes is examined.
Furthermore, it is well known that there are wide variations observed in many health outcomes and psychosocial risk factors across race/ethnicity.13-15 This study also assesses whether lifestyle and psychosocial risk factor patterns and their associations with mortality differ by race/ethnicity.
METHODS
The WHI is a large prospective cohort study that addresses the major causes of morbidity and mortality in postmenopausal women. Details of the scientific rationale and eligibility requirements in the WHI have been published elsewhere.16 Briefly, a total of 161,808 women aged 50–79 years were recruited into either an Observational Study (OS) or a number of Clinical Trials from 40 clinical centers throughout the U.S. between September 1, 1993 and December 31, 1998. The current analysis used data from 93,676 women in the OS. The study was approved by IRBs at all 40 clinical centers and at the coordinating center. All participants gave written informed consent.
Study Population
All participants in the WHI OS who were free of major chronic diseases at baseline, including cancer (except non-melanoma skin cancer, n=10,197), cardiovascular disease (CVD; n=15,276), and diabetes (n=3,076) were included. Further, 315 women who joined but provided no follow-up information were excluded. A total of 64,812 women remained in the final analysis.
Measures
Exposure measures included both lifestyle and psychosocial variables measured at baseline, chosen based on prior literature. For variables that have widely accepted cut points, they were dichotomized based on those cut points; otherwise, they were split at median values to make the results conservative. A 1 was recoded as a risky behavior or factor, and 0 otherwise, with reverse scoring where necessary. LCA allows modeling variables with missing data that are assumed to be missing completely at random or missing at random.17 Missing data for study variables ranged from 0.02% for poor diet to 4.0% for hostility.
Smoking in the WHI was defined as having smoked ≥100 cigarettes during an individual’s entire life. Information collected includes smoking status (never, former, or current). For the current study, ever smokers were compared to never smokers.
Self-reported recreational physical activity was assessed by a validated questionnaire18 assessing frequency and duration of mild, moderate, and strenuous recreational exercise. Physical activity was then calculated as total MET-hours per week. The reliability and validity of the physical activity questionnaire has been confirmed previously.18,19 Physical inactivity was defined as <8.3 MET-hours per week based on the Physical Activity Guidelines for Americans.20
In the WHI, participant’s height and weight were measured by trained staff. BMI was calculated as weight in kilograms divided by height in meters squared. For the LCA, participants were categorized into obese (BMI≥30) or non-obese (BMI<30).
Daily levels of nutrients were estimated from responses to a previously validated food frequency questionnaire.21 A constructed healthy eating index (Healthy Eating Index-2005) that reflects adherence to the 2005 U.S. Dietary Guidelines was used.22 It includes 12 components, with maximum component scores ranging from 5 to 20 per component and a maximum total composite score of 100. Lower score indicated poor diet.
Poor sleep was based on the WHI Insomnia Rating Scale (WHIIRS).23 WHIIRS is computed from 5 sleep-related questions that assess sleep latency, sleep maintenance insomnia, early morning awakening, and sleep quality. Item scores range from 0 to 4. The summary score ranges from 0 to 20, where a higher score indicates greater sleep disturbance. Reliability and validity of the 5-item WHIIRS have been evaluated in 2 studies.24,25 Poor sleep was defined as ≥9. The same cut point has been widely used in previous studies investigating sleep and health-related outcomes in the WHI.26-28
Stressful life events have been long recognized as stress indicators.29 Eleven items were used to assess stressful life events.30 The responses were summed for possible ranges from 0 to 33, with higher scores indicating greater number and severity of upsetting events.
The revised version of the Life Orientation Test31 was used to assess optimism. It contains 6 items that measure constructs such as perceived control, positive expectations, and hopefulness. Lower scores on this measure indicated low optimism.
Depressive symptoms were computed from a short form of the Center for Epidemiologic Studies Depression Scale.32 The depression score ranges from 0 to 1, with a higher score indicating a greater likelihood of depression. For the LCA, a previously established cut point of 0.009 or more was used to indicate moderate or severe depression, versus lower scores for no depression.33
Social support was measured from 9 questions to indicate how often each of 9 different types of support are available to women.34 Responses were scored on a 5-point Likert scale and summed for a total scale score. A lower score indicated low social support.
Negative support/social strain is a construct that measures the negative aspects of social relations. This measure contained 4 items selected from the original 7-item scale devised by Antonucci et al.35 Higher scores on this measure indicated greater social strain.
Hostility is a trait representing a negative cynical attitude toward others. It was computed from 13 questions developed by Cook and Medley.36 The summary score was the sum of 13 true/false items resulting in a possible range from 0 to 13, where a higher score indicated greater hostility.
The primary outcomes are all-cause mortality and cause-specific mortality, including death from cancer, cardiovascular, and other causes. Cause of death was determined by multiple sources including follow-up with participants, family, friends, medical care providers, obituaries, and the National Death Index.
Covariates collected at baseline included age at enrollment, race/ethnicity, education level, history of hypertension, and physical function. For race/ethnicity, participants self-reported as American Indian, Asian, Black, Hispanic, non-Hispanic White, or other. History of hypertension was based on a positive response to a question: Did a doctor ever say that you had hypertension or high blood pressure? Physical function was measured from the quality of life subscale on physical functioning in the Rand 36-Item Health Survey. It ranges from 0 to 100, with a higher score indicating a more favorable health state.
Statistical Analysis
This study used LCA to identify underlying subgroups (latent classes) of women characterized by specific profiles of health behaviors and psychosocial factors. The Bayesian Information Criterion was used to select the best fitting latent class solution, which was considered along with interpretability of classes. Each individual was assigned to the latent class for which they had the highest posterior probability of membership. As significant variance of latent class item response profiles across different race/ethnicity groups was found, separate LCA analysis by race/ethnicity was also performed.
Cox proportional hazards models were used to assess the association between latent classes and mortality with adjustment for potential confounders. Time to death was calculated from date of enrollment to date of death, or censored at date of loss to follow-up or the end of the study period (March 1, 2019), whichever came first. The mean follow-up time was 14.6 (SD=6.4) years. Finally, several sensitivity analyses were performed to assess the impact of potential poor classification on the results by excluding individuals with the highest posterior probability <0.6 or <0.7.
Mplus, version 8.2 was used for LCA analysis. SAS, version 9.4 was used for Cox proportional hazards model analysis. Analyses were performed in 2020.
RESULTS
The LCA models were run by varying number of classes to identify the optimum number of classes using the Bayesian Information Criterion with further consideration of the interpretability of classes. A 4 latent class solution was identified for the overall study population. The item response probabilities of the 4 latent class solution are presented in Figure 1. In the 4-class solution model, 1 class was characterized by having highest proportions for both risky lifestyles and psychosocial factors and was labeled as “Risky Lifestyle and Risky Psychosocial” class (n=8,646, 13.3%). Another class was characterized by having lowest proportions for all the indicators and labeled as “Healthy Lifestyle and Psychosocial” group (n=23,373, 36.1%). One profile in-between had higher risky lifestyles but lower psychosocial factors. It was labeled the “Risky Lifestyle” class (n=15,694, 24.2%). Another profile had lower risky lifestyle but relatively higher psychosocial factors. It was labeled the “Risky Psychosocial” class (n=17,099, 26.4%).
Figure 1.

Item response probabilities among overall study population (n=64,812).
Compared with women in the Healthy Lifestyle and Psychosocial group, women in the Risky Lifestyle and Risky Psychosocial group were more likely to be younger, be Black or Hispanic women, and have a lower level of education, lower physical function score, and higher history of hypertension (Table 1).
Table 1.
Baseline Characteristics of Study Participants by Latent Classes Among 64,812 Postmenopausal Womena
| Variable | Overall, n (%) N=64,812 |
Healthy lifestyle and psychosocial, n (%) N=23,373 (36.1%) |
Risky psychosocial, n (%) N=17,099 (26.4%) |
Risky lifestyle, n (%) N=15,694 (24.2%) |
Risky lifestyle and risky psychosocial, n (%) N=8,646 (13.3%) |
|---|---|---|---|---|---|
| Age at screening, years ±SD | 63.0±7.3 | 63.5±7.2 | 63.0±7.3 | 63.0±7.3 | 61.5±7.3 |
| Race/ethnicity | |||||
| Native American | 226 (0.3%) | 58 (0.2%) | 56 (0.3%) | 64 (0.4%) | 48 (0.6%) |
| Asian | 1,998 (3.1%) | 749 (3.2%) | 576 (3.4%) | 470 (3.0%) | 203 (2.4%) |
| Black | 4,714 (7.3%) | 1,017 (4.4%) | 989 (5.8%) | 1,704 (10.9%) | 1,004 (11.6%) |
| Hispanic | 2,553 (4.0%) | 533 (2.3%) | 573 (3.4%) | 805 (5.1%) | 642 (7.4%) |
| White | 54,416 (84.2%) | 20,745 (89.0%) | 14,651 (85.9%) | 12,422 (79.3%) | 6,598 (76.5%) |
| Education | |||||
| High school or less | 13,180 (20.5%) | 3,415 (14.7%) | 2,761 (16.3%) | 4,430 (28.5%) | 2,574 (30.1%) |
| Some college/technical training | 22,968 (35.7%) | 7,531 (32.5%) | 6,117 (36.1%) | 5,889 (37.8%) | 3,431 (40.1%) |
| College or some post-college | 15,594 (24.3%) | 6,718 (29.0%) | 4,375 (25.8%) | 2,996 (19.2%) | 1,505 (17.6%) |
| Master or higher | 12,536 (19.5%) | 5,524 (23.8%) | 3,711 (21.9%) | 2,250 (14.5%) | 1,051 (12.3%) |
| Physical function score ±SD | 83.9±18.5 | 89.2±13.9 | 86.7±15.6 | 78.3±20.7 | 73.8±23.0 |
| History of hypertension | |||||
| No | 45,974 (71.5%) | 17,678 (76.2%) | 12,731 (75.0%) | 9,985 (64.3%) | 5,580 (65.2%) |
| Yes | 18,291 (28.5%) | 5,534 (23.8%) | 4,245 (25.0%) | 5,533 (35.7%) | 2,979 (34.8%) |
All characteristics were significantly different across classes (p<0.05).
As significant variance of latent class item response profiles was found across different race/ethnicity categories, separate LCA analysis by race/ethnicity was performed. Based on the Bayesian Information Criterion (Appendix Table 1), 2 classes (“Low Risk,” “High Risk”) were identified for American Indian and Asian women. For other groups, 4 classes were identified, including “Healthy Lifestyle and Psychosocial,” “Risky Psychosocial,” “Risky Lifestyle,” and “Risky Lifestyle and Risky Psychosocial” (Figure 2).
Figure 2.
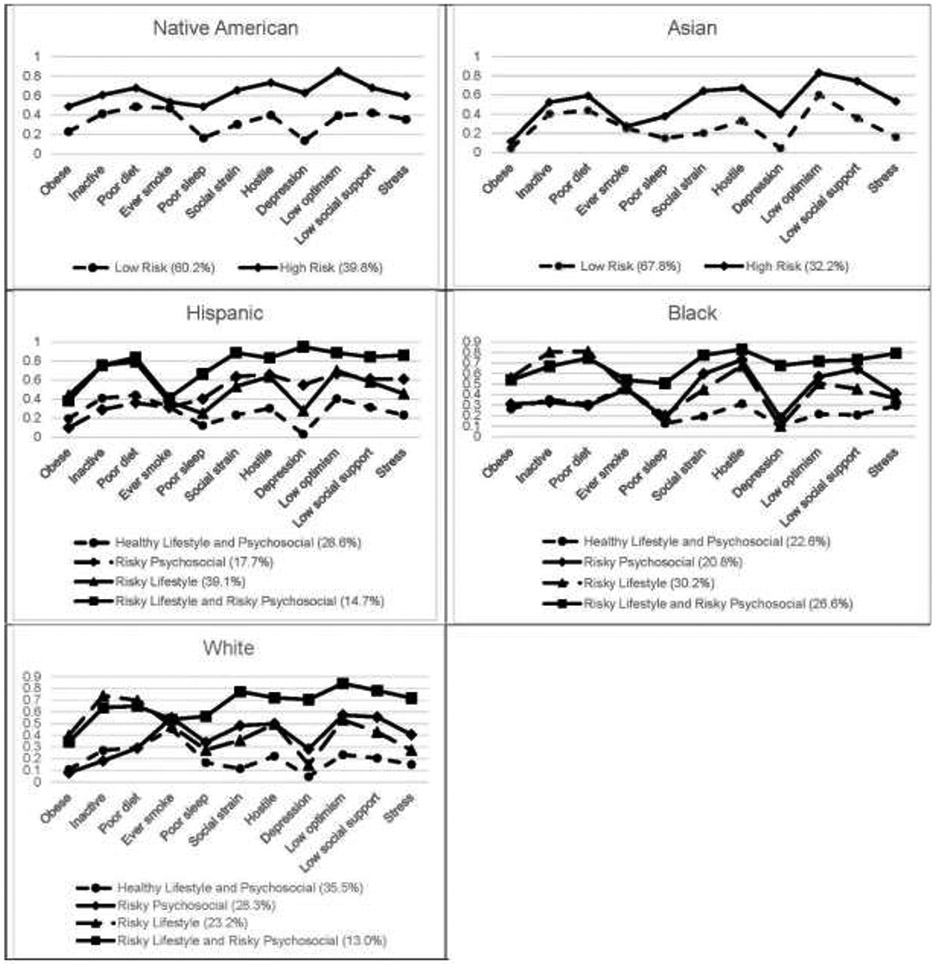
Item response probabilities by race/ethnicity.
Significant difference was not observed in overall mortality or cause-specific mortality between High-Risk and Low-Risk groups for Native American or Asian women (Table 2). For Hispanic women, women in the Risky Lifestyle and Risky Psychosocial class had the highest risk for all outcomes except for cancer. Those in the Risky Lifestyle class displayed significantly higher risk for cancer-specific mortality (hazard ratio=1.64, 95% CI=1.05, 2.54). Black women in the Risky Lifestyle and Risky Psychosocial class showed highest risk for all outcomes, followed by Risky Lifestyle class and then Risky Psychosocial class. Black women in the Risky Lifestyle class also showed significant association for all outcomes except for cancer, and in the Risky Psychosocial” class significant associations with overall mortality and CVD-specific mortality. For white women, compared with the Healthy Lifestyle and Psychosocial group, both Risky Lifestyle and Risky Lifestyle and Risky Psychosocial classes had significantly increased risk for all studied outcomes, with Risky Lifestyle and Risky Psychosocial classes having the highest hazard ratios for all outcomes (Table 2).
Table 2.
Association Between Latent Classes and Cause of Mortality by Race/Ethnicitya
| All | Cancer | CVD | Other | |||||
|---|---|---|---|---|---|---|---|---|
| Exposure | Deaths/partici pants |
HR (95% CI) |
Deaths | HR (95% CI) |
Deaths | HR (95% CI) |
Deaths | HR (95% CI) |
| Native American | ||||||||
| Low risk (60.2%) | 37/136 | ref | 8 | ref | 10 | ref | 19 | ref |
| High risk (39.8%) | 25/90 | 1.52 (0.84 2.75) | 7 | 2.69 (0.84 8.64) | 5 | 1.01 (0.29 3.44) | 13 | 1.32 (0.57 3.08) |
| Asian women | ||||||||
| Low risk (67.8%0 | 343/1,354 | ref | 96 | 100 | 147 | |||
| High risk (32.2%) | 163/644 | 1.10 (0.90 1.34) | 44 | 0.99 (0.67 1.46) | 47 | 1.16 (0.81 1.67) | 72 | 1.14 (0.85 1.54) |
| Hispanic women | ||||||||
| Healthy lifestyle and psychosocial (28.6%) | 139/730 | ref | 38 | ref | 34 | ref | 67 | ref |
| Risky psychosocial (17.7%) | 88/451 | 1.04 (0.78 1.38) | 16 | 0.79 (0.42 1.46) | 19 | 0.85 (0.47 1.55) | 53 | 1.26 (0.86 1.85) |
| Risky lifestyle (39.1%) | 226/997 | 1.26 (0.99 1.59) | 70 | 1.64 (1.05 2.54) | 58 | 1.16 (0.73 1.86) | 98 | 1.13 (0.80 1.58) |
| Risky lifestyle and risky psychosocial (14.7%) | 84/375 | 1.36 (1.01 1.82) | 11 | 0.67 (0.32 1.40) | 29 | 1.99 (1.16 3.42) | 44 | 1.39 (0.92 2.10) |
| Black women | ||||||||
| Healthy lifestyle and psychosocial (22.6%) | 249/1,064 | ref | 77 | ref | 75 | ref | 97 | ref |
| Risky psychosocial (20.8%) | 298/982 | 1.28 (1.08 1.53) | 85 | 1.18 (0.86 1.63) | 96 | 1.37 (1.00 1.87) | 117 | 1.30 (0.98 1.71) |
| Risky lifestyle (30.2%) | 486/1,415 | 1.45 (1.23 1.70) | 114 | 1.16 (0.85 1.57) | 184 | 1.79 (1.34 2.39) | 188 | 1.41 (1.09 1.84) |
| Risky lifestyle and risky psychosocial (26.6%) | 421/1,253 | 1.56 (1.32 1.86) | 123 | 1.51 (1.10 2.06) | 149 | 1.87 (1.38 2.55) | 149 | 1.39 (1.05 1.85) |
| White women | ||||||||
| Healthy lifestyle and psychosocial (35.5%) | 6,276/19,331 | ref | 1,614 | ref | 1,707 | ref | 2,955 | ref |
| Risky psychosocial (28.3%) | 4,976/15,376 | 1.03 (0.99 1.07) | 1,345 | 1.07 (0.99 1.16) | 1,309 | 1.00 (0.93 1.08) | 2,322 | 1.03 (0.97 1.08) |
| Risky lifestyle (23.2%) | 4,804/12,645 | 1.12 (1.07 1.16) | 1,284 | 1.24 (1.14 1.33) | 1,342 | 1.08 (1.00 1.17) | 2,178 | 1.07 (1.01 1.14) |
| Risky lifestyle and risky psychosocial (13.0%) | 2,539/7,064 | 1.17 (1.12 1.23) | 713 | 1.30 (1.18 1.43) | 742 | 1.24 (1.13 1.36) | 1,084 | 1.07 (0.99 1.15) |
Note: Boldface indicates statistical significance (p<0.05).
All models were adjusted for age in continuous, education level (high school or less, some college/technical school, college/some post-college, and Master’s degree or higher), history of hypertension (no, yes), and physical function in continuous.
CVD, cardiovascular disease; HR, hazard ratio.
In the sensitivity analyses after removing the highest posterior probability <0.6 or <0.7, as expected, relatively stronger associations were observed between the risky classes and outcomes when using more rigorous cut points. However, the main findings and overall patterns remained similar (Appendix Table 2A and 2B).
DISCUSSION
Four latent classes were identified for Hispanic, Black, and White women, and 2 classes for Native American and Asian women. For Hispanic, Black, and White women, compared with the Healthy Lifestyle and Psychosocial group, the Risky Lifestyle and Risky Psychosocial group had the highest hazard ratios for all outcomes with an exception for cancer specific mortality for Hispanic women, which may be due to small number of cases. Of note, the Risky Lifestyle group was associated with risk for cancer-specific mortality but not for CVD-specific mortality in Hispanic women, whereas the Risky Lifestyle group was associated with risk for CVD-specific mortality but not for cancer-specific mortality in Black women. Risky psychosocial class was significantly associated with risk of overall mortality and CVD-specific mortality only in Black women. Significant differences were not observed in overall mortality or cause-specific mortality between a High-Risk group and Low-Risk group for Native American or Asian women. This could be due to the much smaller sample size in the 2 groups, and the limited variation in the smaller sample of AsiansS.
Results in the study revealed some new associations between combinations of lifestyle and psychosocial risk factors and mortality. Those in the Risky Lifestyle and Risky Psychosocial group consistently had higher risk for all-cause mortality, cancer mortality, and CVD mortality when compared with the Healthy Lifestyle and Psychosocial group, regardless of race or ethnicity. These results support the hypothesis that the class with concurrent risky lifestyle and risky psychosocial factors conveyed greatest risk of all types of mortality and these risk factors synergistically drive mortality risk. Findings in the study indicate that a holistic approach to health promotion and disease prevention that targets multiple health behaviors and psychosocial factors jointly may optimize positive impacts on health.
Followed by the Risky Lifestyle and Risky Psychosocial group, a Risky Lifestyle group characterized by being obese, physically inactive, and having poor diet across all race/ethnicity groups was found. This group displayed significantly higher risk for all outcomes studied in White women compared with the Healthy Lifestyle and Psychosocial group. These results in White women are not surprising as lifestyles have been well-established risk factors for mortality.37,38 Of note, the Risky Lifestyle group was associated with risk for cancer-specific mortality but not for CVD-specific mortality in Hispanic women, whereas Risky Lifestyle was associated with risk for CVD-specific mortality but not for cancer-specific mortality in Black women. Reasons for this racial and ethnic difference are unclear. There is some evidence to support ethnic and racial differences in processes leading to some health outcomes in response to specific risk factors.39,40 For example, it has been observed that Hispanic people in the U.S. have a longer life expectancy than non-Hispanic White individuals despite a high prevalence of CVD risk factors and an average lower SES.39 Dietary intake and genetic predisposition may be possible explanations for the Hispanic paradox. However, among people who migrated from Mexico to the U.S., steep increases were observed in both obesity-related and smoking-related cancers, especially among postmenopausal women.41 This indicates the pre-eminent role that acculturation (immigrants adopt the unhealthy habits of the native population) can play on cancer.42 Studies have also shown that despite lower prevalence of metabolic syndrome, Black people suffer disproportionately higher CVD, type 2 diabetes, and their associated morbidity and mortality than their White counterparts.40 Higher hypertension prevalence and lower hypertension control rates in Black individuals may be another explanation for the higher CVD-specific mortality associated with Risky Lifestyle.43
A unique latent class labeled Risky Psychosocial was also found among Black, White, and Hispanic race/ethnicity groups. Individuals in this class were at risk for poorer values for psychosocial indicators. Significant associations were observed between Risky Psychosocial and all-cause and CVD-specific mortality in Black women. The Risky Psychosocial class in Black women has particularly high response probabilities for low social support and hostility, which may contribute to the increased risk for CVD mortality. Black people face daily social stressors in varying forms from racial discrimination to perceived microaggressions that may contribute to racial disparities in Black women.44,45 Thus, social support may play an important role in reducing this stress and mitigating this risk of mortality in Black women.
Strengths of the study include the large and diverse sample representing regions across the country, the long follow-up, and the availability of multiple risk variables and covariates. This study is also unique in that multiple health behaviors and psychosocial factors were considered simultaneously and examined prospectively the relationship between latent class membership and health outcomes.
Limitations
Limitations include the self-report nature of many of the variables, including race/ethnicity. Self-reported race/ethnicity is a social construct and is likely distinct from true ancestral heritage. Lifestyle and psychosocial variables were assessed at baseline and so changes after baseline are not assessed. Another limitation is the dichotomization of most risk indicators in LCA. Although the dichotomization makes interpretations of LCA results for each indicator easier, the method may lose information and lead to measurement misclassification. Dichotomization also resulted in low entropy. In addition, owing to the large sample size, the best solutions in White women and the overall study population were chosen on the basis of interpretability, which may be subjective. Regardless, the chosen 4-class solution captured an interpretable mix of lifestyle and psychosocial variables, whereas solutions with more latent classes were increasingly ambiguous. Another limitation is that individuals were assigned their most likely classes based on the highest posterior probability of membership and did not take into account the uncertainty of the classification. Finally, the sample was restricted to postmenopausal women and findings may not generalize to other populations.
CONCLUSIONS
Women with combinations of both higher risky lifestyle and risky psychosocial factors had greater risk of mortality compared with a low-risk ref group. Racial differences were observed and future research on how lifestyles in combination with psychosocial factors influence health and mortality by race/ethnicity is warranted. Programmatic efforts at health promotion and disease prevention may benefit from a holistic approach that considers both lifestyle and psychosocial risks jointly.
Supplementary Material
ACKNOWLEDGMENTS
The Women’s Health Initiative (WHI) program is funded by the National Heart, Lung, and Blood Institute, NIH, HHS through contracts HHSN268201600018C, HHSN268201600001C, HHSN268201600002C, HHSN268201600003C, and HHSN268201600004C. A short list of WHI investigators is in an Appendix file.
Footnotes
Publisher's Disclaimer: This is a PDF file of an unedited manuscript that has been accepted for publication. As a service to our customers we are providing this early version of the manuscript. The manuscript will undergo copyediting, typesetting, and review of the resulting proof before it is published in its final form. Please note that during the production process errors may be discovered which could affect the content, and all legal disclaimers that apply to the journal pertain.
REFERENCES
- 1.Aneni EC, Crippa A, Osondu CU, Valero-Elizondo J, Younus A, Nasir K, et al. Estimates of mortality benefit from ideal cardiovascular health metrics: a dose response meta-analysis. J Am Heart Assoc. 2017;6(12). 10.1161/jaha.117.006904. [DOI] [PMC free article] [PubMed] [Google Scholar]
- 2.Wilkins JT, Ning H, Berry J, Zhao L, Dyer AR, Lloyd-Jones DM. Lifetime risk and years lived free of total cardiovascular disease. JAMA. 2012;308(17):1795–1801. 10.1001/jama.2012.14312. [DOI] [PMC free article] [PubMed] [Google Scholar]
- 3.Virani SS, Alonso A, Benjamin EJ, Bittencourt MS, Callaway CW, Carson AP, et al. Heart disease and stroke statistics – 2020 update: a report from the American Heart Association. Circulation. 2020;141(9):e139–e596. 10.1161/CIR.0000000000000757. [DOI] [PubMed] [Google Scholar]
- 4.Fine LJ, Philogene GS, Gramling R, Coups EJ, Sinha S. Prevalence of multiple chronic disease risk factors – 2001 National Health Interview Survey. Am J Prev Med. 2004;27(2):18–24. 10.1016/j.amepre.2004.04.017. [DOI] [PubMed] [Google Scholar]
- 5.Pronk NP, Anderson LH, Crain AL, Martinson BC, O’Connor PJ, Sherwood NE, et al. Meeting recommendations for multiple healthy lifestyle factors: prevalence, clustering, and predictors among adolescent, adult, and senior health plan members. Am J Prev Med. 2004;27(2):25–33. 10.1016/j.amepre.2004.04.022. [DOI] [PubMed] [Google Scholar]
- 6.Tindle HA, Chang YF, Kuller LH, Manson JE, Robinson JG, Rosal MC, et al. Optimism, cynical hostility, and incident coronary heart disease and mortality in the Women’s Health Initiative. Circulation. 2009;120(8):656–662. 10.1161/circulationaha.108.827642. [DOI] [PMC free article] [PubMed] [Google Scholar]
- 7.Phillips AC, Der G, Carroll D. Stressful life-events exposure is associated with 17-year mortality, but it is health-related events that prove predictive. Br J Health Psychol. 2008; 13(4):647–657. 10.1348/135910707x258886. [DOI] [PubMed] [Google Scholar]
- 8.Wei J, Hou R, Zhang X, Xu H, Xie L, Chandrasekar EK, et al. The association of late-life depression with all-cause and cardiovascular mortality among community-dwelling older adults: systematic review and meta-analysis. Br J Psychiatry. 2019;215(2):449–455. 10.1192/bjp.2019.74. [DOI] [PubMed] [Google Scholar]
- 9.Jackson JS, Knight KM, Rafferty JA. Race and unhealthy behaviors: chronic stress, the HPA axis, and physical and mental health disparities over the life course. Am J Public Health. 2010;100(5):933–939. 10.2105/ajph.2008.143446. [DOI] [PMC free article] [PubMed] [Google Scholar]
- 10.Lim S, Tellez M, Ismail AI. Chronic stress and unhealthy dietary behaviors among low-income African-American female caregivers. Curr Dev Nutr. 2020;4(3):nzaa029. 10.1093/cdn/nzaa029. [DOI] [PMC free article] [PubMed] [Google Scholar]
- 11.Pronk NP, Anderson LH, Crain AL, et al. Meeting recommendations for multiple healthy lifestyle factors: prevalence, clustering, and predictors among adolescent, adult, and senior health plan members. Am J Prev Med. 2004;27(2 Suppl):25–33. 10.1016/j.amepre.2004.04.022. [DOI] [PubMed] [Google Scholar]
- 12.Lanza ST, Rhoades BL, Greenberg MT, Cox M, the Family Life Project Key Investigators. Modeling multiple risks during infancy to predict quality of the caregiving environment: contributions of a person-centered approach. Infant Behav Dev. 2011;34(3):390–406. 10.1016/j.infbeh.2011.02.002. [DOI] [PMC free article] [PubMed] [Google Scholar]
- 13.Burroughs Pena MS, Mbassa RS, Slopen NB, Williams DR, Buring JE, Albert MA. Cumulative psychosocial stress and ideal cardiovascular health in older women: data by race/ethnicity. Circulation. 2019;139(17):2012–2021. 10.1161/circulationaha.118.033915. [DOI] [PMC free article] [PubMed] [Google Scholar]
- 14.Bailey RK, Mokonogho J, Kumar A. Racial and ethnic differences in depression: current perspectives. Neuropsychiatr Dis Treat. 2019;15:603–609. 10.2147/ndt.s128584. [DOI] [PMC free article] [PubMed] [Google Scholar]
- 15.Zuelsdorff M, Okonkwob OC, Norton D, et al. Stressful life events and racial disparities in cognition among middle-aged and older adults. J Alzheimers Dis. 2020;73(2):671–682. 10.3233/jad-190439. [DOI] [PMC free article] [PubMed] [Google Scholar]
- 16.The Women’s Health Initiative Study Group. Design of the Women’s Health Initiative clinical trial and observational study. Control Clin Trials. 1998;19(1):61–109. 10.1016/s0197-2456(97)00078-0. [DOI] [PubMed] [Google Scholar]
- 17.Schafer JL, Graham JW. Missing data: our view of the state of the art. Psychol Methods. 2002;7(2):147–177. [PubMed] [Google Scholar]
- 18.Johnson-Kozlow M, Rock CL, Gilpin EA, Hollenbach KA, Pierce JP. Validation of the WHI brief physical activity questionnaire among women diagnosed with breast cancer. Am J Health Behav. 2007;31(2):193–202. 10.5993/ajhb.31.2.8. [DOI] [PubMed] [Google Scholar]
- 19.Meyer AM, Evenson KR, Morimoto L, Siscovick D, White E. Test–retest reliability of the Women’s Health Initiative physical activity questionnaire. Med Sci Sports Exerc. 2009;41(3):530–538. 10.1249/mss.0b013e31818ace55. [DOI] [PMC free article] [PubMed] [Google Scholar]
- 20.HHS. Physical Activity Guidelines for Americans. 2nd ed. https://health.gov/sites/default/files/2019-09/Physical_Activity_Guidelines_2nd_edition.pdf. Published 2018. Accessed April 15, 2021. [Google Scholar]
- 21.Patterson RE, Kristal AR, Tinker LF, Carter RA, Bolton MP, Agurs-Collins T. Measurement characteristics of the Women’s Health Initiative food frequency questionnaire. Ann Epidemiol. 1999;9(3):178–187. 10.1016/s1047-2797(98)00055-6. [DOI] [PubMed] [Google Scholar]
- 22.Guenther P, Reedy J, Krebs-Smith S, Reeve B, Basiotis P. Development and evaluation of the healthy eating index–2005: technical report. Alexandria, VA: Center for Nutrition Policy and Promotion, U.S. Department of Agriculture; 2007. http://hdl.handle.net/10919/18682. Accessed May 25, 2021. [Google Scholar]
- 23.Levine DW, Kaplan RM, Kripke DF, Bowen DJ, Naughton MJ, Shumaker SA. Factor structure and measurement invariance of the Women’s Health Initiative Insomnia Rating Scale. Psychol Assess. 2003;15(2):123–136. 10.1037/1040-3590.15.2.123. [DOI] [PubMed] [Google Scholar]
- 24.Levine DW, Kripke DF, Kaplan RA, et al. Reliability and validity of the Women’s Health Initiative Insomnia Rating Scale. Psychol Assess. 2003;15(2):137–148. 10.1037/1040-3590.15.2.137. [DOI] [PubMed] [Google Scholar]
- 25.Levine DW, Kaplan RM, Kripke DF, Bowen DJ, Naughton MJ, Shumaker SA. Factor structure and measurement invariance of the Women’s Health Initiative Insomnia Rating Scale. Psychol Assess. 2003;15(2):123–136. 10.1037/1040-3590.15.2.123. [DOI] [PubMed] [Google Scholar]
- 26.Levine DW, Kripke DF, Kaplan RA, et al. Reliability and validity of the Women’s Health Initiative Insomnia Rating Scale. Psychol Assess. 2003;15(2):137–48. 10.1037/1040-3590.15.2.137. [DOI] [PubMed] [Google Scholar]
- 27.Zaslavsky O, LaCroix AZ, Hale L, Tindle H, Shochat T. Longitudinal changes in insomnia status and incidence of physical, emotional, or mixed impairment in postmenopausal women participating in the Women’s Health Initiative (WHI) study. Sleep Med. 2015;16(3):364–371. 10.1016/j.sleep.2014.11.008. [DOI] [PubMed] [Google Scholar]
- 28.Kabat GC, Xue X, Kamensky V, et al. The association of sleep duration and quality with all-cause and cause-specific mortality in the Women’s Health Initiative. Sleep Med. 2018;50:48–54. 10.1016/j.sleep.2018.05.015. [DOI] [PubMed] [Google Scholar]
- 29.Holmes TH, Rahe RH. The Social Readjustment Rating Scale. J Psychosom Res.1967;11(2):213–218. 10.1016/0022-3999(67)90010-4. [DOI] [PubMed] [Google Scholar]
- 30.Ruberman W, Weinblatt E, Goldberg JD, Chaudhary BS. Psychosocial influences on mortality after myocardial infarction. N Engl J Med. 1984;311(9):552–559. 10.1056/nejm198408303110902. [DOI] [PubMed] [Google Scholar]
- 31.Scheier MF, Carver CS, Bridges MW. Distinguishing optimism from neuroticism (and trait anxiety, self-mastery, and self-esteem) – a reevaluation of the Life Orientation Test. J Pers Soc Psychol. 1994;67(6):1063–1078. 10.1037/0022-3514.67.6.1063. [DOI] [PubMed] [Google Scholar]
- 32.Burnam MA, Wells KB, Leake B, Landsverk J. Development of a brief screening instrument for detecting depressive disorders. Med Care. 1988;26(8):775–789. 10.1097/00005650-198808000-00004. [DOI] [PubMed] [Google Scholar]
- 33.Burnam MA, Wells KB, Leake B, Landsverk J. Development of a brief screening instrument for detecting depressive disorders. Med Care. 1988;26(8):775–789. 10.1097/00005650-198808000-00004. [DOI] [PubMed] [Google Scholar]
- 34.Sherbourne CD, Stewart AL. The MOS social support survey. Soc Sci Med. 1991;32(6):705–714. 10.1016/0277-9536(91)90150-b. [DOI] [PubMed] [Google Scholar]
- 35.Antonucci TA, Kahn RC, Akiyama H. Psychosocial factors and the response to cancer symptoms. In Yancid R, Yates JW, eds. Cancer in the Elderly: Approaches to Early Detection and Treatment. New York, NY: Spring; 1989. [Google Scholar]
- 36.Cook WW, Medley DM. Proposed hostility and Pharisaic-virtue scales for the MMPI. J Appl Psychol. 1954;38(6):414–418. 10.1037/h0060667. [DOI] [Google Scholar]
- 37.Reedy J, Krebs-Smith SM, Miller PE, et al. Higher diet quality is associated with decreased risk of all-cause, cardiovascular disease, and cancer mortality among older adults. J Nutr. 2014;144(6):881–889. 10.3945/jn.113.189407. [DOI] [PMC free article] [PubMed] [Google Scholar]
- 38.Flegal KM, Kit BK, Orpana H, Graubard BI. Association of all-cause mortality with overweight and obesity using standard body mass index categories: a systematic review and meta-analysis. JAMA. 2013;309(1):71–82. 10.1001/jama.2012.113905. [DOI] [PMC free article] [PubMed] [Google Scholar]
- 39.Medina-Inojosa J, Jean N, Cortes-Bergoderi M, Lopez-Jimenez F. The Hispanic paradox in cardiovascular disease and total mortality. Prog Cardiovasc Dis. 2014;57(3):286–292. 10.1016/j.pcad.2014.09.001. [DOI] [PubMed] [Google Scholar]
- 40.Osei K, Gaillard T. Disparities in cardiovascular disease and type 2 diabetes risk factors in Blacks and Whites: dissecting racial paradox of metabolic syndrome. Front Endocrinol (Lausanne). 2017;8:204. 10.3389/fendo.2017.00204. [DOI] [PMC free article] [PubMed] [Google Scholar]
- 41.Pinheiro PS, Callahan KE, Stern MC, de Vries E. Migration from Mexico to the United States: a high-speed cancer transition. Int J Cancer. 2018;142(3):477–488. 10.1002/ijc.31068. [DOI] [PMC free article] [PubMed] [Google Scholar]
- 42.Abraido-Lanza AF, Chao MT, Florez KR. Do healthy behaviors decline with greater acculturation? Implications for the Latino mortality paradox. Soc Sci Med. 2005;61(6):1243–1255. 10.1016/j.socscimed.2005.01.016. [DOI] [PMC free article] [PubMed] [Google Scholar]
- 43.Lackland DT. Racial differences in hypertension: implications for high blood pressure management. Am J Med Sci. 2014;348(2):135–138. 10.1097/MAJ.0000000000000308. [DOI] [PMC free article] [PubMed] [Google Scholar]
- 44.Lewis TT, Williams DR, Tamene M, Clark CR. Self-reported experiences of discrimination and cardiovascular disease. Curr Cardiovasc Risk Rep. 2014;8(1):365. 10.1007/s12170-013-0365-2. [DOI] [PMC free article] [PubMed] [Google Scholar]
- 45.Black LL, Johnson R, VanHoose L. The relationship between perceived racism/discrimination and health among black American women: a review of the literature from 2003 to 2013. J Racial Ethn Health Disparities. 2015;2(1):11–20. 10.1007/s40615-014-0043-1. [DOI] [PMC free article] [PubMed] [Google Scholar]
Associated Data
This section collects any data citations, data availability statements, or supplementary materials included in this article.