

Abstract
Objective:
To determine the difference in rate of weight gain from birth to five years based on exposure to maternal group B Streptococcal (GBS) intrapartum antibiotic prophylaxis (IAP).
Design:
Retrospective cohort study of 13,804 infants.
Setting:
Two perinatal centers and a primary pediatric care network in Philadelphia
Participants:
Term infants born 2007–2012, followed longitudinally from birth to 5 years of age.
Exposures:
GBS IAP defined as penicillin, ampicillin, cefazolin, clindamycin or vancomycin administered ≥4 hours prior to delivery to the mother. Reference infants were defined as born to mothers without (vaginal delivery) or with other (cesarean delivery) intrapartum antibiotic exposure.
Outcomes:
Difference in rate of weight change from birth to 5 years was assessed using longitudinal rate regression. Analysis was a priori stratified by delivery mode and adjusted for relevant covariates.
Results:
GBS IAP was administered to mothers of 2,444/13,804 (17.7%) children. GBS IAP-exposed children had a significantly elevated rate of weight gain in the first 5 years among vaginally-born (adjusted rate difference 1.44% [95% CI, 0.3%–2.6%]) and cesarean-born (3.52% [95% CI, 1.9%–5.2%]) children. At 5 years, the rate differences equated to an additional 0.24 kilograms among vaginally-born children and 0.60 kilograms among cesarean-born children.
Conclusion:
GBS-specific IAP was associated with a modest increase in rate of early childhood weight gain. GBS IAP is an effective intervention to prevent perinatal GBS disease-associated morbidity and mortality. However, these findings highlight the need to better understand effects of intrapartum antibiotic exposure on childhood growth and support efforts to develop alternate prevention strategies.
Keywords: Neonatology, Growth, Obesity
INTRODUCTION
The prevalence of childhood obesity in the United States increased from 13.9% in 1999–2000 to 18.5% in 2015–2016.1 Preclinical studies demonstrate a role for the gut microbiome in the development of obesity via altered metabolic and inflammatory signaling and increased energy extraction from ingested diet.2,3 The newborn gut microbiome is shaped by the maternal microbiome, and further develops over the first 3 years after birth.4,5 Relatively brief antibiotic exposures during the perinatal period can cause enduring changes in the composition and diversity of the microbiome.6,7 Human epidemiological studies have found inconsistent relationships between early antibiotic use and obesity.8–10 A meta-analysis of 15 cohort studies reported increased relative risk for being overweight associated with antenatal and early childhood antibiotic exposure.11 However, none of the studies accounted for intrapartum antibiotics administered to the mother and newborn during the critical period of colonization by pioneer species.4,6
Intrapartum antibiotic prophylaxis (IAP) is recommended for the prevention of neonatal early-onset disease caused by Group B Streptococcus (GBS) or in response to concern for intraamniotic infection.12,13 These indications combined result in ~25–30% of American women and their newborns exposed to intrapartum antibiotics.14 In addition, prophylactic antibiotics are recommended for women undergoing cesarean section to prevent surgical site infections.15 Recent reports document differences in the initial constitution of the neonatal gut microbiota when intrapartum antibiotics are administered.6,7,16 Such changes are not unexpected. GBS IAP is given with the intent of altering the newborn’s initial microbial exposure at delivery, to decrease GBS colonization and infection. Whether such antibiotic-mediated changes are associated with changes in childhood weight gain is unknown.
Childhood obesity is a multifactorial disease, with contributions from genetic predisposition and environmental factors, such as exercise and diet. Experimental studies find that early-life antibiotic-mediated dysbiosis results in excessive weight gain among animals exposed to an obesogenic postnatal environment.2,3 We hypothesized that GBS IAP enhances the rate of weight gain, when adjusting for confounders. Such a shift in the rate of childhood weight gain would result in a child being heavier than they would have been if not exposed to GBS IAP, and among susceptible individuals could result in obesity. To test this hypothesis, we utilized a large birth cohort to determine whether GBS IAP was associated with an altered weight gain trajectory in early childhood.
METHODS
Design/Setting:
This was a retrospective cohort study. Medical records of infants born during 2007–2012 at two birth hospitals were linked with records of infants who established care within one month from birth in a pediatric primary care network (Figure 1). Linking was accomplished for 15,986 children using deterministic matching of names, birth date, sex, address, and birth hospital and was manually audited for 1% of linked children using each variable. Information was obtained for mothers and their infants from the inpatient birth admission, and for the child for subsequent outpatient, inpatient and emergency department care obtained within the study pediatric facilities. Data sources and definitions are detailed in Supplementary Table 1. Waiver of consent and study approval were obtained from the institutional review boards at University of Pennsylvania and Children’s Hospital of Philadelphia. CDC was determined non-engaged in human subjects’ research.
Figure 1. Derivation of study cohort.
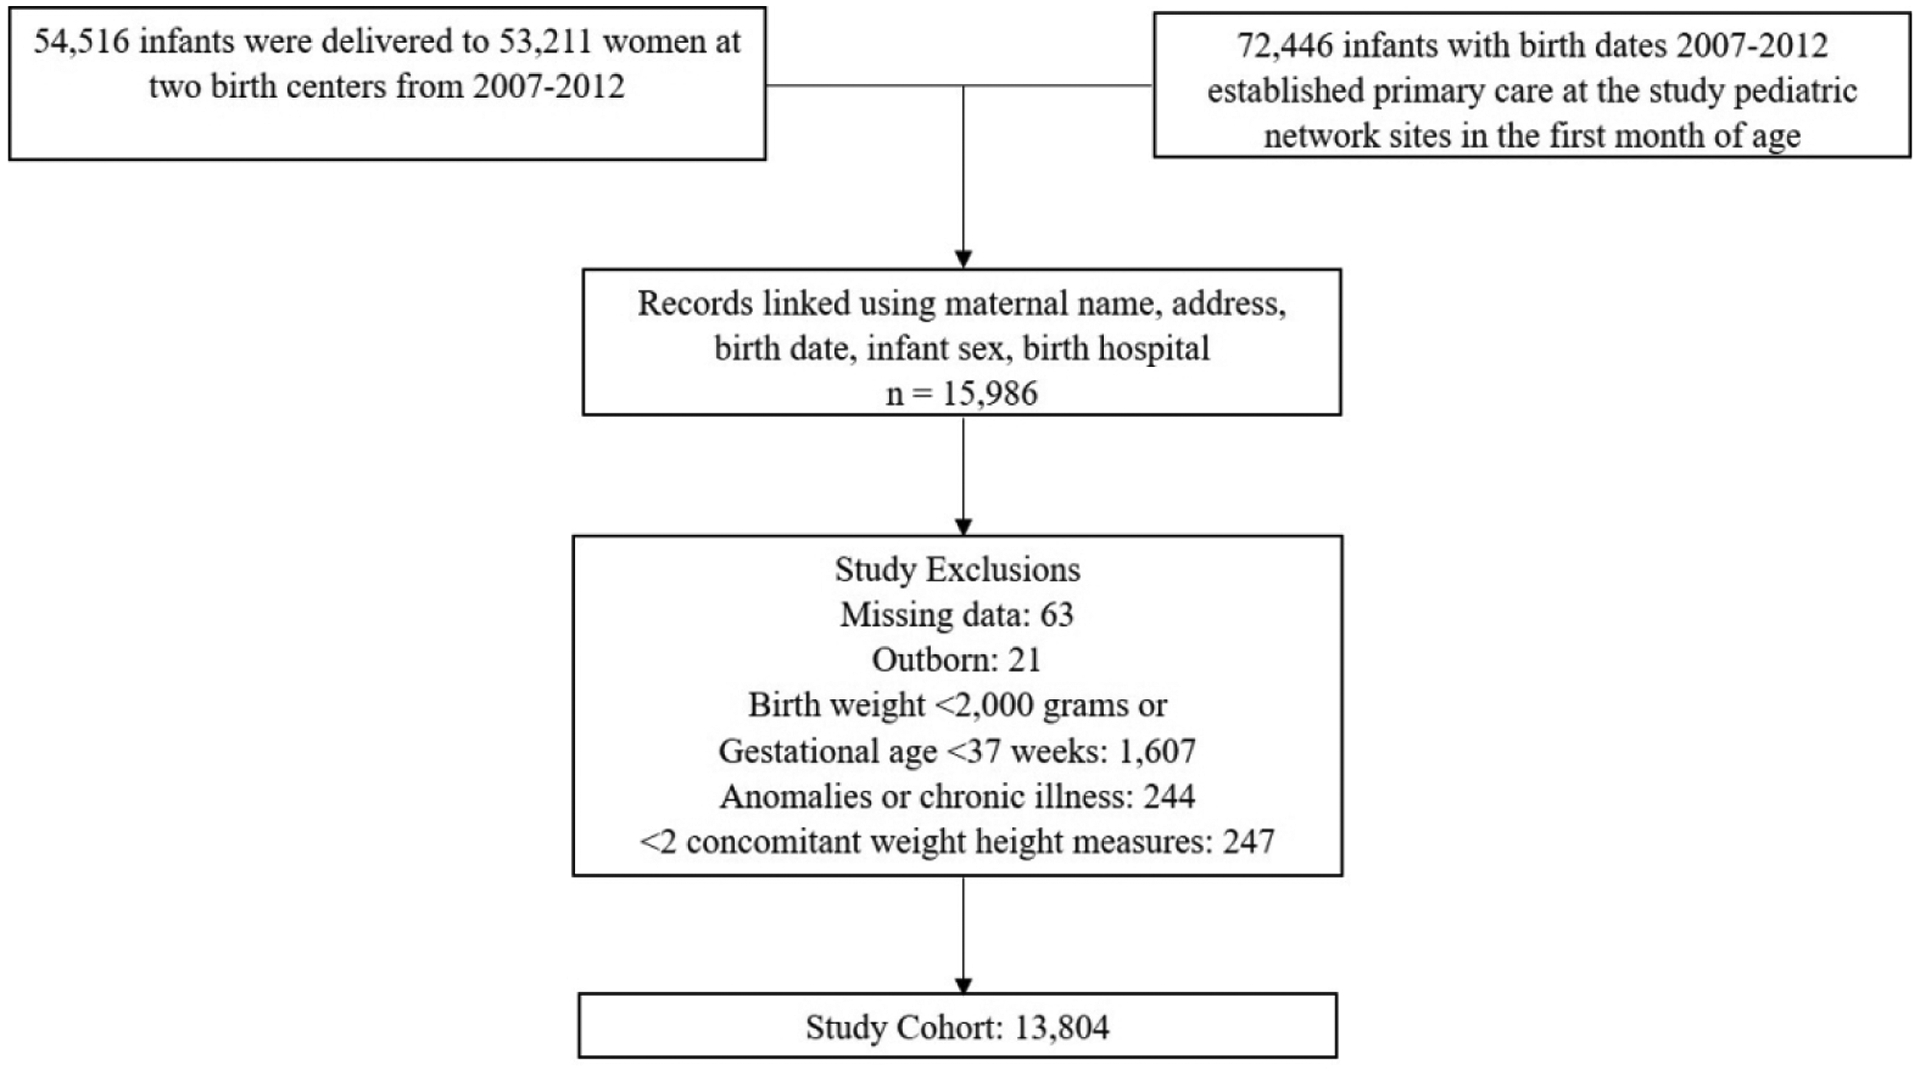
Figure describes the process of creating a longitudinal database by linking medical records from birth admission with pediatric visits records and lists exclusion criteria.
Population:
Infants born ≥37 weeks’ gestation with birth weight ≥2,000 grams were included in the study. Those with missing delivery room data, major congenital anomaly or condition (detected ≤6 months of age) that may impact exposure or outcome, or <2 paired weight and height values were excluded (Figure 1). Congenital conditions were identified based on previously published criteria.17 Children were retained in the cohort to 5 years completed age (2012–2017) or until they left the outpatient practice.
Exposure:
GBS IAP was defined as administration of intravenous penicillin, ampicillin, cefazolin, clindamycin or vancomycin to the mother ≥4 hours prior to delivery during the hospital admission leading to birth. This definition was based on national GBS perinatal prevention guidelines used during the study period.14,18 All other forms of intravenous antibiotics were classified as “other” antibiotics, including GBS IAP antibiotics and surgical prophylaxis for cesarean delivery administered <4 hours prior to delivery. National guidelines consider vancomycin and clindamycin as inadequate GBS prophylaxis. To address this, we conducted a sensitivity analysis with women administered vancomycin or clindamycin alternately categorized as receiving ‘other antibiotics’.
Analytic groups:
Analysis was a priori stratified by mode of delivery into vaginal and cesarean delivery cohort. The exposure definition was the same for both cohorts. For the vaginal cohort, the reference group comprised of mothers with no intrapartum antibiotic exposure. For the cesarean cohort, the reference group comprised of mothers with intrapartum antibiotic exposure that did not meet the definition for GBS IAP, including antibiotics administered for surgical prophylaxis.
Outcome:
The primary outcome was weight change over time, adjusted for height. Weight measures were obtained by trained clinical personnel during preventative pediatric office visits, using equipment that is regularly calibrated for clinical use. Only weights documented in well-child visits were included to avoid weight fluctuations associated with acute illness. An automated method was used for excluding erroneous weight measures.8,19 Each weight was paired with a concomitant height measure obtained at the same visit. The model adjusted for sex of the child and age of the child at the time of measurement.
Covariates:
A priori covariates were chosen for potential association with exposure and/or outcome and included maternal race, maternal weight and height at delivery, parity, maternal GBS colonization, clinical choriomanionitis, infant sex, birth weight z-score for gestation measured using Fenton growth charts20 and infant insurance at initial pediatric clinic visit.21–24 Birth year and month were included to account for secular trends, and primary pediatric care site to account for center-based variation in antibiotic prescribing. We linked the first residential address of the child with the American Community Survey Block Group data (2009–2012) to obtain social markers known to be associated with health and disparities in Philadelphia neighborhoods.25,26 Post-exposure variables included neonatal antibiotics, breastfeeding at 3 months and pediatric outpatient antibiotic prescriptions (Supplementary Table 1).
Analysis:
Differences in growth rates across maternal antibiotic groups were estimated using a Longitudinal Rate Regression (LRR) modeling approach previously described.8 Regression B-splines with knots at 0.4, 1.4 and 2.7 years were used to model non-linear changes in weight over time. Both linear and quadratic terms were used for concomitantly measured height in the primary model with weight adjusted for height as outcome. Separate models for weight (without height) as outcome were also developed due to the greater potential for error in capture of height/length compared to weight. The LRR model adjusted all covariates at both the mean level (expected to impact the overall size) and at the rate level (expected to influence rate of growth in addition to impacting overall size). Outpatient pediatric antibiotic exposure, however, was adjusted only to the rate level to accommodate the time-varying nature of this exposure. The estimated rate difference for exposed infants can be interpreted as the percentage difference in the rate of weight change for an exposed infant compared to an unexposed infant, where all other rate level covariates are zero. All covariates adjusted for at the rate level were centered on their sample mean such that the estimated difference in the rate of change for the primary exposure can be interpreted for a “typical” child in the cohort. Correlation between repeated measures on an individual were accounted for by inclusion of random effects. Patients who were lost to follow-up were accounted for by using random effects in the model, under a missing at random assumption.27 Estimated absolute weight and body mass index (BMI) differences were calculated to provide an illustrative interpretation for the final models. Rate difference and confidence limits from the final model were multiplied with the estimated weight and height gains in the reference group for each stratum to generate the expected absolute weight and BMI differences at 5 years. Analyses were performed using SAS 9.4 (Cary, NC) and R version 3.5.3.
RESULTS
The study included 13,804 children and 59,324 person-years of observation (Figure 1). 2,444 children were exposed to GBS IAP. Mothers and children exposed to GBS IAP differed in multiple characteristics from the reference population in both delivery cohorts (Table 1).28 Birth months and years were similar between exposed and unexposed children (data not shown). The study cohort retained 10,358 (75%) children through 4 years of age. Differences in demographics of censored and retained infants (Supplementary Table 2) were accounted for in the final model. Median age at first pediatric visit was 5 days (IQR, 4–7). Median weight-height measures contributed per child was 11 (IQR, 8–12). Anthropometric measures per child per year are shown in Supplementary Table 3.
Table 1.
Characteristics of the study cohort
| Characteristics n (%), median (Q1, Q3) or mean ± SD |
Total | Vaginal cohorl (n=9539) | Cesarean cohort (n=4265) | |||||
|---|---|---|---|---|---|---|---|---|
| n=13804 | No IAP (n=6867) | GBS IAP (n=1878) | Other (n=794) | p-value | GBS IAP (n=566) | Other (n=3699) | p-value | |
| Maternal age (years) a | 28 (23, 33) | 28 (23, 33) | 26 (21, 31) | 27 (22, 31) | <0.001 | 25 (21, 31) | 30 (25, 35) | <0.001 |
| Maternal race/ethnicity | <0.001 | <0.001 | ||||||
| Black (Non-Hispanic) | 7967 (57.7) | 3923 (57.1) | 1270 (67.6) | 511 (64.4) | 386 (68.2) | 1877 (50.7) | ||
| White (Non-Hispanic) | 3656 (26.5) | 1778 (25.9) | 393 (20.9) | 159 (20.0) | 109 (19.2) | 1217 (33.0) | ||
| Asian | 977 (7.1) | 558 (8.1) | 85 (4.5) | 61 (7.7) | 30 (5.3) | 243 (6.6) | ||
| Hispanic | 471 (3.4) | 237 (3.5) | 49 (2.6) | 27 (3.4) | 9 (1.6) | 149 (4.0) | ||
| Unknown/Other | 733 (5.3) | 371 (5.4) | 81 (4.3) | 36 (4.5) | 32 (5.7) | 213 (5.8) | ||
| Maternal BMI a | <0.001 | 0.01 | ||||||
| Underweight | 23 (0.2) | 19 (0.3) | 2 (0.1) | 0 | 0 | 2 (0.1) | ||
| Normal | 1823 (13.2) | 1142 (16.7) | 227 (12.1) | 125 (15.7) | 39 (6.9) | 290 (7.8) | ||
| Overweight | 4897 (35.5) | 2661 (38.8) | 618 (32.9) | 273 (34.4) | 148 (26.2) | 1197 (32.4) | ||
| Obese | 7046 (51.0) | 3033 (44.2) | 1031 (54.9) | 396 (49.9) | 378 (66.9) | 2208 (59.7) | ||
| Primipara a | 6266 (45.4) | 2940 (43.3) | 1031 (55.1) | 320 (40.8) | <0.001 | 439 (78.0) | 1536 (41.9) | <0.001 |
| GBS status | <0.001 | <0.001 | ||||||
| GBS negative | 9167 (66.4) | 6017 (87.6) | 60 (3.2) | 249 (31.4) | 31 (5.5) | 2810 (76.0) | ||
| GBS positive | 3863 (28.0) | 426 (6.2) | 1773 (94.4) | 520 (65.5) | 523 (92.4) | 621 (16.8) | ||
| GBS unknown | 774 (5.6) | 424 (6.2) | 45 (2.4) | 25 (3.2) | 12 (2.1) | 268 (7.3) | ||
| Chorioamnionitis | 768 (5.6) | 83 (1.2) | 111 (5.9) | 208 (26.2) | <0.001 | 99 (17.5) | 267 (7.2) | <0.001 |
| Academic pediatric clinic | 10676 (77.3) | 5382 (78.4) | 1533 (81.6) | 652 (82.1) | 0.001 | 450 (79.5) | 2659 (71.9) | <0.001 |
| Infant sex, female | 6800 (49.3) | 3482 (50.7) | 903 (48.1) | 389 (49.0) | 0.11 | 256 (45.2) | 1770 (47.9) | 0.25 |
| Gestational age (weeks) | 39.4 ± 1.1 | 39.4 ± 1.1 | 39.5 ± 1.2 | 39.5 ± 1.1 | 0.007 | 39.9 ± 1.2 | 39.4 ± 1.2 | <0.001 |
| Birth weight (grams) | 3318±456 | 3293 ± 439 | 3315 ±435 | 3296±419 | 0.21 | 3429 ± 480 | 3353 ±495 | <0.001 |
| Insurance | 0.01 | <0.001 | ||||||
| Medicaid | 6051 (43.8) | 3024 (44.0) | 902 (48.0) | 389 (49.0) | 276 (48.8) | 1460 (39.5) | ||
| Private | 7339 (53.2) | 3637 (53.0) | 914 (48.7) | 384 (48.4) | 271 (48.9) | 2133 (57.7) | ||
| Missing | 414 (3.0) | 206 (3.0) | 62 (3.3) | 21 (2.6) | 19 (3.4) | 106 (2.9) | ||
| Percent Black | 58.0 (8.2, 92.0) | 58.3 (8.76, 91.8) | 72.9 (18.1, 94.6) | 69.4 (10.9, 94.9) | <0.001 | 74.3 (18.5, 94.6) | 38.0 (4.7, 88.0) | <0.001 |
| Poverty ratio | 45.8 (23.1, 64.1) | 46.1 (24.0, 64.1) | 50.9 (26.7, 67.6) | 50.5 (25.9, 66.0) | <0.001 | 49.4 (26.5, 65.9) | 39.4 (19.6, 61.2) | <0.001 |
| Neonatal antibiotics | 1134 (8.2) | 321 (4.7) | 164 (8.7) | 182 (22.9) | <0.001 | 96 (17.0) | 371 (10.0) | <0.001 |
| Breastfeeding at 3 months | 5860 (42.5) | 3035 (44.2) | 733 (39.0) | 324 (40.8) | <0.001 | 193 (34.1) | 1575 (42.6) | <0.001 |
| Missing | 388 (2.8) | 214 (3.1) | 46 (2.5) | 21 (2.6) | 19 (3.4) | 88 (2.4) | ||
| Pediatric antibiotics | 0.30 | 0.01 | ||||||
| No prescription | 3654 (26.5) | 1926 (28.1) | 473 (25.2) | 211 (26.6) | 140 (24.7) | 904 (24.4) | ||
| 1 prescription | 2723 (19.7) | 1368 (19.9) | 376 (20.0) | 165 (20.8) | 132 (23.3) | 682 (18.4) | ||
| 2–4 prescriptions | 4517 (32.7) | 2215 (32.3) | 640 (34.1) | 252 (31.7) | 189 (33.4) | 1221 (33.0) | ||
| 5–10 prescriptions | 2357 (17.1) | 1112 (16.2) | 328 (17.5) | 141 (17.8) | 80 (14.1) | 696 (18.8) | ||
| 11+ prescriptions | 553 (4.0) | 246 (3.6) | 61 (3.3) | 25 (3.2) | 25 (4.4) | 196 (5.3) | ||
| Chronic antibiotics | 0.05 | 0.21 | ||||||
| No course | 13070 (94.7) | 6510 (94.8) | 1795 (95.6) | 754 (95.0) | 540 (95.4) | 3471 (93.8) | ||
| 1 Course | 545 (4.0) | 250 (3.6) | 68 (3.6) | 34 (4.3) | 22 (3.9) | 171 (4.6) | ||
| 2+ Courses | 189 (1.4) | 107 (1.6) | 15 (0.8) | 6 (0.8) | 4 (0.7) | 57 (1.5) | ||
| Cohort retained at 5 years | 10358 (75.0) | 5110 (74.4) | 1420 (75.6) | 605 (76.2) | 0.36 | 412 (72.8) | 2811 (76.0) | 0.98 |
| BMI-for-age 85th to <95th percentileb | 1599/10358 (15.4) | 750/5110 (14.7) | 216/1420 (15.2) | 101/605 (16.7) | 0.4 | 68/412 (16.5) | 464/2811 (16.5) | 0.99 |
| BMI-for-age ≥95th percentileb | 1280/10358 (12.4) | 527/5110 (10.3) | 204/1420 (14.4) | 80/605 (13.2) | <0.001 | 82/412 (19.9) | 387/2811 (13.8) | 0.001 |
Missing information is shown when missing for ≥1% of infants. Otherwise, information missing for the following numbers of study subjects: maternal age, 4; parity, 130; maternal BMI, 15. The percent missing value is included in the denominator for total proportions.
BMI-for-age categories obtained from Kuczmarski et al.28 BMI, body mass index; GBS, group B Streptococcus; IAP, intrapartum antibiotic prophylaxis.
Penicillin was the most frequent antibiotic administered as GBS IAP, followed by ampicillin (Table 2). While a greater proportion of women in the vaginal cohort received GBS IAP (19.7% vs 13.3%, p <0.001), exposed women in the cesarean cohort were more likely to have a diagnosis of intraamniotic infection, to receive ampicillin (instead of penicillin) and to receive longer duration and greater doses of GBS-specific antibiotics.
Table 2.
Characteristics of mother-infant dyads with intrapartum antibiotic exposuresa
| Characteristics n (column %) or median (Q1, Q3) |
Vaginal Cohort | Cesarean Cohort | p-valueb (GBS IAP groups) | |
|---|---|---|---|---|
| Other (n=794) | GBS IAPc (n=1878) | GBS IAPc (n=566) | ||
| GBS positive or unknown | 545 (68.6) | 1818 (96.8) | 535 (94.5) | 0.01 |
| Chorioamnionitis | 208 (26.2) | 111 (5.9) | 99 (17.5) | <0.001 |
| GBS-specific antibiotic (any duration) before delivery c | 605 (76.2) | 1878 (100) | 566 (100) | N/A |
| Type of GBS-specific antibiotic, n (% GBS-specific antibiotic exposed)d | ||||
| Penicillin | 368 (60.8) | 1417 (75.5) | 390 (68.9) | 0.002 |
| Ampicillin | 172 (28.4) | 330 (17.6) | 129 (22.8) | 0.005 |
| Vancomycin | 24 (4.0) | 83 (4.4) | 26 (4.6) | 0.86 |
| Clindamycin | 23 (3.8) | 51 (2.7) | 22 (3.9) | 0.15 |
| Cefazolin | 19 (3.1) | 24 (1.3) | 14 (2.5) | 0.04 |
| Hours from first GBS-specific antibiotic dose to delivery | 2.2 (1.2, 3.2) | 9.2 (6.6, 13.5) | 13.1 (8.5, 19.9) | <0.001 |
| Median number of doses of GBS-specific antibiotic | 1 (1, 1) | 2 (2, 3) | 3 (2, 5) | <0.001 |
| Exposure to other antibiotic (not GBS-specific) before delivery | 234 (29.5) | 116 (6.2) | 82 (14.5) | <0.001 |
| Exposure to other antibiotic type, n (% of other antibiotic exposed)d | ||||
| Ampicillin and sulbactam | 176 (75.2) | 55 (47.4) | 41 (50.0) | 0.72 |
| Gentamicin | 40 (17.1) | 53 (45.7) | 32 (39.0) | 0.35 |
| Metronidazole | 14 (6.0) | 8 (6.9) | 8 (9.8) | 0.47 |
| Azithromycin/erythromycin | 5 (2.1) | 2 (1.7) | 1 (1.2) | 0.78 |
| Ceftriaxone/cefepime | 1 (0.4) | 4 (3.4) | 0 | 0.09 |
| Hours from first dose of other antibiotic to delivery | 1.8 (0.9, 3.8) | 3.5 (1.5, 6.6) | 3.5 (1.5, 6.4) | 0.99 |
| Median number of doses of other antibiotic | 1 (1, 1) | 1 (1, 1) | 1 (1, 1) | 0.33 |
Reference groups for each comparison (including antibiotic use in Cesarean section for surgical prophylaxis) are not shown.
p-value is for the comparison of the GBS IAP groups among vaginal and Cesarean cohorts. A comparison of all three non-reference groups is also significantly different (<0.001) for all characteristics other than “Median number of doses of other antibiotic” where p-value is 0.21.
GBS-specific antibiotic defined as penicillin, ampicillin, cefazolin, clindamycin or vancomycin; GBS IAP defined as the administration of one of these antibiotics 4 or more hours prior to delivery.
One participating woman may receive more than one type of antibiotic. GBS, group B Streptococcus; IAP, intrapartum antibiotic prophylaxis; N/A, not applicable.
In unadjusted analyses, the rate of weight change was significantly higher among GBS IAP exposed infants compared to the reference group in both delivery cohorts (Table 3).
Table 3.
Univariate analyses for the difference in rate of weight change (adjusted for paired height)
| Vaginal Cohort | Cesarean Cohort | |||
|---|---|---|---|---|
| Rate Difference | 95% CI | Rate Difference | 95% CI | |
| Intrapartum antibiotics | ||||
| None | Reference | Reference | N/A | N/A |
| GBS IAP | 1.82% | 1.09%, 2.54% | 2.77% | 1.41%, 4.14% |
| Other intrapartum antibiotics | 0.88% | −0.16%, 1.92% | Reference | Reference |
| Race/Ethnicity | ||||
| Black (Non-Hispanic) | Reference | Reference | Reference | Reference |
| White (Non-Hispanic) | 1.18% | 0.49%, 1.86% | −0.69% | −1.72%, 0.34% |
| Asian | −2.31% | −3.45%, −1.16% | −3.50% | −5.48%, −1.53% |
| Hispanic | 3.36% | 1.75%, 4.97% | 3.47% | 0.97%, 5.97% |
| Unknown/Other | −0.60% | −1.94%, 0.74% | −2.54% | −4.57%, −0.50% |
| Maternal weight (per 4.5 kg) | 0.82% | 0.75%, 0.88% | 0.85% | 0.76%, 0.95% |
| Maternal height (per 2.5 cm) | 0.45% | 0.35%, 0.56% | 0.45% | 0.29%, 0.62% |
| Parity | ||||
| 1 | Reference | Reference | Reference | Reference |
| 2 | −0.45% | −1.12%, 0.21% | −0.53% | −1.58%, 0.51% |
| 3 | −0.25% | −1.11%, 0.62% | −0.85% | −2.29%, 0.59% |
| 4 and above | −0.54% | −1.51%, 0.42% | −0.15% | −1.93%, 1.63% |
| GBS status | ||||
| GBS negative | Reference | Reference | Reference | Reference |
| GBS positive | 1.13% | 0.49%, 1.77% | 0.33% | −0.73%, 1.38% |
| GBS unknown | 0.22% | −1.09%, 1.53% | 0.18% | −1.71%, 2.07% |
| Chorioamnionitis | 0.56% | −0.86%, 1.99% | 0.86% | −0.79%, 2.51% |
| Pediatric primary care site | ||||
| Community physicians | Reference | Reference | Reference | Reference |
| Academic physicians | −0.01% | −0.71%, 0.69% | 2.09% | 1.03%, 3.15% |
| Infant sex, male | 1.21% | 0.63%, 1.78% | 0.72% | −0.21%, 1.65% |
| Birth weight z-score | 3.42% | 3.09%, 3.75% | 3.39% | 2.91%, 3.87% |
| Medicaid | 0.06% | −0.51%, 0.63% | 0.24% | −0.70%, 1.18% |
| Percent black (per 10%) | −0.04% | −0.11%, 0.03% | 0.09% | −0.03%, 0.21% |
| Poverty ratio (per 10%) | −0.01% | −0.13%, 0.10% | 0.32% | 0.13%, 0.51% |
| Neonatal antibiotics | 1.15% | 0.04%, 2.27% | 2.27% | 0.80%, 3.75% |
| Breast feeding at 3 months | −1.57% | −2.13%, −1.00% | −1.97% | −2.88%, −1.06% |
| Pediatric antibiotics | ||||
| No prescription | Reference | Reference | Reference | Reference |
| 1 prescription | −2.22% | −2.79%, −1.66% | −1.90% | −2.80%, −1.00% |
| 2–4 prescriptions | −1.37% | −1.93%, −0.81% | −2.52% | −3.39%, −1.64% |
| 5–10 prescriptions | −3.05% | −3.84%, −2.27% | −2.38% | −3.55%, −1.21% |
| 11+ prescriptions | −2.41% | −4.26%, −0.56% | −7.11% | −9.39%, −4.83% |
| Chronic antibiotics | ||||
| No course | Reference | Reference | Reference | Reference |
| 1 Course | −0.52% | −1.82%, 0.78% | −3.27% | −5.13%, −1.41% |
| 2+ Courses | −3.83% | −6.26%, −1.39% | 0.47% | −3.25%, 4.20% |
CI, confidence interval; GBS, group B Streptococcus; IAP, intrapartum antibiotic prophylaxis; N/A, not applicable.
Multiple covariates were associated with the outcome. In multivariate analyses, GBS IAP was associated with an increased rate of weight gain in both the vaginal (adjusted rate difference 1.44%, 95% CI 0.3%−2.6%) and cesarean (adjusted rate difference 3.52%, 95% CI 1.9%−5.2%) cohorts (Table 4). Exposure to other antibiotics in the vaginal cohort was not associated with differential rate of weight gain. The absolute difference in weight at 5 years for a GBS IAP-exposed vs. unexposed child equates to an excess weight of 0.24 kg (95% CI 0.04–0.44) among vaginally delivered and 0.60 kg (95% CI, 0.32–0.88) among cesarean-delivered children. Estimates of additional models excluding the post-exposure variables (Table 4), and for weight alone, gave similar results (Supplementary Table 4). The sensitivity analysis categorizing vancomycin or clindamycin as ‘other antibiotics’ instead of GBS IAP did not change the direction or significance of the results (Supplementary Table 4).
Table 4.
Multivariate analyses for the difference in rate of weight change (adjusted for paired height)
| Rate differences | 95% CI | Difference in weight, birth to 5 years | Transformed to body mass index (BMI) | ||||
|---|---|---|---|---|---|---|---|
| Weight gain (kg) | Absolute weight difference (kg) | 95% CI | Absolute BMI difference (kg/m2) | 95% CI | |||
| Vaginal Cohort – Main Model | |||||||
| GBS IAP vs. No antibiotics | 1.44% | 0.3%, 2.6% | 16.62 | 0.24 | 0.04, 0.44 | 0.20 | 0.04, 0.36 |
| Other antibiotics vs. No antibiotics | 1.18% | −0.1%, 2.5% | 16.62 | 0.20 | −0.01, 0.41 | 0.16 | −0.01, 0.34 |
| Cesarean Cohort – Main Model | |||||||
| GBS IAP vs Other antibiotics | 3.52% | 1.9%, 5.2% | 17.06 | 0.60 | 0.32, 0.88 | 0.50 | 0.26, 0.73 |
| Vaginal Cohort – Model excluding pediatric antibiotics | |||||||
| GBS IAP vs. No antibiotics | 1.44% | 0.3%, 2.6% | 16.45 | 0.24 | 0.04, 0.43 | 0.20 | 0.03, 0.36 |
| Other antibiotics vs. No antibiotics | 1.16% | −0.1%, 2.4% | 16.45 | 0.19 | −0.02, 0.40 | 0.16 | −0.02, 0.33 |
| Cesarean Cohort – Model excluding pediatric antibiotics | |||||||
| GBS IAP vs. Other antibiotics | 3.53% | 1.9%, 5.2% | 16.83 | 0.59 | 0.32, 0.87 | 0.49 | 0.26, 0.72 |
| Vaginal Cohort – Model excluding pediatric antibiotics and breastfeeding | |||||||
| GBS IAP vs. No antibiotics | 1.48% | 0.3%, 2.7% | 16.31 | 0.24 | 0.05, 0.44 | 0.20 | 0.04, 0.36 |
| Other antibiotics vs. No antibiotics | 1.18% | −0.1%, 2.5% | 16.31 | 0.19 | −0.02, 0.40 | 0.16 | −0.01, 0.33 |
| Cesarean Cohort – Model excluding pediatric antibiotics and breastfeeding | |||||||
| GBS IAP vs. Other antibiotics | 3.56% | 1.9%, 5.2% | 16.72 | 0.60 | 0.32, 0.87 | 0.49 | 0.26, 0.72 |
Multivariate model adjusted for: maternal race/ethnicity (Black/Non-Hispanic, White/Non-Hispanic, Asian, Hispanic, Unknown/Other), maternal weight, maternal height, parity (1, 2, 3, 4 and above), maternal GBS colonization status (positive, negative, unknown), maternal chorioamnionitis, percent Black and poverty ratio by residential address (per 10%), birth year and month (categorical), birth weight z-score (continuous), infant sex, insurance (Medicaid vs. private/unknown), pediatric center (academic vs non-academic); breastfeeding at 3 months, neonatal antibiotics (administered <72 hours after birth), pediatric antibiotics (0, 1, 2–4, 5–10, ≥11 prescriptions) and chronic antibiotic courses (0, 1, ≥2). Rate difference and confidence limits obtained from the final model were multiplied with the estimated weight and height gain of the reference group in each delivery mode strata to generate the expected absolute weight and BMI differences at 5 years between the exposed and the unexposed infants. BMI, body mass index; CI, confidence interval; GBS, group B Streptococcus; IAP, intrapartum antibiotic prophylaxis; vs, versus.
DISCUSSION
Among 13,804 term infants, birth to a mother administered GBS IAP was associated with an increased rate of weight gain through 5 years of age. The increase was observed regardless of delivery mode, but the effect estimate was greater among children born by cesarean section. We accounted for multiple factors associated with GBS IAP administration, and with newborn birth weight and subsequent growth. These findings support the hypothesized role of the gut microbiome in weight and growth, and inform the risk/benefit balance of antibiotic exposure.
Several aspects of our study design support the validity of our results. We measured a confirmed inpatient antibiotic exposure, administered to women primarily as prophylaxis, in a large cohort of healthy term infants. We limited the primary exposure to antibiotics specifically recommended for use as GBS prophylaxis. Ninety-four percent of the women administered GBS IAP received either penicillin, ampicillin or cefazolin – antibiotics notable for the rapidity with which they reduce maternal GBS colonization, cross the placenta, reach bactericidal levels in amniotic fluid and cord blood, and reduce neonatal colonization.29–32 These antibiotics have been associated with altered initial composition of the neonatal gut microbiota.6,16 This is likely due to a direct impact on the newborn as well as on the mother, who is the primary source of microbiota among healthy term infants, and provides biologic plausibility to the observed outcome.4,6,33
An explicit goal of our study was to determine whether a prevention strategy recommended to protect newborn health might have unintended consequences. To ensure the primary exposure reflected recommended policy, we focused on the antibiotic content of the exposure rather than the intent, i.e., some in the GBS IAP groups may have received the antibiotic for reasons other than GBS colonization, and some in the “other” group may have received antibiotics for GBS colonization but for inadequate duration.14,18 This requirement explains the lower frequency of GBS IAP in our study (18%) compared to a GBS colonization rate (28%) similar to national prevalence.14 Among vaginally-delivered children, we did not find a significant association between exposure to other intrapartum antibiotics and childhood growth trajectory. This may simply be due to a shorter duration of exposure prior to delivery (Table 2), but it is also possible that antibiotics of different antimicrobial spectrum and effects on the microbiota do not translate to the same biological effect as hypothesized for GBS IAP. Our main findings contrast with another study that found no significant association of GBS IAP with childhood BMI among vaginal births.34 That study relied on a single BMI measurement between 2–5 years of age and was unable to determine the duration of the intrapartum exposure, introducing heterogeneity and making it impossible to measure the impact of adequate GBS IAP.
We choose weight trajectory as our primary outcome to allow a continuous assessment of weight change rather than reliance on a dichotomized outcome at a single time point. As height measures are prone to more error than weight due to use of recumbent length in infancy, we developed both weight and weight-adjusted-for-height models. We did not use BMI as an outcome to avoid bias due to spurious correlations that can occur with use of a ratio in regression models.35 We adjusted for multiple maternal and infant confounders and covariates associated with childhood weight, but there likely remain unmeasured differences such as genetic background and post-exposure diet and exercise. In using weight trajectory as the outcome, we attempted to mitigate the impact of these unmeasured variables, focusing less on how the primary exposure is associated with the child’s size at a specific endpoint, and more on the rate of growth the child would have experienced over time in the absence of the exposure.
A final notable aspect of our study is our decision to stratify the analysis by mode of delivery. Cesarean birth has an independent effect on the newborn gut microbiota4 and is associated with increased childhood weight.36 Obstetric guidelines recommend perioperative administration of antibiotics to women ≤60 minutes prior to cesarean section, meaning this delivery mode is universally associated with an intrapartum antibiotic exposure.15 Although the timing of surgical prophylaxis suggests minimal placental transfer to the newborn, these antibiotics are expected to alter the maternal microbiota. The magnitude of rate difference in growth was larger when GBS IAP and cesarean delivery occurred together, potentially through the combined effects on both the maternal and neonatal microbiota.
Our study has several limitations. We had no information on maternal antibiotics used during pregnancy, nor on total gestational weight gain, a factor that has been associated with child obesity, although not with GBS colonization.24 We were unable to account for exclusive breastfeeding, nor could we quantify the contribution of pediatric diet after weaning.
We interpret the results of this study with the caution required of an observational study that cannot establish causation. The estimated change in weight gain (less than a kilogram) or BMI (less than a unit) at 5 years was statistically significant but small in magnitude. However, a relatively small but persistent increase in rate of weight gain that begins in early childhood may be impactful over time. A prospective population-based study demonstrated that weight gain at 2–6 years age predicted adolescent obesity.37 Further insights into the clinical meaning of our findings may be had with follow-up into later childhood and adolescence. This study should be placed in the context of the substantial decline in the incidence of neonatal early-onset GBS disease in the era of GBS prophylaxis.14,38 Our findings add to an accounting of the limitations of this approach, which include incomplete prevention of early-onset disease as well as a lack of impact on late-onset neonatal disease.39 However, currently there are few alternatives to screening-based GBS IAP. Risk-based approaches may result in lower antibiotic utilization but have not proven as efficacious.18 GBS vaccines still require Phase III trials and licensure, and the safety and efficacy of methods to modify the initial neonatal microbiota, such as vaginal seeding, remain undefined. We do not believe that our findings justify abandonment of the only strategy currently available to prevent neonatal GBS disease. Instead, we believe our findings highlight the importance of research addressing antibiotic-associated dysbiosis and the subsequent impact on host metabolism, and argue for continued efforts to develop alternate strategies such as maternal GBS vaccines to augment and potentially replace IAP.
CONCLUSIONS
GBS-specific IAP was associated with a modest increase in rate of early childhood weight gain.
Supplementary Material
What is already known on this topic:
Intrapartum antibiotics administered to laboring women can alter the development of the neonatal gut microbiome. Similar exposure in animal models result in altered neonatal growth. The effect of intrapartum group B Streptococcus prophylaxis on human childhood weight gain is unclear.
What this study adds:
Group B Streptococcal intrapartum antibiotic prophylaxis was associated with modest increase in rate of weight gain in the first 5 years after birth. The results were significant in both vaginal and cesarean deliveries and after adjusting for multiple confounders.
ACKNOWLEDGEMENTS
We thank David Freedman, MD (Division of Nutrition, Physical Activity and Obesity, Centers for Disease Control and Prevention, Atlanta, GA, USA) for his contributions to model development, and Joseph Chou, MD, PhD (Department of Pediatrics, Massachusetts General Hospital, Harvard Medical School, Boston, MA, USA) for generating the birth anthropometric percentiles for the study population. Drs. Freedman and Chou did not receive any compensation for their assistance.
Funding/Support:
This study was supported by a contract with the Centers for Disease Control and Prevention (CDC 200-2017-96221, Puopolo, PI), and by Eunice Kennedy Shriver National Institute of Child Health & Human Development (NICHD) of the National Institutes of Health (NIH) grant (#K23HD088753, Mukhopadhyay).
Role of Funder/Sponsor:
Drs. Schrag, Spiller and Sharma were employees of the CDC during the study and were involved in design and conduct of the study, interpretation of the data, and preparation and review of the manuscript. The findings and conclusions in this report are those of the authors and do not necessarily represent the official position of the CDC. NICHD/NIH had no role in design and conduct of the study; collection, management, analysis, and interpretation of the data; preparation, review, or approval of the manuscript; and decision to submit the manuscript for publication
Abbreviations
- BMI
Body-mass index
- GBS
Group B Streptococcus
- IAP
Intrapartum antibiotic prophylaxis
- IQR
Interquartile range
- LRR
Longitudinal rate regression
REFERENCES
- 1.Hales CM, Carroll MD, Fryar CD, Ogden CL. Prevalence of obesity among adults and youth: United states, 2015–2016. NCHS Data Brief. 2017; (288) (288):1–8. [PubMed] [Google Scholar]
- 2.Cho I, Yamanishi S, Cox L, et al. Antibiotics in early life alter the murine colonic microbiome and adiposity. Nature. 2012;488 (7413):621–626. [DOI] [PMC free article] [PubMed] [Google Scholar]
- 3.Cox LM, Yamanishi S, Sohn J, et al. Altering the intestinal microbiota during a critical developmental window has lasting metabolic consequences. Cell. 2014;158 (4):705–721. [DOI] [PMC free article] [PubMed] [Google Scholar]
- 4.Shao Y, Forster SC, Tsaliki E, et al. Stunted microbiota and opportunistic pathogen colonization in caesarean-section birth. Nature. 2019;574 (7776):117–121. [DOI] [PMC free article] [PubMed] [Google Scholar]
- 5.Yatsunenko T, Rey FE, Manary MJ, et al. Human gut microbiome viewed across age and geography. Nature. 2012;486 (7402):222–227. [DOI] [PMC free article] [PubMed] [Google Scholar]
- 6.Azad MB, Konya T, Persaud RR, et al. Impact of maternal intrapartum antibiotics, method of birth and breastfeeding on gut microbiota during the first year of life: A prospective cohort study. BJOG. 2016;123 (6):983–993. [DOI] [PubMed] [Google Scholar]
- 7.Bokulich NA, Chung J, Battaglia T, et al. Antibiotics, birth mode, and diet shape microbiome maturation during early life. Sci Transl Med. 2016;8 (343):343ra82. [DOI] [PMC free article] [PubMed] [Google Scholar]
- 8.Gerber JS, Bryan M, Ross RK, et al. Antibiotic exposure during the first 6 months of life and weight gain during childhood. JAMA. 2016;315 (12):1258–1265. [DOI] [PubMed] [Google Scholar]
- 9.Saari A, Virta LJ, Sankilampi U, Dunkel L, Saxen H. Antibiotic exposure in infancy and risk of being overweight in the first 24 months of life. Pediatrics. 2015;135 (4):617–626. [DOI] [PubMed] [Google Scholar]
- 10.Trasande L, Blustein J, Liu M, Corwin E, Cox LM, Blaser MJ. Infant antibiotic exposures and early-life body mass. Int J Obes (Lond). 2013;37 (1):16–23. [DOI] [PMC free article] [PubMed] [Google Scholar]
- 11.Shao X, Ding X, Wang B, et al. Antibiotic exposure in early life increases risk of childhood obesity: A systematic review and meta-analysis. Front Endocrinol (Lausanne). 2017;8:170. [DOI] [PMC free article] [PubMed] [Google Scholar]
- 12.Prevention of group B streptococcal early-onset disease in newborns: ACOG committee opinion, number 782. Obstet Gynecol. 2019;134 (1):e19–e40. [DOI] [PubMed] [Google Scholar]
- 13.Committee on Obstetric Practice. Committee opinion no. 712: Intrapartum management of intraamniotic infection. Obstet Gynecol. 2017;130 (2):e95–e101. [DOI] [PubMed] [Google Scholar]
- 14.Verani JR, McGee L, Schrag SJ, Division of Bacterial Diseases, National Center for Immunization and Respiratory Diseases, Centers for Disease Control and Prevention (CDC). Prevention of perinatal group B streptococcal disease--revised guidelines from CDC, 2010. MMWR Recomm Rep. 2010;59 (RR-10):1–36. [PubMed] [Google Scholar]
- 15.Committee on Practice Bulletins-Obstetrics. ACOG practice bulletin no. 199: Use of prophylactic antibiotics in labor and delivery. Obstet Gynecol. 2018;132 (3):e103–e119. [DOI] [PubMed] [Google Scholar]
- 16.Corvaglia L, Tonti G, Martini S, et al. Influence of intrapartum antibiotic prophylaxis for group B streptococcus on gut microbiota in the first month of life. J Pediatr Gastroenterol Nutr. 2016;62 (2):304–308. [DOI] [PubMed] [Google Scholar]
- 17.Feudtner C, Hays RM, Haynes G, Geyer JR, Neff JM, Koepsell TD. Deaths attributed to pediatric complex chronic conditions: National trends and implications for supportive care services. Pediatrics. 2001;107 (6):E99. [DOI] [PubMed] [Google Scholar]
- 18.Schrag S, Gorwitz R, Fultz-Butts K, Schuchat A. Prevention of perinatal group B streptococcal disease. revised guidelines from CDC. MMWR Recomm Rep. 2002;51 (RR-11):1–22. [PubMed] [Google Scholar]
- 19.Daymont C, Ross ME, Russell Localio A, Fiks AG, Wasserman RC, Grundmeier RW. Automated identification of implausible values in growth data from pediatric electronic health records. J Am Med Inform Assoc. 2017;24 (6):1080–1087. [DOI] [PMC free article] [PubMed] [Google Scholar]
- 20.Fenton TR, Kim JH. A systematic review and meta-analysis to revise the fenton growth chart for preterm infants. BMC Pediatr. 2013;13:59–59. [DOI] [PMC free article] [PubMed] [Google Scholar]
- 21.Cassidy-Bushrow AE, Sitarik A, Levin AM, et al. Maternal group B streptococcus and the infant gut microbiota. J Dev Orig Health Dis. 2016;7 (1):45–53. [DOI] [PMC free article] [PubMed] [Google Scholar]
- 22.Isong IA, Rao SR, Bind MA, Avendano M, Kawachi I, Richmond TK. Racial and ethnic disparities in early childhood obesity. Pediatrics. 2018;141 (1): 10.1542/peds.2017-0865. [DOI] [PMC free article] [PubMed] [Google Scholar]
- 23.Stapleton RD, Kahn JM, Evans LE, Critchlow CW, Gardella CM. Risk factors for group B streptococcal genitourinary tract colonization in pregnant women. Obstet Gynecol. 2005;106 (6):1246–1252. [DOI] [PubMed] [Google Scholar]
- 24.Voerman E, Santos S, Patro Golab B, et al. Maternal body mass index, gestational weight gain, and the risk of overweight and obesity across childhood: An individual participant data meta-analysis. PLoS Med. 2019;16 (2):e1002744. [DOI] [PMC free article] [PubMed] [Google Scholar]
- 25.Bureau UC. American community survey 5-year data (2009–2018). The United States Census Bureau; Web site. https://www.census.gov/data/developers/data-sets/acs-5year.html. Accessed Apr 20, 2020. [Google Scholar]
- 26.Diez Roux AV, Moore KA, Melly SJ, Wang X, Joshi R. Neighborhood health and poverty in philadelphia. urban collaborative data brief number 2, 2017. Dornsife school of public health, drexel university. Philadelphia, PA. Available from https://drexel.edu/uhc/resources/briefs/. [Google Scholar]
- 27.Kurland BF, Heagerty PJ. Directly parameterized regression conditioning on being alive: Analysis of longitudinal data truncated by deaths. Biostatistics. 2005;6 (2):241–258. [DOI] [PubMed] [Google Scholar]
- 28.Kuczmarski RJ, Ogden CL, Guo SS, et al. 2000 CDC growth charts for the united states: Methods and development. Vital Health Stat 11. 2002; (246) (246):1–190. [PubMed] [Google Scholar]
- 29.Barber EL, Zhao G, Buhimschi IA, Illuzzi JL. Duration of intrapartum prophylaxis and concentration of penicillin G in fetal serum at delivery. Obstet Gynecol. 2008;112 (2 Pt 1):265–270. [DOI] [PMC free article] [PubMed] [Google Scholar]
- 30.Berardi A, Pietrangiolillo Z, Bacchi Reggiani ML, et al. Are postnatal ampicillin levels actually related to the duration of intrapartum antibiotic prophylaxis prior to delivery? A pharmacokinetic study in 120 neonates. Arch Dis Child Fetal Neonatal Ed. 2018;103 (2):F152–F156. [DOI] [PubMed] [Google Scholar]
- 31.Fairlie T, Zell ER, Schrag S. Effectiveness of intrapartum antibiotic prophylaxis for prevention of early-onset group B streptococcal disease. Obstet Gynecol. 2013;121 (3):570–577. [DOI] [PubMed] [Google Scholar]
- 32.Fiore Mitchell T, Pearlman MD, Chapman RL, Bhatt-Mehta V, Faix RG. Maternal and transplacental pharmacokinetics of cefazolin. Obstet Gynecol. 2001;98 (6):1075–1079. [DOI] [PubMed] [Google Scholar]
- 33.Stanislawski MA, Dabelea D, Wagner BD, et al. Gut microbiota in the first 2 years of life and the association with body mass index at age 12 in a norwegian birth cohort. mBio. 2018;9 (5): 10.1128/mBio.01751-18. [DOI] [PMC free article] [PubMed] [Google Scholar]
- 34.Metz TD, McKinney J, Allshouse AA, Knierim SD, Carey JC, Heyborne KD. Exposure to group B streptococcal antibiotic prophylaxis and early childhood body mass index in a vaginal birth cohort. J Matern Fetal Neonatal Med. 2019:1–6. [DOI] [PMC free article] [PubMed] [Google Scholar]
- 35.Kronmal RA. Spurious correlation and the fallacy of the ratio standard revisited. Journal of the Royal Statistical Society.Series A (Statistics in Society). 1993;156 (3):379–392. http://www.jstor.org/stable/2983064. [Google Scholar]
- 36.Kuhle S, Tong OS, Woolcott CG. Association between caesarean section and childhood obesity: A systematic review and meta-analysis. Obes Rev. 2015;16 (4):295–303. [DOI] [PubMed] [Google Scholar]
- 37.Geserick M, Vogel M, Gausche R, et al. Acceleration of BMI in early childhood and risk of sustained obesity. N Engl J Med. 2018;379 (14):1303–1312. [DOI] [PubMed] [Google Scholar]
- 38.Nanduri SA, Petit S, Smelser C, et al. Epidemiology of invasive early-onset and late-onset group B streptococcal disease in the united states, 2006 to 2015: Multistate laboratory and population-based surveillance. JAMA Pediatr. 2019;173 (3):224–233. [DOI] [PMC free article] [PubMed] [Google Scholar]
- 39.Mukhopadhyay S, Puopolo KM. Preventing neonatal group B streptococcus disease: The limits of success. JAMA Pediatr. 2019;173 (3):219–220. [DOI] [PubMed] [Google Scholar]
Associated Data
This section collects any data citations, data availability statements, or supplementary materials included in this article.