Summary
Cytoplasmic dyneins are AAA (ATPase associated with diverse cellular activities) motor proteins responsible for microtubule minus-end-directed intracellular transport. Dynein’s unusually large size, four distinct nucleotide-binding sites, and conformational dynamics pose challenges for the design of potent and selective chemical inhibitors. Here we use structural approaches to develop a model for the inhibition of a well-characterized S. cerevisiae dynein construct by pyrazolo-pyrimidinone-based compounds. These data, along with functional assays of dynein motility and mutagenesis studies, suggest that the compounds inhibit dynein by engaging the regulatory ATPase sites in the AAA3 and AAA4 domains, and not by interacting with dynein’s main catalytic site in the AAA1 domain. A double Walker B mutant in AAA3 and AAA4 is an inactive enzyme, suggesting that inhibiting these regulatory sites can have a similar effect to chemically inhibiting AAA1. Our findings reveal how chemical inhibitors can be designed to disrupt allosteric communication across dynein’s AAA domains.
In Brief
Santarossa et al. describe a pyrazolo-pyrimidinone-based compound that targets two regulatory AAA domains in dynein to block its motility. These data show that the AAA3 and AAA4 domains of dynein are druggable sites and provide a framework that can guide inhibitor optimization.
Graphical Abstract

Introduction
Dyneins are microtubule-based motor proteins that belong to the AAA (ATPase Associated with diverse cellular Activities) superfamily, which is defined by a conserved AAA domain (Erzberger and Berger, 2006). These motor proteins are conserved across many eukaryotes and are involved in a wide range of biological functions. In Saccharomyces cerevisiae, only one dynein isoform exists, and is required for the proper positioning of the nucleus during division (Moore et al., 2009). In metazoan cells there are two isoforms of cytoplasmic dynein that are responsible for microtubule minus-end directed transport. Dynein 1 is present in the cytoplasm and transports diverse cellular cargoes, including organelles, vesicles, chromosomes and mRNAs. In contrast, dynein 2 is localized to the cilium, where it drives retrograde intraflagellar transport (Roberts, 2018). As these transport processes occur on the timescale of seconds to minutes (Mijalkovic et al., 2017), fast-acting small molecule probes can be powerful tools to examine dynein function with the required temporal resolution. Chemical inhibitors selective for dynein isoforms or targeting specific dynein-mediated protein interactions can also be useful therapeutics. For example, the life-cycle of viruses (e.g. HIV) in infected cells depends on dynein 1-mediated transport towards the nucleus of the host cell (Reck-Peterson et al., 2018) and certain signal transduction pathways (e.g. Hedgehog signaling) needed for cancer cell growth depend on dynein 2 (He et al., 2017). However, we currently lack a structural framework for the design of potent and selective inhibitors of dynein.
At least three different cell-permeable inhibitors of dynein have been reported (Steinman and Kapoor, 2019). Ciliobrevins, the first cell permeable probes of dynein, were discovered using cell-based screens (Firestone et al., 2012). Dynapyrazoles, designed based on the ciliobrevin scaffold, have improved potency and inhibit the microtubule-stimulated, but not the basal, ATPase activity of human dynein (Steinman et al., 2017). Dynarrestin, which was also discovered using cell-based screens, can pull-down dynein complexes from cell extracts but does not inhibit ATPase activity in vitro (Höing et al., 2018). Structural models are needed to gain insights into the mechanism of dynein inhibition and to improve the potency and selectivity of available chemical inhibitors, but these data have not been available. Moreover, for structural studies we require compounds that can directly bind the motor protein and inhibit its basal ATPase activity, as including micrometer-sized microtubules in cryo-EM or crystallization conditions can substantially increase technical challenges.
Dynein’s motor domain, which powers microtubule-based motility, consists of a single polypeptide with six distinct AAA domains that form a ring, an N-terminal linker, buttress (or strut) and a long coiled-coil stalk that includes the microtubule binding domain (MTBD) (Figure 1A) (Carter et al., 2011; Kon et al., 2012). Similar to other proteins in this superfamily, dynein’s six AAA domains are comprised of AAA-L (large) and AAA-S (small) subdomains that together with a AAA-L subdomain of an adjacent AAA domain, form a tripartite interface where ATP binding and hydrolysis can occur (Erzberger and Berger, 2006; Schmidt and Carter, 2016). The first four AAA domains (AAA1-AAA4) contain the Walker A motifs necessary for ATP binding, while the AAA5 and AAA6 domains lack this motif and likely have nucleotide-independent structural roles (Schmidt and Carter, 2016). The AAA1 domain contains the primary ATPase site that drives dynein’s motility (Gibbons and Gibbons, 1987; Kon et al., 2004). The AAA2 domain lacks the catalytic glutamate residue in the Walker B motif needed for ATP hydrolysis, resulting in constitutive ATP binding (Kon et al., 2012; Schmidt et al., 2012). The AAA3 active site plays an allosteric role, regulating ATP turnover in the AAA1 domain (Bhabha et al., 2014; DeWitt et al., 2015). The AAA4 domain contains the residues required for ATP binding and hydrolysis, but its function is not well understood (Kon et al., 2012; Schmidt et al., 2012). In principle, chemical inhibitors could bind at any of these four different AAA domains or at another site in dynein to block its mechanochemical cycle.
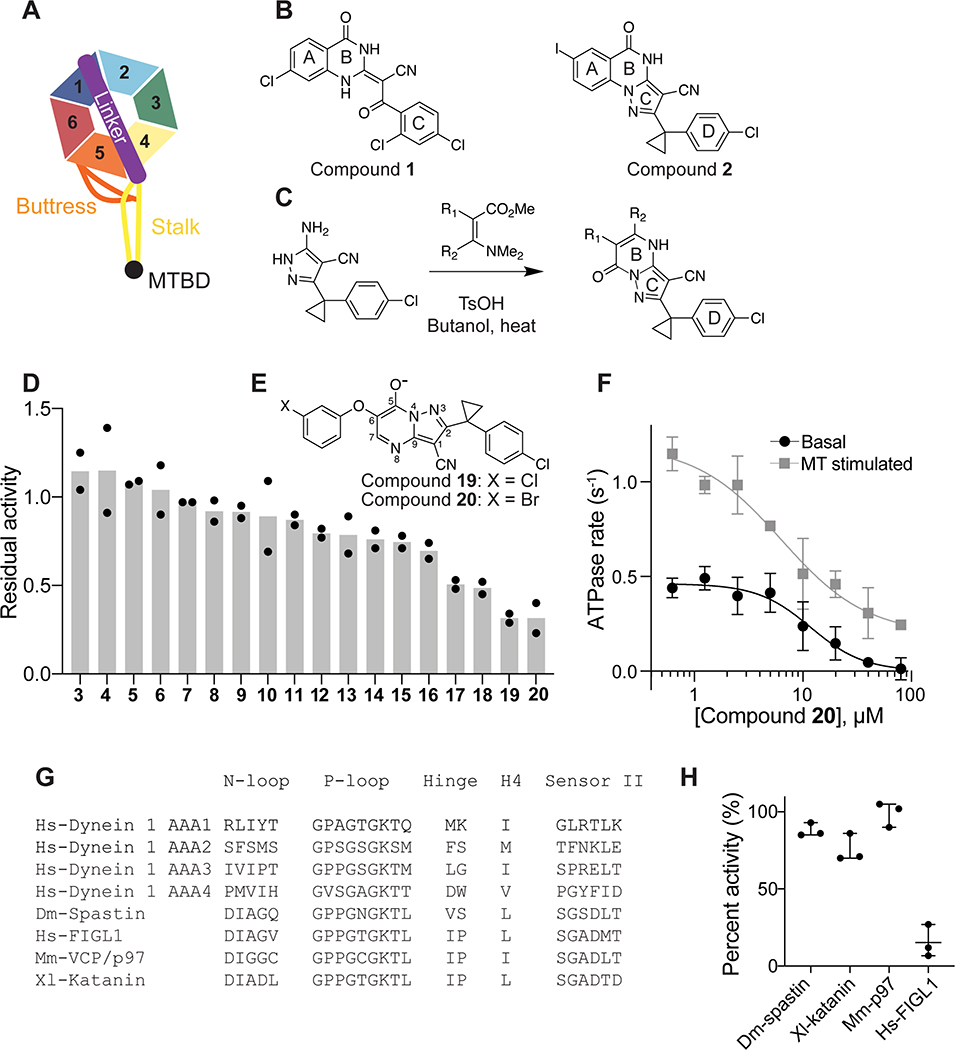
Figure 1. Inhibition of human dynein 1’s ATPase activity by dynapyrazole derivatives.
(A) Schematic of dynein motor domain (AAA1: blue, AAA2: light blue, AAA3: green, AAA4: yellow, AAA5: orange, AAA6: red, linker: purple, buttress: orange, stalk: yellow, MTBD: black). (B) Chemical structure of the ciliobrevin D (compound 1) and dynapyrazole-A (compound 2). A, B, C and D rings are highlighted. (C) Synthesis of bicyclic dynapyrazole derivatives from a common precursor (TsOH: p-toluenelsulfonic acid). (D) Effect of dynapyrazole derivatives on Hs-dynein 1’s (N-terminal hexahistixine tag, aa. 1320–4646, uniprot: Q14204) basal ATPase activity. Compounds were tested at 20 μM. Data are mean ± range (n=2, for chemical structures see Figure S1A). (E) Chemical structures of compounds 19 and 20. Atom numbering is included. (F) ATPase activity of Hs-dynein 1 in the presence of compound 20 with or without the addition of microtubules (2.5 μM). Data are mean ± SD of n=3 and were fit to a sigmoidal dose-response curve. (G) Alignment of residues in five ATP-binding motifs (N-loop, P-loop, hinge, H4, sensor II) of Hs-Dynein 1, Dm-Spastin, Hs-FIGL1, Mm-VCP/p97 and Xl-katanin. (H) Percent steady-state ATPase activity of four AAA proteins in the presence of compound 20 (20 μM). Lines represent mean and error bars indicate SD (n=3). Mean ± SD for each construct is as follows: 88 ± 4.4 % (Dm-spastin), 99 ± 7.9 % (Mm-p97), 76 ± 9.0% (Xl-katanin), 15 ± 11% (Hs-FIGL).
Here we synthesized and tested derivatives of dynapyrazoles to identify inhibitors of dynein’s basal ATPase activity. We used X-ray crystallography, cryo-EM and mutagenesis studies to develop models for how a dynapyrazole derivative binds to S. cerevisiae dynein, which has been extensively used for structural studies of this motor protein (Bhabha et al., 2014; Carter et al., 2011; Niekamp et al., 2019; Schmidt et al., 2012). We also performed functional assays of dynein motility to test how dynein interacts with microtubules in the presence of a dynapyrazole derivative. Our findings reveal how chemical inhibitors can disrupt the allosteric communication within dynein’s AAA ring and how two regulatory AAA sites contribute to enzymatic activity.
Results
Identifying dynapyrazole derivatives that inhibit dynein’s basal ATPase activity
To identify inhibitors of dynein’s basal ATPase activity we focused on ciliobrevins, which inhibit dyneins basal and microtubule-stimulated ATPase activity, and on dynapyrazoles, which inhibit only the microtubule-stimulated activity (Firestone et al., 2012; Steinman et al., 2017). In particular, we generated compounds that retained the pyrimidine-4-one based core that is common to the ciliobrevins and dynapyrazoles (hereafter, compound 1 and 2, ring B is indicated) and therefore would likely maintain dynein inhibition (Figure 1B) (Firestone et al., 2012; See et al., 2016). A facile synthesis of these compounds was afforded by condensation of the 3-cyclopropyl-cholorophenyl substituted aminopyrazole with either 2- or 3-substituted (3-dimethylamino)acrylates in the presence of an acid to yield 6- or 7-substituted pyrazolo-pyrimidinones (Figure 1C).
We generated compounds 3-20 and tested their activity against a previously reported recombinant motor domain construct of human cytoplasmic dynein 1 (hereafter, Hs-dynein 1, aa. 1320–4646, Figures 1D, 1E, S1A and S1B) (Steinman et al., 2017). Since compound 2 inhibits Hs-dynein 1 with an IC50 of ~10 μM (Steinman et al., 2017), we rationalized that 20 μM was a suitable concentration to test analogs. Hs-dynein 1’s basal ATP hydrolysis rate was 0.50 ± 0.13 s−1 (1 mM MgATP, mean ± standard deviation (SD), n=7, Figure 1F), consistent with previous studies (Steinman et al., 2017). Gratifyingly, we found that compounds with aryl-ether substitutions at the 6-position of the pyrazolopyrimidine core inhibited Hs-dynein 1’s ATPase activity in the absence of microtubules (Figure S1A). In particular, a meta-chlorophenoxy and meta-bromophenoxy ether substitution at the 6-position (compound 19 and 20, respectively) were most active (n=2, 1 mM MgATP, Figures 1D, 1E and S1A). Compounds with a para- or ortho-chloro groups on the pendent phenyl ring (compounds 17 and 13, respectively) were less active, as was an analog (16) with a meta-methoxy substitution (Figures 1D and S1A). Dose-dependent analyses indicated that compounds 19 and 20 inhibit Hs-dynein 1’s basal ATPase activity with an IC50 of 17 ± 2.3 μM and 12 ± 9.3 μM, respectively (1 mM MgATP, mean ± SD, n=3, Figures 1F, S1C).
We next measured the effect of compounds 19 and 20 on the microtubule-stimulated ATPase activity of Hs-dynein 1. In the presence of microtubules (2.5 μM), Hs-dynein 1’s ATPase rate was 1.02 ± 0.12 s−1 (mean ± SD, n=5), ~2-fold higher than the basal rate, as expected for this construct (Figures 1F, S1C) (Steinman et al., 2017). We note that tail-truncated dynein motor domain constructs have ATPase activities that are substantially lower than those reported for the multi-protein dynein-dynactin-BICD2 (DDB) complex, which can achieve rates of 100 s−1 (Cho et al., 2008; Elshenawy et al., 2019; Steinman et al., 2017). Dose-dependent analysis revealed that compounds 19 and 20 inhibited the microtubule-stimulated ATPase activity of Hs-dynein 1 with an estimated IC50 of ~30 and ~10 μM, respectively (1 mM MgATP, n=3, Figures 1F, S1C). Complete inhibition was not observed, possibly due to limited compound solubility of the inhibitors at highest doses (>80 μM) in this assay.
We also examined if compounds 19 and 20 (20 μM, 1 mM MgATP) inhibit the ATPase activity of four other AAA proteins that we have previously characterized in recombinant form: Hs-FIGL1, Mm-VCP, Xl-katanin, and Dm-spastin (Cupido et al., 2019). As many of the known AAA inhibitors interact with the nucleotide-binding site in the AAA domain, we performed a structural alignment of residues in the five motifs that are within ~6 Å of adenine (Figure 1G) (Cupido et al., 2019; Erzberger and Berger, 2006; Steinman and Kapoor, 2019). These alignments revealed that the residues in Hs-dynein 1 differ substantially from those in Hs-FIGL1, Mm-VCP, Xl-katanin, and Dm-spastin (<50% sequence identity). Compounds 19 and 20 did not substantially inhibit (<25% reduction) Mm-VCP, Xl-katanin, and Dm-spastin (Figures 1H, S1D). Interestingly, compounds 19 and 20 did inhibit Hs-FIGL1 (~85% inhibition) (n=2 and n=3, respectively, Figures 1H, S1D), but it is unclear how these analogs bind this AAA ATPase.
Taken together, compounds 19 and 20 inhibit dynein’s basal ATPase activity, which compound 1 does not (Steinman et al., 2017). A compound which is capable of inhibiting the basal ATPase activity is more suitable for structural studies, as dynein constructs optimized for X-ray crystallography and cryo-EM can be utilized in the absence of microtubules.
Dynapyrazole derivatives inhibit S. cerevisiae dynein
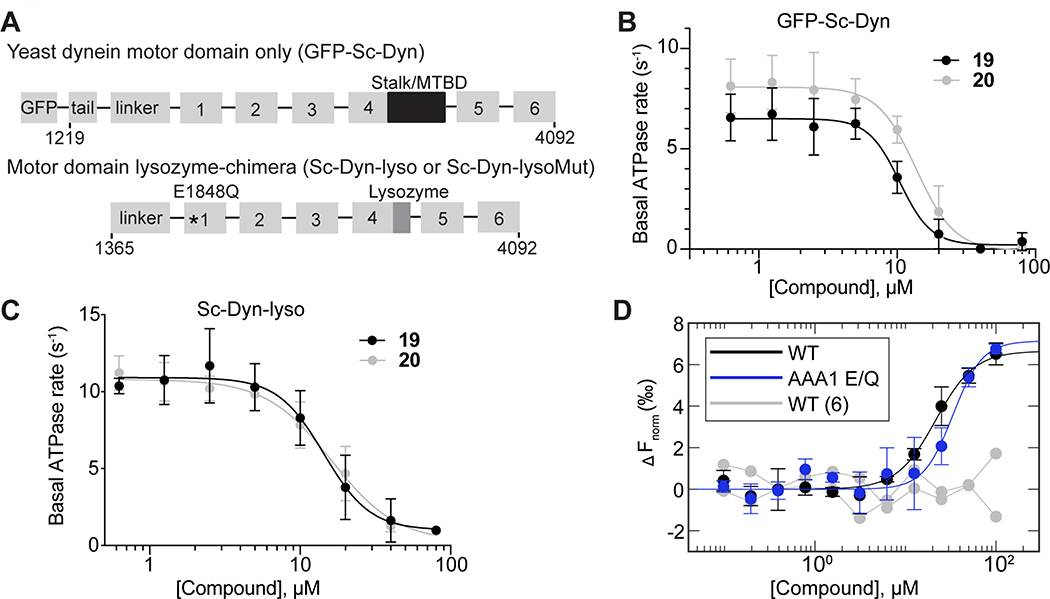
One of the highest resolution (~3.3 Å) structural models of the dynein motor domain was determined using S. cerevisiae dynein (Schmidt et al., 2012). Therefore, to maximize our chances of gaining structural insights into compound-motor domain interactions, we tested if compounds 19 and 20 also bound and inhibited S. cerevisiae dynein. For these experiments we first generated a previously described construct that contains the motor domain and has been characterized to be an active ATPase (VY137, aa. 1219–4093, hereafter, GFP-Sc-Dyn, Figures 2A, S1B) (Reck-Peterson et al., 2006). Dose-dependent analyses indicate that compounds 19 and 20 inhibit GFP-Sc-Dyn’s basal ATPase activity with an IC50 of 10 ± 1.2 and 14 ± 1.0 μM, respectively (1 mM MgATP, mean ± SD, n=3, Figure 2B).
Figure 2. Dynapyrazole derivatives inhibit Saccharomyces cerevisiae dynein.
(A) Schematic showing the domain organization for the S. cerevisiae dynein motor domain construct (GFP-Sc-Dyn) and either the WT lysozyme-chimera (Sc-Dyn-lyso) or lysozyme-chimera mutant constructs (Sc-Dyn-lysoMut). The position of the stalk and microtubule-binding domain (MTBD) in GFP-Sc-Dyn is shown (black box). A lysozyme replaces the MTBD and most of the stalk in the Sc-Dyn-lyso and Sc-Dyn-lysoMut constructs (dark gray box). The black asterisk indicates a Walker B mutation (E1849Q) in the AAA1 site of the Sc-Dyn-lysoMut construct. The first and last residues of each construct are indicated. (B) Steady-state ATPase activity of GFP-Sc-Dyn in the presence of compound 19 or 20. Data are mean ± SD of n = 3 and were fit to a sigmoidal dose-response curve (Equation 1). (C) Steady-state ATPase activity of Sc-Dyn-lyso in the presence of either compound 19 or 20. Data are mean ± SD of n = 3 and were fit to a sigmoidal dose-response curve (Equation 1). (D) Microscale thermophoresis analysis of compound 20’s interactions with Sc-Dyn-lyso (WT) and Sc-Dyn-lysoMut (AAA1 E/Q). Data are shown as mean ± SD and were fit using Equation 3 (n = 3). For compound 6, which was used as a negative control, the individual data points are shown from two independent experiments. ΔFnorm values were calculated using Equation 4 (See STAR methods).
S. cerevisiae constructs that contain a Walker B mutation in the AAA1 site (E1849Q) and in which the microtubule binding domain (MTBD) and most of the coiled-coil stalk are replaced with lysozyme (VY972, hereafter, Sc-Dyn-lysoMut) have been shown to be well-suited for structural studies using X-ray crystallography and cryo-EM (Figures 2A, S1B) (Bhabha et al., 2014). As this construct is not an active ATPase, we used a construct with a wild-type, hydrolysis-competent AAA1 domain (E1849) that is otherwise identical to Sc-Dyn-lsyoMut (VY1027, hereafter, Sc-Dyn-lyso) (Figures 2A, S1B) and determined that compounds 19 and 20 inhibit Sc-Dyn-lyso’s ATPase activity with an IC50 of 14 ± 4.9 μM and 15 ± 3.1 μM, respectively (1 mM MgATP, mean ± SD, n=3, Figure 2C).
For structural studies, we focused on compound 20, as bromine’s anomalous diffraction could help locate the compound in the X-ray diffraction data (Arkhipova et al., 2017). To examine binding of compound 20 to Sc-Dyn-lyso and Sc-Dyn-lysoMut, we used microscale thermophoresis (MST), a technique that monitors temperature-induced changes in the mobility of fluorescent molecules as a readout to measure intermolecular interactions (Jerabek-Willemsen et al., 2014). We find that compound 20 binds Sc-Dyn-lyso and Sc-Dyn-lysoMut with an EC50 of 22 ± 5.3 μM and 34 ± 11 μM, respectively (mean ± 95% confidence interval (CI), n=3, Figure 2D). We also tested compound 6, which does not inhibit the ATPase activity of Hs-dynein 1 at 20 μM (Figures 1D, S1A), and found that it did not bind Sc-Dyn-lyso (n=2, Figure 2D). These results indicate that a Walker B mutation at the AAA1 site in dynein does not affect compound 20 binding, suggesting that the compound may not bind at the main catalytic site in dynein. Importantly, these data suggest that the Sc-Dyn-lysoMut construct can be employed for our structural studies in the presence of compound 20.
X-ray model of S. cerevisiae dynein (Sc-Dyn-lysoMut) in the presence of a dynapyrazole derivative
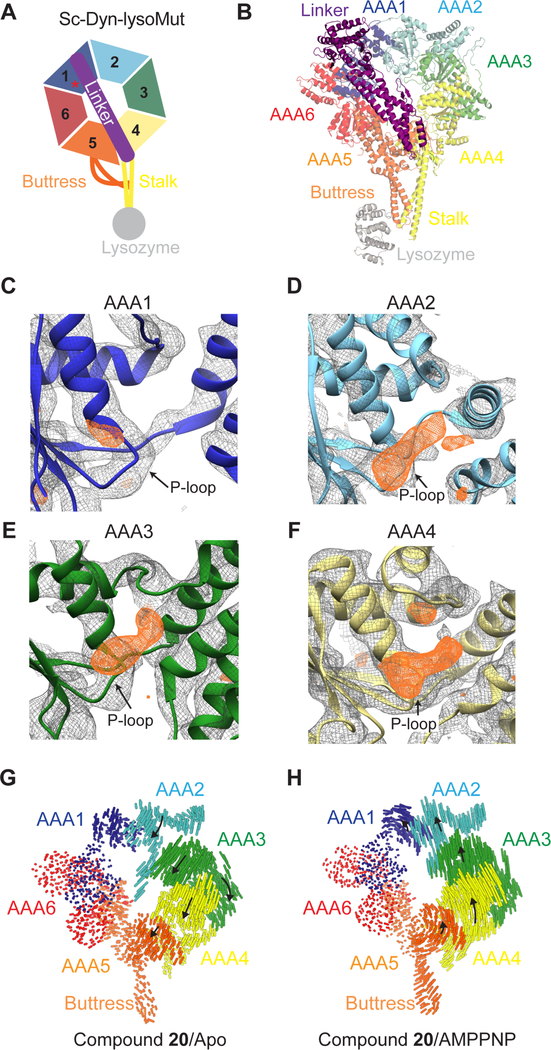
We obtained diffracting crystals of Sc-Dyn-lysoMut in the presence of compound 20 and in the absence of nucleotide. We note that our screening conditions were based on those previously reported for this construct in the presence of the slowly-hydrolyzable nucleotide analog, adenylyl imidodiphosphate (AMPPNP) (Bhabha et al., 2014). We solved the structure by molecular replacement to ~4.5 Å resolution (Figures 3A, 3B and Table S1). At this resolution most of the α helices are well resolved but many of the individual β strands are not (Figure S2A). Density for each of the six AAA domains, as well as the linker, truncated stalk and lysozyme is observed (Figure 3B).
Figure 3. X-ray model of Sc-Dyn-lysoMut in the presence of compound 20.
(A) Schematic of the Sc-Dyn-lysoMut construct. Individual AAA domains are shown (AAA1: blue, AAA2: light blue, AAA3: green, AAA4: yellow, AAA5: orange, AAA6: red). Linker (purple), buttress (orange), stalk (yellow) and lysozyme (gray) are also depicted. Red asterisk indicates that the construct contains a Walker B mutation (E1848Q) in the AAA1 domain. (B) Refined model of Sc-Dyn-lysoMut (PDB: 7MI6, See Table S1). Domains are color-coded based on the schematic shown in Figure 3A. (C-F) 2Fo – Fc (gray mesh, 1.0 σ contour) and Fo – Fc (orange mesh, 3.0 σ contour) densities are shown in the AAA1 (C), AAA2 (D), AAA3 (E), and AAA4 (F) domains. Figures were prepared in Chimera using the zone function with an applied radius of 2 Å. (G, H) Visualization of the inter α-carbon distances between the X-ray model and either the apo (PDB: 4AKG) (G) or AMPPNP (PDB: 4W8F) model (H). Models were aligned on the AAA1-L subdomain. Linker was removed for clarity. Black arrows indicate direction of domain movement in the X-ray model relative to either of the two nucleotide states, while the size of the arrow indicates the magnitude of movement.
We first analyzed electron density in the nucleotide-binding pockets that are not accounted for by the protein backbone. In the AAA1 domain, a small positive electron density is observed near the P-loop in the Fo-Fc map (Figure 3C). Based on its overall size, this density may correspond to an anion (Figure 3C). In the AAA2, AAA3 and AAA4 nucleotide-binding sites, electron densities are present in both the 2Fo-Fc and Fo-Fc maps (Figures 3D–3F). These densities are larger than what would be expected for an anion or water molecule and may correspond to either nucleotide or compound 20, but are not resolved enough to interpret. In addition, an anomalous signal was not detected in the diffraction data, possibly due to the flexibility of the bromo-phenyl moiety, low compound affinity, or the current resolution. Overall, hints of additional density were observed in the AAA2, AAA3 and AAA4 nucleotide-binding sites, but establishing their identity was not possible based on these data alone.
We next examined the conformation of the individual AAA domains. The AAA1 domain is in an open conformation, similar to what is observed in the nucleotide-free model of S. cerevisiae dynein (PDB: 4AKG, hereafter, apo-model) (Figures S2B–S2D), consistent with no nucleotide or chemical inhibitor bound. In the apo-model, the AAA3 domain adopts a semi-closed conformation relative to the AAA1 domain, which can close further upon nucleotide binding (Bhabha et al., 2014; Kon et al., 2012; Schmidt et al., 2012; Zhang et al., 2017). The conformation of the AAA3 domain in our X-ray model is similar to that of the apo-model (Figures S2E–G), indicating that nucleotide is not bound to this site in dynein under our crystallization conditions.
We also examined the overall conformation of the AAA ring in the presence of compound 20. We observed that the linker is extended and docked onto the AAA5-L subdomain (Figure 3B), indicating that the motor domain is in a post-powerstroke state (Burgess et al., 2003). Therefore, we aligned the Sc-Dyn-lysoMut X-ray model (hereafter, X-ray model) to other structural models of S. cerevisiae dynein with a similarly extended linker conformation such as those that represent the nucleotide-free (PDB: 4AKG) and AMPPNP-bound states (PDB: 4W8F, hereafter AMPPNP-model) (Bhabha et al., 2014; Schmidt et al., 2012). Alignment of the X-ray model with the apo-model on the AAA1-L subdomain revealed that the stalk, buttress and the AAA5-AAA6 domains adopt similar conformations (Figure 3G). However, the AAA2/AAA3/AAA4 domains, as a unit, rotate (~8°) towards the linker, when compared to the apo-model. A similar alignment showed that the AAA2/AAA3/AAA4 unit has rotated much less in the X-ray model compared to the AMPPNP-model (Figure 3H). The AAA ring is also more planar in the X-ray model compared to the apo-model, but less planar than that in the AMPPNP-model (Figures S2H, S2I, and S2J). Taken together, the X-ray model reveals a conformational change in one-half of the AAA ring, despite the lack of nucleotide or chemical inhibitor density in the AAA1 site. Interestingly, this conformation has only been observed in structural models of dynein where AMPPNP is bound to the AAA1 site (Bhabha et al., 2014; Niekamp et al., 2019). However, a higher resolution model of Sc-Dyn-lysoMut in the presence of compound 20 is needed to determine if the inhibitor binds to the AAA3 and/or AAA4 sites.
Cryo-EM model of S. cerevisiae dynein (Sc-Dyn-lysoMut) in the presence of compound 20
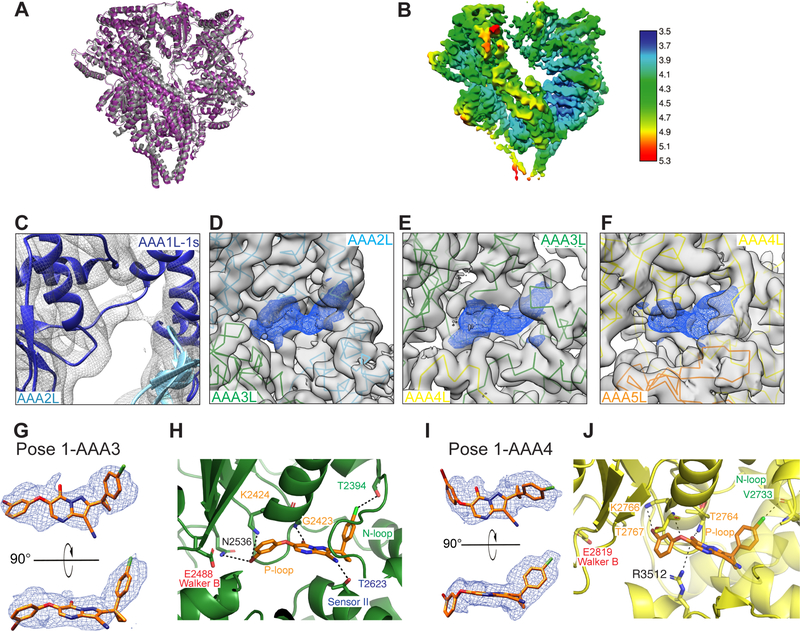
Our X-ray model revealed the conformation of the AAA ring in the presence of compound 20, but the resolution did not allow us to identify the binding site(s) of the chemical inhibitor. Therefore, we next turned to single-particle cryo-EM studies, using the same mutant construct (Sc-Dyn-lysoMut) we used for X-ray crystallography (Bhabha et al., 2014). We hypothesized that cryo-EM may lead to a higher resolution model for the motor protein, as we would have the opportunity to classify compositional and conformational heterogeneity, which may be limiting the resolution of our X-ray structure. We prepared samples of Sc-Dyn-lysoMut in the presence of compound 20 at a concentration (80 μM) that would ensure that the majority (~70%) of the dynein molecules would be bound to the inhibitor and the compound would remain in solution. Nucleotide was not added to the sample. The data acquisition and processing is described in detail in the STAR methods section and Figure S3. After 3D classification and refinement we obtained a reconstruction with an average resolution of ~3.9 Å with 136,180 particles (Map 1, Figures S3B and S4C). We found that the overall conformation of dynein’s AAA ring in this model (hereafter, Model 1, Figure SF4) was similar to that observed in our X-ray model (Figure 4A), as indicated by the root-mean square displacement (RMSD) of as indicated by the root-mean square displacement (RMSD) of 1.344 Å(1561 c-α positions).
Figure 4. Cryo-EM model of Sc-Dyn-lysoMut in the presence of compound 20.
(A) X-ray model (gray) aligned to the cryo-EM composite model of Sc-Dyn-lysoMut (purple, Model 1, PDB: 7MI6, See Table S2). Lysozyme is omitted from the X-ray model for calculation of RMSD between the two models. (B) EM map (Map 1, EMD-23841) of Sc-Dyn-lysoMut colored by local resolution, as estimated by RELION 3.0. (C-E) EM density corresponding to the nucleotide-binding sites of either the AAA1 (Model 1, Map 2, PDB: 7MI6, EMD-23844) (C), AAA2 (Model 4, Map 4, PDB: 7MI3, EMD-23838) (D), AAA3 (Model 4, Map 4) (E), or AAA4 (Model 4, Map 4) (F) domains. Densities (Map 4,) corresponding to the Sc-Dyn-lysoMut model (AAA2L: cyan, AAA3L: green, AAA4L: yellow, AAA5L: orange) are shown in gray, whereas densities (Map 4) for the ligand are shown as blue meshes. For each AAA domain, the location of the large and/or small subdomains are indicated. (G) Two views of pose 1-AAA3 overlayed with the EM density (Map 4, blue mesh). Compound 20 is shown as a stick model (carbon: orange, oxygen: red, nitrogen: blue, chlorine: green, bromine: dark red). (H) View of compound 20 in the nucleotide-binding site of the AAA3 domain (Model 4, PDB: 7MI3). The predicted inhibitor-protein interactions (black dashed line) are shown (N-loop: green, P-loop: yellow, sensor II: blue) (I) Two views of pose 1-AAA4 overlayed with the EM density (Map 4, blue mesh). Compound 20 is shown as a stick model (carbon: orange, oxygen: red, nitrogen: blue, chlorine: green, bromine: dark red). (J) View of compound 20 in the nucleotide-binding site of the AAA4 domain (Model 4, PDB: 7MI3). The predicted inhibitor-protein interactions (black dashed line) are shown (N-loop: green, P-loop: yellow, sensor II: blue, arginine finger: gray).
Based on the differences in local resolution (Figure 4B), it was clear that heterogeneity within the AAA ring was still limiting the resolution of the EM map. Therefore we used masking, signal subtraction, and 3D classification to process densities corresponding to the AAA2-AAA4, AAA5-AAA6 and AAA6-AAA2 domains separately, resulting in three independent reconstructions (See STAR methods, Figure S3B). This process revealed heterogeneity in the AAA1 domain, such that density for the AAA1-S subdomain is either present (Map 2, ~4.5 Å) or weak/missing (Map 3, ~7.9 Å). For Map 2, which has AAA1 domain better defined, we can conclude that AAA1 is in an open state, as expected when it is nucleotide-free, based on rigid body docking of each subdomain. Overall, the density for AAA1 suggests flexibility in this domain. After further masking and signal subtraction, we obtained higher resolution maps of the AAA2/AAA3/AAA4 (Map 4, Model 4, ~3.5 Å) and AAA5/AAA6 domains (Map 5, Model 5, ~3.7 Å) (Figures S3B, S4D and Table S2). As expected for these resolutions, densities for many amino acid side chains are observed (Figure S4E).
The cryo-EM map revealed no additional density in the AAA1 nucleotide-binding pocket, (Figure 4C), which is consistent with the observation that the AAA1 domain adopts an open conformation. However, the AAA2, AAA3 and AAA4 nucleotide-binding pockets all clearly show the presence of additional density that is not accounted for by the protein (Figure 4D–4F). AAA2 lacks catalytic activity and is expected to be constitutively bound to ATP (Schmidt et al., 2012). Indeed, the map reveals a ligand density in the AAA2 nucleotide-binding site that is consistent with the size and shape of ATP (Figure S5A).
We next examined the cryo-EM map that corresponds to the AAA3 and AAA4 binding sites, which revealed additional densities that are consistent with the size and shape of compound 20 (Figures 4G and 4I). Three lines of evidence suggest that this density does not correspond to nucleotide. First, the AAA3 domain is in a semi-closed conformation, similar to our X-ray model and the apo-model (PDB: 4AKG) (Figure S5D). Second, the protein was purified in the absence of nucleotide, which is unlikely to yield a protein containing ATP or ADP in the AAA1, AAA3 and AAA4 sites, as previously shown (Schmidt et al., 2012). Third, if nucleotide were present, we would expect it to be bound at AAA1, especially since the E1849Q mutation renders this domain hydrolysis deficient and would retain nucleotide in the binding site. Therefore, we posit that the densities in the AAA3 and AAA4 sites correspond to compound 20, which was present in 50-fold molar excess in our sample relative to the protein concentration.
Computational docking of compound 20 into the proposed inhibitor binding sites
The local resolution of our cryo-EM reconstruction at the inhibitor binding sites is not high enough to unambiguously identify the inhibitor binding pose. Therefore, we performed computational docking of compound 20 into the AAA3 and AAA4 sites and ATP into the AAA2 site (Map 4) using the GlideEM script in the Schrodinger software (Schrodinger LLC, See STAR methods for additional details) (Robertson et al., 2019). This script utilizes the GLIDE docking scoring function and the real space cross-correlation score to the EM map to generate binding poses of a ligand that are energetically favored and that can be accommodated by the density (Robertson et al., 2019). The enol tautomer of compound 20 was used for computational docking, which was calculated to be the major tautomer at pH 7 (See STAR methods). This analysis generated five candidate poses of compound 20 for the AAA3 site, and four poses for the AAA4 site (Figures 4G, 4I, S5B, S5C) (Robertson et al., 2019). For the AAA2 site, the GlideEM script revealed a pose of ATP that is similar to that previously reported (Schmidt et al., 2012). For the AAA3 and AAA4 sites, we selected the orientation of the ligand that best fits into the EM density, as indicated by the docking model-EM map correlation coefficient (hereafter, pose 1-AAA3 and pose 1-AAA4, with coefficients: 0.73 and 0.74, respectively) (Figures 4G, 4I, S5B and S5C) (Afonine et al., 2018).
For pose 1-AAA3, the 3-cyclopropyl-chlorophenyl moiety of compound 20 is buried in the adenine-binding pocket and is within van der Waals distance to hydrophobic residues in the N-terminal loop motif (N-loop) (Figures 4H and S5E). The backbone of the phosphate-binding loop (P-loop) residue G2423, which interacts with the β-phosphate of AMPPNP in the AMPPNP-model (chain B), forms a hydrogen-bonding interaction with the carbonyl oxygen of the enolate-pyrimidinone moiety (Figures 4H and S5E) (Bhabha et al., 2014). The N-loop residue, T2394, forms a halogen-bonding interaction with the chloro-phenyl moiety. The threonine in the sensor II motif (T2623) hydrogen bonds with the cyano moiety, while the catalytic lysine (K2424) and residue N2536 form halogen bonds with the bromo-phenyl group.
In pose 1-AAA4, compound 20 binds to the nucleotide-binding pocket in the AAA4 domain in a similar orientation shown for the AAA3 site (Figures 4J and S5F). The 3-cyclopropyl phenyl moiety fits into the adenine-binding pocket of the AAA4 site and is likely stabilized by hydrophobic interactions with N-loop residues V2730, P2731, and V2733. The chloro-phenyl moiety forms a halogen-bonding interaction with the backbone of N-loop residue V2733. Additionally, the arginine finger (R3512) and the backbone of P-loop residue, T2764, hydrogen bond with the carbonyl oxygen of the enolatepyrimidinone moiety. The backbone of P-loop residue T2767 forms a hydrogen-bonding interaction with the phenoxy moiety of compound 20. Taken together, these analyses suggest that compound 20 can adopt a similar orientation in both the AAA3 and AAA4 sites and is capable of forming a network of interactions with the P- and N-loops motifs in dynein.
Mutagenesis studies are consistent with compound 20 binding to dynein’s AAA3 and AAA4 domains
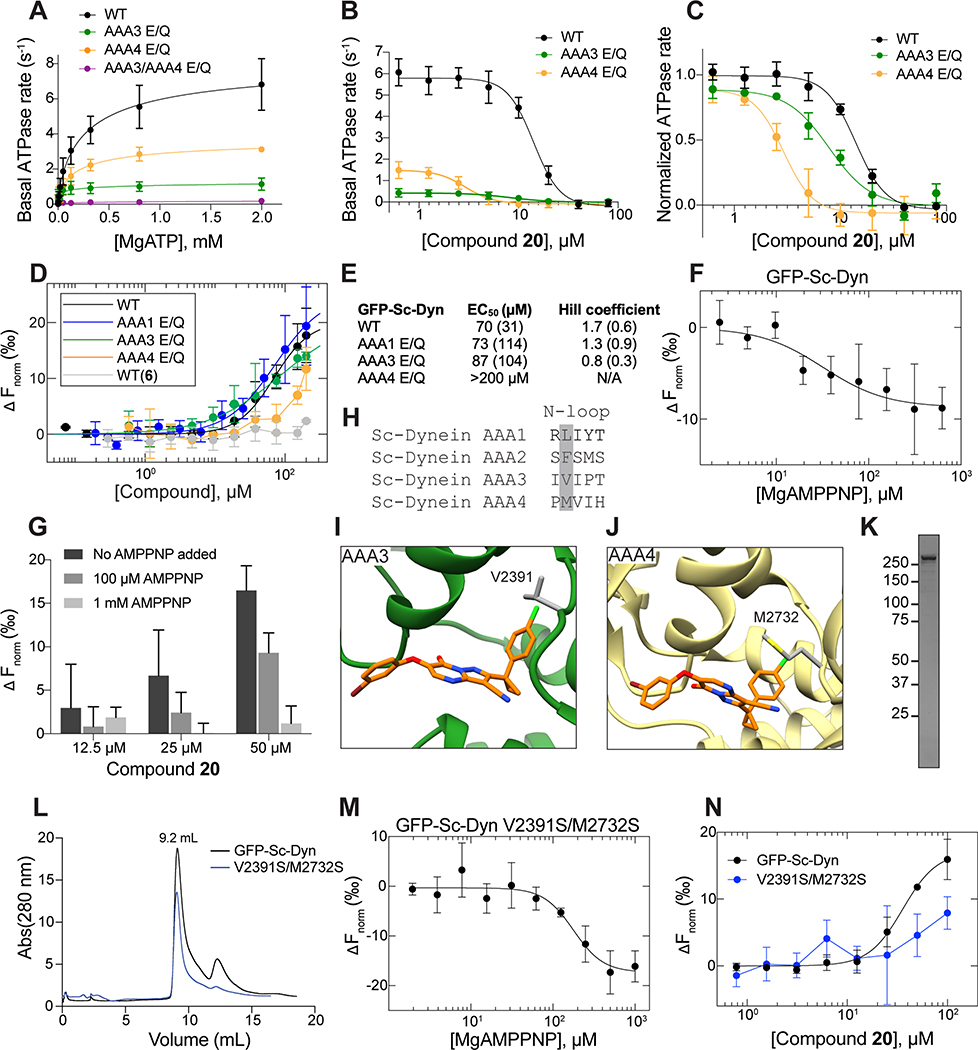
Our structural model suggests that simultaneously inhibiting AAA3 and AAA4 allosterically inhibits the enzyme, and we would then hypothesize that mutations inhibiting ATP hydrolysis in AAA3 and AAA4 would result in similarly low ATPase activity as a mutation inhibiting hydrolysis in AAA1. To test this hypothesis, we used GFP-Sc-Dyn mutants containing the following Walker B mutations: AAA3 E/Q (E2488Q), AAA4 E/Q (E2819Q), and AAA3/AAA4 E/Q (E2488Q/E2819Q). For each of the mutants, SDS-PAGE analysis suggested >90% purity (331 kDa) (Figure S1B). The basal catalytic turnover number (kcat) of GFP-Sc-Dyn and its mutants was measured using a steady-state ATPase assay (Figures 5A, S5I). GFP-Sc-Dyn had a kcat of ~8 s−1, which is within 2-fold of the published value (~4 s−1) for an S. cerevisiae dynein motor domain construct (n=5, Figures 5A, S5I, S5K) (Cho et al., 2008; DeWitt et al., 2015). The kcat values of the AAA3 E/Q and AAA4 E/Q mutants were reduced by ~6- and ~2-fold, respectively, relative to that of the GFP-Sc-Dyn, consistent with published results (Figures 5A, S5I, S5K) (Cho et al., 2008; DeWitt et al., 2015). Notably, Walker B mutations in both the AAA3 and AAA4 sites yielded an essentially inactive enzyme, with ATPase rates near the baseline under the assay conditions, similar to inhibition reported for the AAA1 E/Q mutation (Nicholas et al., 2015). These results suggest blocking ATP hydrolysis in the AAA3 and AAA4 sites is a plausible mechanism to inhibit dynein’s basal ATPase activity.
Figure 5. Testing mutant constructs to analyze binding of compound 20 to GFP-Sc-Dyn.
(A) ATP-concentration dependence of the steady-state activity of GFP-Sc-Dyn and its mutants, analyzed using an NADH-coupled assay. Rates were fit to the Michaelis–Menten equation for cooperative enzymes (mean ± SD, n=3, Equation 2). (B) Concentration-dependent inhibition of the steady-state ATPase activity of GFP-Sc-Dyn and its mutants by compound 20. Data were fit using a sigmoidal dose response equation (Equation 1). Data from GFP-Sc-Dyn and the mutants were collected side-by-side for this experiment. AAA3 E/Q and AAA4 E/Q mutants had an IC50 of 8.2 ± 1.4 μM and 2.9 ± 0.3 μM, respectively (mean ± SD, n=3). (C) Data from panel B replotted as rate relative to DMSO control. (D) Microscale thermophoresis analyses of GFP-Sc-Dyn and its Walker B mutants in the presence of compound 20. Data are shown as mean ± SD and fitted using the Hill equation (n=3, Equation 3). Fits were weighted by the inverse standard error of the mean at each data point. (E) EC50 values and hill coefficients are shown for each construct (fitted value, with 95% CI in parentheses). (F) Microscale thermophoresis analyses of GFP-Sc-Dyn in the presence of AMPPNP. Data are shown as mean ± SD and fitted using the Hill equation (n=3, Equation 3). ΔFnorm values were calculated using Equation 4. Fits were weighted by the inverse standard error of the mean at each data point. (G) Microscale thermophoresis analysis of compound 20’s interactions with GFP-Sc-Dyn in the presence or absence of AMPPNP. In the absence of AMPPNP, ΔFNorm values (mean ± SD, n=5) for each compound 20 concentration (parentheses) corresponds to 3.0 ± 5.0 (12.5 μM), 6.7 ± 5.2 (25 μM), and 16 ± 2.8 (50 μM) (mean ± SD, n=5, compound concentration in parentheses). In the presence of AMPPNP (100 μM), FNorm values for each compound 20 concentration corresponds to 0.8 ± 2 (12.5 μM), 2.4 ± 2.3 (25 μM), 9.3 ± 2.3 (50 μM) (mean ± SD, n=3, compound concentration in parentheses). In the presence of AMPPNP (1 mM), FNorm values (mean ± SD, n=3) for each compound 20 concentration corresponds to 1.9 ± 1.2 (12.5 μM), 0.1 ± 1 (25 μM), 1.2 ± 2 (50 μM) (mean ± SD, n=3, compound concentration in parentheses). (H) Sequence alignment of residues in the N-loop motif of Sc-Dynein’s nucleotide-binding domains. The residue position that was considered for mutagenesis is highlighted (gray box). (I) View of compound 20 in the nucleotide-binding site of the AAA3 domain (Model 4, PDB: 7MI3). N-loop residue V2391 is shown (gray). (J) View of compound 20 in the nucleotide-binding site of the AAA4 domain (Model 4, PDB: 7MI3). N-loop residue M2732 is shown (gray). (K) SDS-PAGE analysis of a purified GFP-Sc-Dyn construct containing mutations V2391S and M2732S (Coomassie blue). (L) Size-exclusion chromatogram of GFP-Sc-Dyn and its mutant (V2391S/M2732S). Elution volume is shown (9.2 mL). (M) Microscale thermophoresis analyses of AAA3_V-S/AAA4_M-S in the presence of AMPPNP. Data are shown as mean ± SD and fitted using the Hill equation (n=3, Equation 3). Fits were weighted by the inverse standard error of the mean at each data point. (N) Microscale thermophoresis analysis of compound 20’s interactions with GFP-Sc-Dyn and its mutant (V2391S/M2732S). Data are shown as mean ± SD and fitted using the Hill equation (n=3, Equation 3). Fits were weighted by the inverse standard error of the mean at each data point.
We next examined if the Walker B mutations in the AAA3 and AAA4 sites affect the potency of compound 20 in the steady-state ATPase assay. Compound 20 inhibited GFP-Sc-Dyn with an IC50 of 14 ± 0.8 μM (1 mM MgATP, mean ± SD, n=3, Figures 5B–C). The AAA3 E/Q and AAA4 E/Q mutants were more sensitive to compound 20 inhibition, with IC50 values ~2- and ~5-fold lower than that of GFP-Sc-Dyn, respectively (1 mM MgATP, n=3, Figures 5B–C). We note that compound 20’s shift in potency was not due to a decrease in the mutants’ affinity for ATP, as indicated by the K1/2 (Figure S5J, S5K). These data show that blocking ATP hydrolysis in either AAA3 or AAA4 via Walker B mutations increases the sensitivity of dynein to compound 20 inhibition.
Since the ATPase assay is a combined readout of ATP hydrolysis in the AAA1, AAA3, and AAA4 sites, the effect of the Walker B mutations on compound 20’s activity is not a direct indicator of binding. We therefore measured the binding of compound 20 to GFP-Sc-Dyn using microscale thermophoresis (MST). Compound 20 bound to GFP-Sc-Dyn with an EC50 of 70 ± 31 μM and a hill slope of 1.7 ± 0.6, indicating positive cooperativity (mean ± 95% CI, n=9, Figures 5D–E). Complete saturation of the binding curve could not be obtained, likely due to limited compound solubility in this assay. As a control, we also tested compound 6, and could not detect binding to GFP-Sc-Dyn in this assay (Figure 5F). We also tested AMPNPN binding to GFP-Sc-Dyn using MST analysis and measured an EC50 of 25 ± 20 μM (mean ± 95% CI, n=3, Figure 5F). At 50 μM compound 20, we observed that AMPPNP (100 μM) reduced the ΔFNorm value by ~44% relative to the control (Figure 5G). The higher concentration of AMPPNP (1 mM) further reduced compound 20 binding to yield anΔFNorm that was ~93% lower than that of the WT control (Figure 5G). These findings support our structural data showing that compound 20 interacts with dynein’s ATPase sites and may directly compete with nucleotide binding.
We next used MST to examine the binding of compound 20 to the AAA1 E/Q (E1849Q) mutant (Figure S1B). Compound 20 binds this mutant with an affinity that is similar to that for the WT construct (EC50 of 73 ± 114 μM and a hill slope of 1.3 ± 0.9, mean ± 95% Cl, n=4, Figures 5D–E). While compound 20 bound the AAA3 E/Q mutant bound with a similar EC50 (EC50: 87 ± 104 μM, mean 95% Cl, n=4), we observed a significant reduction in the hill slope relative to that measure for GFP-Sc-Dyn (h: 0.8 ± 0.3, mean ± 95% Cl, n=4), suggesting loss of cooperativity (Figures 5D–E). Notably, compound 20 binding to the AAA4 E/Q mutant was substantially decreased compared to the WT protein (EC50: >200 μM, n=4, Figures 5D–E).
Residues V2391S and M2732S are located in the N-loop motif of the AAA3 and AAA4 domains, respectively, and could interact with the chloro-phenyl moiety of compound 20 (Figures 5H–J, S5E–F). We therefore reasoned that mutating these residues to serine could disrupt hydrophobic interactions with compound 20. SDS-PAGE (Figure 5K) and size-exclusion chromatography (Figure 5L) analysis showed that the V2391S/M2732S mutant (hereafter, AAA3_V-S/AAA4_M-S) was purified to homogeneity (331 kDa). AAA3_V-S/AAA4_M-S was still able to interact with AMPPNP (EC50: 180 ± 78 μM, mean ± 95% CI, n=3, Figure 5M). MST analysis revealed that these N-loop mutations reduced compound 20 binding (EC50: >100 μM, n=4) relative to WT GFP-Sc-Dyn (36 ± 7.8 μM, mean ± 95% CI, n=4, Figure 5N). Taken together, the MST data are consistent with compound 20 interacting with the adenine-binding sites of the AAA3 and AAA4 domains.
Compound 20 inhibits dynein motility
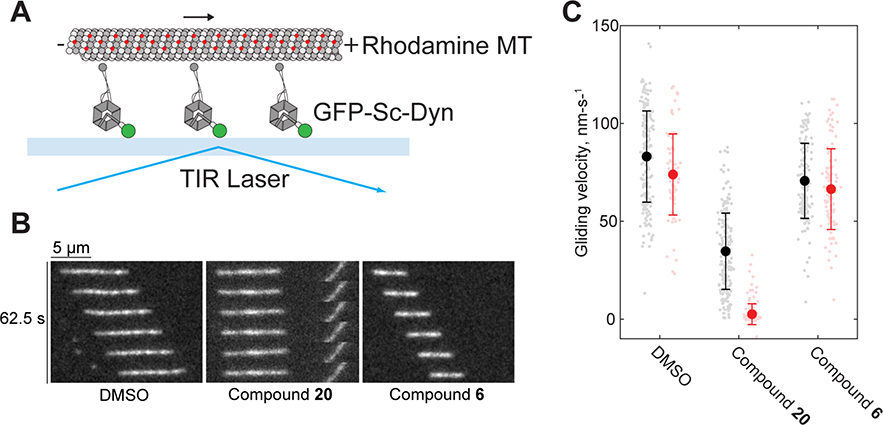
To test the effect of compound 20 on GFP-Sc-Dyn motility, we performed microtubule gliding assays. The GFP tag in GFP-Sc-Dyn allowed the motor protein to be immobilized onto glass coverslips (Figure 6A). Treatment with compound 20 led to time-dependent inhibition of gliding, with most microtubules becoming immotile within 30 min (Figures 6B and 6C). Interestingly, we observed that short microtubules (~2 μm) partially detached when compound 20 was present (white arrows, Movie S1). Treatment with the control compound 6 was comparable to DMSO (Figures 6B and 6C). These data are consistent with the near complete inhibition of Hs-Dynein’s microtubule-stimulated ATPase activity by compound 20 (Figure 1F), as microtubule gliding is dependent on dynein’s ability to bind and hydrolyze ATP.
Figure 6. Microtubule gliding assay in the presence of compound 20.
(A) Schematic of microtubule gliding assay. GFP-Sc-Dyn, rhodamine-labeled microtubule (MT), coverslide (light blue) and total internal reflection fluorescence (TIRF) laser are indicated. (B) Montages of fluorescent microtubules moving on GFP-Sc-Dyn-coated glass coverslips in the presence of 1% DMSO or compounds 6 and 20 (25 μM) after 30 minute incubation. See also Movie S1. (C) Measurements were made both immediately (black) after treatment (1% DMSO: 83 ± 23 N=190, 25 μM compound 20: 35 ± 19 N=202, 25 μM compound 6: 71 ±1 9 N=149) and 30 minutes (red) after treatment (1% DMSO: 73 ± 21 N=85, 25 μM compound 20: 3 ± 5 N=155, 25 μM compound 6: 66 ± 21 N=103). The two timepoint measurements were taken in the same flow cells. Data pooled from four flow cells per condition, taken over two experimental days using two separate preparations of GFP-Sc-Dyn. Each measurement shown as a light color point, mean ± standard deviation shown in bold color.
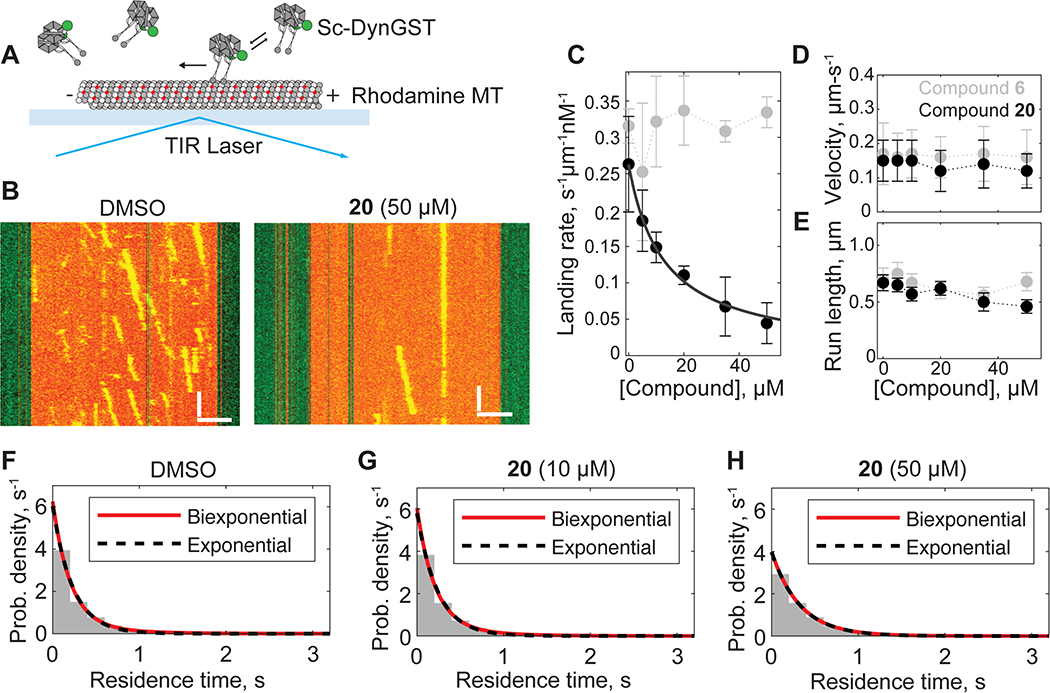
We next performed single-molecule motility assays (Figure 7A). For these studies we used an N-terminal GFP-tagged GST-dimerized motor (VY208; hereafter, Sc-DynGST), as the motility parameters for this dynein construct have already been characterized (Bhabha et al., 2014; Cho et al., 2008; DeWitt et al., 2015; Reck-Peterson et al., 2006). We measured the landing rate, velocity, and processivity (run length) of Sc-DynGST motors on rhodamine-labeled, taxol-stabilized microtubules, which were attached to glass coverslips, over a range of compound 20 concentrations (Figure 7). We found that compound 20 induces a dose-dependent decrease in the landing rate, or the number of new dynein motility events per unit time per unit microtubule length per nM dynein (Figures 7B and 7C). The EC50 for the dynein landing rate was 12.7 ± 2.5 μM (fit ± 95% CI), which is within error of the IC50 for Sc-Dyn-lyso’s basal ATPase activity in the presence of compound 20 (Figures 2C and 7C). Hence, the presence of compound 20 reduces dynein’s ability to bind microtubules.
Figure 7. Using single molecule assays to analyze the inhibition of S. cerevisiae dynein by compound 20.
(A) Schematic of microtubule motility assay. Sc-DynGST, rhodamine-labeled microtubule (MT), coverslide (light blue) and total internal reflection fluorescence (TIRF) laser are indicated. (B) Example kymographs of Sc-DynGST in the presence of 1% DMSO or compound 20 (50 μm). Kymograph horizontal scale bar, 2.5 μM; kymograph vertical scale bar, 5 s. (C) Analysis of Sc-DynGST landing rates on microtubules in the presence of either compound 6 or 20. For compound 6, data are shown as mean ± SD for three independent experiments containing a total of 657–794 motile events from 78 microtubules in each condition. Dotted gray line is to guide the eye. For compound 20, data are shown as mean ± SD for n = 3–4 independent experiments containing a total of 219–1097 motile events from 58–86 microtubules, and fitted to a sigmoidal dose-response equation. (D-E) Velocities (D) and run lengths (E) of Sc-DynGST motors at various concentrations of either compound 6 or 20. Velocities determined as sample mean ± SD and run lengths determined as fit ± bootstrapped error using an offset exponential fit to the cumulative density function for n=210–259 measurements for compound 6 and n=193–390 measurements for compound 20 (data pooled from 3–4 independent experiments). Entire distributions are shown in Figures S6 and S7. Dotted lines are shown to guide the eye. (F-H) Probability distribution of residence times of individual Sc-DynGST molecules within 50-nm bins along the direction of motion, following a published method (DeWitt et al., 2015). Here significant pausing should yield a second, slower, exponential phase. Fitting to single exponentials (black dashed lines) and biexponentials (red lines) yielded nearly identical results. Data are also shown in Figure S7.
The presence of compound 20 had little to no effect on dynein’s velocity or processivity (Figures 7D, 7E and S6), once a dynein molecule landed on a microtubule. We also observed no significant pausing during processive runs (Figures 7F–7H and S6), as has been seen when AAA3 is locked in an ATP-like state (DeWitt et al., 2015). However, we posit that the few dynein dimers that can walk on microtubules are those without compound 20 bound. As a compound control, we repeated the single-molecule assay with compound 6. The landing rate, velocity, and run length of Sc-DynGST were not sensitive to this compound (Figures 7C–E and S7). Taken together, these data show that compound 20 inhibits dynein motility by reducing the protein’s ability to bind microtubules.
Discussion
Here we describe derivatives of dynapyrazoles that inhibit the ATPase activity of human dynein 1 and S. cerevisiae dynein, and report X-ray and cryo-EM models of the dynein motor domain in the presence of compound 20. The resolution of our cryo-EM model is comparable to that of prior X-ray models of the S. cerevisiae dynein motor domain (3.3–3.8 Å) (Bhabha et al., 2014; Schmidt et al., 2012), and is higher than those reported for other cryo-EM models of the dynein motor domain (~7–20 Å) (Bhabha et al., 2014; Niekamp et al., 2019; Toropova et al., 2014). Our cryo-EM model reveals that compound 20 binds to the regulatory ATPase sites in the AAA3 and AAA4 domains. These data are supported by mutagenesis studies and functional assays. Together, our findings suggest that compound 20 inhibits dynein’s ATPase activity by disrupting allosteric communication across the AAA ring.
Our binding data suggests that compound 20 interacts with the AAA3 and AAA4 domains. However, mutating the Walker B motif in each of the two domains resulted in different effects on compound 20 binding. For the AAA3 E/Q mutant, the EC50 was similar to that of the WT protein, but the hill slope was reduced. For the AAA4 E/Q mutant, the EC50 substantially increased compared to that of the WT protein. The environment of the AAA3 and AAA4 Walker B residues are different, as previously suggested (Schmidt et al., 2012), which may explain these binding data. Reduced compound 20 binding to the AAA3 Walker B (E2488Q) mutant can likely be explained by the observation that the E2488 residue is within ~5 Å of the ligand. However, the Walker B residue (E2819) in the AAA4 domain is ~9 Å away from compound 20, and therefore likely does not directly interact with the inhibitor and a longer-range effect reduces compound binding.
Our data indicate that compound 20 interacts with ATP-binding motifs, where the cyclopropyl-phenyl moiety is buried within the adenine-binding site, and the halo-phenoxy enolatepyrimidinone moieties interact with the P-loop motif (S5E-F). This model is supported by our MST data of AAA3_V-S/AAA4_M-S, which shows that altering the adenine-binding site via N-loop mutations reduces compound 20 binding to dynein. Our model may explain why compounds with phenyl-ether substitutions at the 6-position, with substituents at the para or ortho positions (i.e. compounds 17-20), inhibit human dynein’s ATPase activity (Figures 1D, S1A). Notably, the proposed inhibitor-target interactions are different from those observed for other active-site binding chemical inhibitors of AAA proteins, such as spastazoline and CB-5083, which contact residues in the N-loop and sensor II motifs (Pisa et al., 2019; Tang et al., 2019). Further studies will examine if modifying the scaffold to allow for hydrogen-bonding interactions with the N-loop motif can lead to an improvement in potency.
Consistent with the ATPase assays, the gliding assay revealed that compound 20 reduced GFP-Sc-Dyn-driven microtubule gliding velocities (Figures 6B and 6C). It is worth noting that a similar reduction in velocity was not observed in the single-molecule motility assay. Instead, we observed a reduced landing rate, indicating that microtubule affinity is modulated by the compound (Figure 7). This difference may be due to the differences in the design of the assays. Since monomeric GFP-Sc-Dyn requires the collective action of multiple molecules to glide microtubules, our assay conditions may lead to slowed velocity rather than microtubule dissociation if some, but not all, of the dynein molecules were in a low-microtubule-affinity state. For complete microtubule dissociation in the gliding assay, compound 20 may need to simultaneously bind to every dynein present on a given gliding microtubule. Given that the inhibitor is nucleotide-competitive and the gliding assay is performed in the presence of 1 mM MgATP, a fraction of the dynein molecules are likely not bound to compound 20. Consistent with this idea, shorter microtubules, which have fewer bound dynein molecules, were observed to partially detach in the gliding assay with compound 20 present, but not in control conditions (white arrows, Movie S1). Therefore, the data from both the microtubule gliding and single-molecule motility experiments may be consistent with compound 20 reducing dynein’s ability to bind microtubules.
The dynapyrazole derivative binds to the AAA3 and AAA4 sites, resulting in a conformational change in the AAA ring relative to both the apo- and AMPPNP-model. Current models suggest that ATP binding to the AAA1 site initiates a rigid body movement of the AAA2/AAA3/AAA4 unit towards the linker domain (Bhabha et al., 2014; Schmidt et al., 2015). These conformational changes are propagated to the other half of the ring (AAA5/AAA6), which in turn pulls the buttress motif relative to the stalk domain to alter microtubule binding affinity (Bhabha et al., 2014; Niekamp et al., 2019; Schmidt et al., 2015). In our model, compound 20 binding to the AAA3 and AAA4 sites results in a rotation of the AAA2/AAA3/AAA4 block towards the linker domain to produce a more planar AAA ring, a conformation that is intermediate between the apo and AMPPNP-bound states. Similar conformational changes were observed in a model of a dynein stalk mutant solved in the presence of AMPPNP (Niekamp et al., 2019). This stalk mutation has been proposed to decouple the two halves of the AAA ring, resulting in weak microtubule binding affinity. We propose that compound binding to the AAA3 and AAA4 sites similarly interfere with the propagation of conformational changes between the two halves of the AAA ring, also resulting in weak microtubule attachment.
Dynein’s motor domain is a multi-site enzyme with a complex allostery that can be leveraged for the development of new inhibitors. We show that the ATP-binding pockets of the AAA3 and AAA4 domains are druggable allosteric sites that can be targeted to inhibit the main catalytic activity in AAA1. Interestingly, both compound 20 and the dynein regulator Pac1/Lis1 can modulate dynein’s activity and microtubule binding by engaging the AAA3 and AAA4 domains, thereby exploiting the network of interactions across the motor domain (DeSantis et al., 2017). Thus, our data reveal a strategy to inhibit S. cerevisaie dynein’s ATPase activity, and future work will investigate whether this mechanism applies to different isoforms of human dynein, such as dynein 2.
Significance
Designing potent and selective chemical probes for large, multi-domain enzymes such as dynein can be challenging without structural models for inhibitor-target binding. We employ structural approaches to analyze how pyrazolo-pyrimidinone-based compounds bind a well-characterized construct of S. cerevisiae dynein. Our findings indicate that these compounds interact with dynein’s regulatory ATPase sites in the AAA3 and AAA4 domains. We also show that disrupting ATP hydrolysis in the AAA3 and AAA4 domains through Walker B mutations results in an inactive enzyme. These data, together with activity assays and additional mutagenesis studies, suggest that the two regulatory AAA domains in dynein can be targeted by chemical inhibitors to block its motility. Our findings provide a framework that can help design potent and selective chemical probes for dynein’s essential functions across a wide range of dynamic cellular processes, including cell division and directional microtubule-based transport in neurons and immune cells.
RESOURCE AVAILIBILITY
Lead Contact
Further information and requests for resources and reagents should be directed to and will be fulfilled by the Lead Contact, Tarun M Kapoor (kapoor@rockefeller.edu).
Materials Availability
New yeast strains generated in this study will be made available upon request.
Data and Code Availability
Cryo-EM maps have been deposited in the EMDB under accession codes EMD-23841 (Map 1), EMD-23844 (Map 2), EMD-23846 (Map 3), EMD-23838 (Map 4), EMD-23842 (Map 5). Coordinates are available from the RCSB Protein Data Bank under accession codes 7MI6 (Model 1), 7MI3 (Model 4), and 7MI8 (Model 5). The crystal structure of Sc-DynlysoMut has been deposited in RCSB Protein Data Bank under accession code 7MI1. All other data generated or analyzed during this study are available in this article or from the corresponding author on reasonable request.
EXPERIMENTAL MODEL AND SUBJECT DETAILS
Yeast strains and culture media
Saccharomyces cerevisiae strains VY137, VY208, VY972 and VY1027 were gifts from R.D. Vale (University of California, San Francisco). Yeast cells were cultured in 2X yeast extract-peptone-dextrose medium (YPD media, containing 20 g/L yeast extract, 40 g/L peptone, 40 g/L dextrose). Protein expression was induced by 2X yeast extract-peptone-galactose media (YPG media, containing 20 g/L yeast extract, 40 g/L peptone, 20 g/L galactose). All cultures were grown in 4 L Erlenmeyer flasks at 30°C with 150 rpm shaking for 24 hours. When preparing plates, 1X YPD (10 g/L yeast extract, 20 g/L peptone, 20 g/L dextrose) was solidified by the addition of 2% Bacto agar.
Microbial strains
Escherichia coli BL21 Rosetta™ (DE3) pLysS cells were grown in 4 L Erlenmeyer flasks containing 1 L Miller’s LB medium (LMM, Formedium, catalog #LMM105) supplemented with 34 mg/L chloramphenicol and either 100 mg/L of ampicillin or 50 mg/L kanamycin. Cultures were shaken (200 rpm) at 37°C.
Insect cells, culture media and virus production
Hs-dynein 1 was expressed using the pFastBac vector. To generate recombinant baculovirus, the Bac-to-Bac system was used (ThermoFisher). Spodoptera frugiperda (Sf9) insect cells (Sigma-Aldrich, cell line IPLB Sf21-AE, female) were infected with P2 viral stocks. Cells were cultured in suspension in Sf-900™ II SFM medium (ThermoFisher) supplemented with 10% fetal bovine serum (Sigma-Aldrich) and 1X antibiotic-antimyocotic (ThermoFisher). All cultures were grown at 27°C with 120 rpm of shaking.
METHOD DETAILS
S. cerevisiae strains
Mutants of GFP-Sc-Dyn (VY137) were generated as previously described (Rao et al., 2018). Briefly, a DNA fragment encoding the dynein motor domain was integrated into the yeast genome DNA by homologous recombination. The genotypes of the S. cerevisiae strains used are:
GFP-Sc-Dyn (VY137) and its mutants: PDyn:pGal:ZZ:Tev:GFP:HA:D6 MATa; his3–11,15; ura3–1; leu2–3,112; ade2–1; trp1–1; pep4Δ:HIS5; prb1Δ
Sc-Dynlyso (VY1027): PDyn:PGal:ZZ:Tev:D4.6_CC10 MATa; his3–11,5; PEP4::HIS5 PRB1D; trp1–1; leu2–3,112; ade2–1; ura3–1
Sc-DynlysoMut (VY972): PDyn:PGal:ZZ:Tev:D4.6_AAA1E/Q_CC10 MATa; his3–11,5; PEP4::HIS5 PRB1D; trp1–1; leu2–3,112; Ade; ura3–1
Sc-DynGST (VY208): DpDyn-pGAL-ZZ-TEV-GFP-3XHA-GST-D6-DYN1-gsDHA:Kan MATa; PEP4::HIS5; PRB1; his3–11,15; ura3–1; leu2–3,112; ade2–1; trp1–1
Plasmids
Hs-dynein 1:
The human cytoplasmic dynein 1 vector (uniprot: Q14204, amino acids 1320–4646) was a gift from A.P. Carter (MRC) and was described in earlier work (Steinman et al., 2017). The construct contains an N-terminal hexahistidine (6x-His) followed by the tobacco etch virus (TEV) protease-cleavable linker.
Dm-spastin:
The vector used for Dm-spastin expression (pDEST15-Dm-spastin) was a gift from A. Roll-Mecak (NIH) and was described in earlier work (Cupido et al., 2019). This construct consists of residues 209–310 and 373–758 (Uniprot: Q8I0P1).
Xl-katanin:
MAL-c5x-X.laevis p60 (full length, NCBI RefSeq: NP_001084226.1) was a gift from R. Heald (UC Berkeley).
Mm-VCP:
pQE9-His-p97 (identical to full length Homo sapiens VCP protein, NP_009057.1, Ile206Val variant) was obtained from Addgene (G. Warren, Addgene #14666).
Hs-FIGL1:
Residues 288–674 of Hs-FIGL1 (NCBI RefSeq: NP_001036227.1) were cloned into the pDEST15 vector (Cupido et al., 2019).
Protein expression and purification
Hs-dynein 1 was expressed using the baculovirus/insect cell expression system. Recombinant baculovirus was generated using the Bac-to-Bac system (ThermoFisher). Sf9 cells (Sigma-Aldrich) were grown to ~2.0 million cells per mL in Sf-900™ II SFM medium (ThermoFisher) supplemented with 10% fetal bovine serum and 1X antibiotic-antimyocotic (ThermoFisher) prior to infection with P2 viral stocks at a 1:100 virus:media ratio. Sf9 cells were incubated for 72 hours at 27°C with 120 rpm shaking and then harvested by centrifugation. The cell pellet was flash frozen in liquid nitrogen and stored at −80°C.
The Sf9 cell pellet was resuspended in a buffer containing 30 mM HEPES pH 7.6, 200 mM NaCl, 10 mM imidazole, 1 mM TCEP, 2 mM PMSF, and the Roche cOmplete EDTA-free protease inhibitor cocktail. Cells were lysed by the addition of Triton X-100 to a final concentration of 0.2%. After a 15 min incubation period on ice, the lysate was clarified by ultracentrifugation at 120,000 g for 40 minutes at 4°C and then incubated with Ni-NTA resin (Qiagen) for 2 hours at 4°C while rotating. The resin was washed with lysis buffer and bound proteins were eluted with buffer containing 30 mM HEPES pH 7.5, 100 mM NaCl, 500 mM imidazole, and 1 mM TCEP. The eluate was diluted into buffer B (50 mM Tris HCl pH7.8, 150 mM KOAc, 2 mM Mg(OAc)2,1 mM EGTA, 1 mM EDTA, 0.1 mM ATP, 1 mM DTT, 10% glycerol) and loaded onto a Mono Q 5/50 GL column (GE Healthcare). The column was eluted using a salt gradient from 150 to 750 mM KOAc over 20 column volumes. Peak fractions were concentrated using an Amicon Ultra 100K MWCO centrifugal filter and subjected to size exclusion chromatography oon a Superose 6 10/300 GL column using buffer B. Gel filtration revealed a monodisperse peak at an elution volume of 12.2 mL, consistent with the expected molecular weight.
All S. cerevisiae dynein constructs were purified as previously described with some modifications (Reck-Peterson et al., 2006). Eight liters of S. cerevisiae cells were grown until stationary phase and harvested by centrifugation. Cells were washed with water, and resuspended in 5X lysis buffer (150 mM HEPES, pH 7.4, 250 mM K-Ac, 10 mM Mg(Ac)2, 2 mM EGTA). Cells were slowly pipetted into liquid nitrogen and then lysed using a coffee grinder. The resulting powder was resuspended in 2.5X lysis buffer (75 mM HEPES, pH 7.4, 125 mM K-Ac, 5 mM Mg(Ac)2, 0.5 mM EGTA, 3 mM DTT, 0.2 mM ATP, 1 mM PMSF) and clarified by ultracentrifugation (100,000 g for 2 hours). The supernatant was poured into a column containing IgG beads (Sepharose 6 Fast Flow, GE Healthcare) and allowed to bind to the beads by gravity-flow. The beads were washed with wash buffer (30 mM HEPES, pH 7.4, 50 mM K-Ac, 2 mM Mg-Ac, 1 mM EGTA, 10% glycerol, 200 mM KCl, 2 mM DTT, 100 μM ATP, 0.4 mM PMSF, 0.25% Triton-X). Beads were subsequently washed with TEV buffer (50 mM Tris-HCl, pH 7.4, 150 mM K-Ac, 2 mM Mg(Ac)2, 1 mM EGTA, 10% glycerol, 0.5 M TCEP, 0.1 M PMSF) and resuspended in TEV buffer (3 mL) containing TEV protease (25 μg) for overnight on-column TEV cleavage at 4°C. Protein was eluted and concentrated using an Amicon Ultra 100K MWCO centrifugal filter. The protein was subjected to size-exclusion chromatography (Superdex 200I 10/300 GL, GE Healthcare) and eluted in size-exclusion buffer (20 mM Tris, pH 8.0, 50 mM K-Ac, 2 mM Mg(Ac)2, 1 mM EGTA, 10% glycerol, 1 mM TCEP).
Dm-spastin, Hs-FIGL1, Xl-katanin and Mm-VCP were expressed in Escherichia coli Rosetta (DE3) pLysS cells (Merck, catalog no. 70954) grown in LMM (Formedium) at 37°C (Cupido et al., 2019). Cells were induced at OD600 0.6–0.8 with 0.5 mM IPTG and grown overnight at 18 °C. The cultures were pelleted and resuspended in lysis buffer (Buffer A, see below). All subsequent purification steps were performed at 4 °C. Cells were lysed using the Emulsiflex-C5 homogenizer (Avestin, 5–6 cycles at 10,000–15,000 psi) and the homogenized lysate was centrifuged at 120,000 g for 45–60 min. The purification conditions for each recombinant protein are described below.
Dm-spastin:
Buffer A: PBS, 10 mM MgCl2, 1 mM PMSF, 20 U ml−1 benzonase, and cOmplete EDTA-Free Protease Inhibitor Cocktail. Buffer B1: 50 mM Tris–HCl pH 7.5, 500 mM KCl, 10 mM MgCl2, 5 mM DTT. Buffer B2: 50 mM Tris–HCl pH 8.0, 300 mM NaCl, 10 mM MgCl2, 5 mM DTT, 20 mM reduced glutathione. Buffer C: 50 mM Na-MES pH 6.5, 10% (w/v) glycerol, 10 mM MgCl2, 5 mM DTT. Buffer D: 50 mM Na-MES pH 6.5, 2 M NaCl, 10% (w/v) glycerol, 10 mM MgCl2, 5 mM DTT. Buffer E: 20 mM K-HEPES pH 7.5, 300 mM NaCl, 10 mM MgCl2, 5 mM DTT, 15% (w/v) glycerol.
The clarified lysate was applied onto a GSTrap 4B column (GE Healthcare). The column was washed with Buffer B1 and the bound proteins were eluted with Buffer B2. The fractions containing Dm-spastin were pooled and the GST tag was cleaved by incubating the protein solution with PreScission protease (0.1 mg ml−1) for 8–12 hours. The solution was diluted 1:2.5 with Buffer C and loaded into the CaptoS cation exchange column (GE Healthcare) equilibrated in 95% Buffer C and 5% Buffer D. The eluted fractions containing Dm-spastin were pooled, concentrated with an Amicon Ultra 30K MWCO centrifugal filter and subjected to size-exclusion chromatography using a HiLoad 16/60 Superdex 200 column (GE Healthcare) in Buffer E. The fractions containing purified Dm-spastin were pooled, concentrated to at least 1 mg/mL using an Amicon Ultra 30K MWCO centrifugal filter, flash frozen in liquid nitrogen and stored at −80 °C. PreScission cleavage left six nonnative residues (GPQGSK) at the N terminus.
Hs-FIGL1:
Buffer A: 25 mM Tris–HCl pH 8.0, 300 mM NaCl, 5 mM MgCl2, 5 mM DTT, 1 mM PMSF, 0.01% (v/v) Triton X-100, and cOmplete EDTA-Free Protease Inhibitor Cocktail. Buffer B1: 25 mM Tris–HCl pH 8.0, 300 mM NaCl, 5 mM MgCl2, 5 mM DTT, 0.4 mM PMSF, 0.01% (v/v) Triton X-100. Buffer B2: 25 mM Tris–HCl pH 8.0, 150 mM NaCl, 5 mM MgCl2, 5 mM DTT, 10 mM reduced glutathione. Buffer C: 25 mM Tris–HCl pH 8.0, 75 mM NaCl, 5 mM MgCl2, 5 mM DTT. Buffer D: 25 mM Tris–HCl pH 8.5, 500 mM NaCl, 5 mM MgCl2, 5 mM DTT. Buffer E: 25 mM Tris–HCl pH 7.5, 150 mM NaCl, 5 mM MgCl2, 5 mM DTT, 5% (w/v) glycerol.
The clarified lysate was loaded onto a GSTrap 4B column (GE Healthcare). The column was washed with Buffer B1 and then Buffer D, and eluted with Buffer B2. Fractions containing Hs-FIGL1 were pooled, diluted with 1 volume of Buffer C, and loaded on a MonoQ 5/50 GL column (GE Healthcare) that was equilibrated in 95% Buffer C and 5% Buffer D. The protein fractions were pooled, concentrated using an Amicon Ultra 50K MWCO centrifugal filter, and subjected to size-exclusion chromatography using a Superdex 200 10/300 GL column (GE Healthcare) in Buffer E. Fractions containing purified Hs-FIGL1 were pooled, concentrated to at least 1 mg/mL using an Amicon Ultra 30K MWCO centrifugal filter, flash frozen in liquid nitrogen and stored at −80 °C.
Xl-katanin:
Buffer A: 20 mM Tris–HCl pH 7.5, 250 mM NaCl, 5 mM MgCl2, 100 μM ATP, 5 mM DTT, 10% (w/v) glycerol, 1 mM PMSF, and cOmplete EDTA-Free Protease Inhibitor Cocktail. Buffer B: 20 mM Tris–HCl pH 7.5, 250 mM NaCl, 5 mM MgCl2, 100 μM ATP, 5 mM DTT, 10% (w/v) glycerol. Buffer C: 20 mM Tris–HCl pH 7.5, 50 mM NaCl, 1 mM MgCl2, 5 mM DTT, 100 μM ATP, 10% (w/v) glycerol. Buffer D: 20 mM Tris–HCl pH 7.5, 500 mM NaCl, 5 mM MgCl2, 5 mM DTT, 100 μM ATP, 10% (w/v) glycerol. Buffer E: 20 mM Na-HEPES pH 7.5, 250 mM NaCl, 5 mM MgCl2, 5 mM DTT, 10% (w/v) glycerol.
The clarified lysate was loaded onto an MBP trap column (GE Healthcare). The column was washed with 30 column volumes of Buffer B and eluted with Buffer B supplemented with 10 mM maltose. The eluate was diluted 1:2 with Buffer C and loaded onto a MonoQ 16/60 GL ion exchange column. Xl-katanin was eluted with a gradient of Buffer D. MonoQ fractions contained Xl-katanin were combined, concentrated using an Amicon Ultra 30K MWCO centrifugal filter, and subjected to size-exclusion chromatography using a Superdex 200 10/300 GL column (GE Healthcare) in Buffer E. The fractions containing purified Xl-katanin protein were pooled, concentrated to at least 1 mg/mL using an Amicon Ultra 30K MWCO centrifugal filter, flash frozen in liquid nitrogen and stored at −80 °C.
Mm-VCP:
Buffer A: 25 mM K-HEPES pH 8.0, 500 mM KCl, 20 mM imidazole, 2 mM DTT, 5 U ml−1 benzonase, and cOmplete EDTA-Free Protease Inhibitor Cocktail. Buffer B: 25 mM K-HEPES pH 8.0, 500 mM KCl, 20 mM imidazole, 2 mM DTT. Buffer C: 25 mM K-HEPES pH 7.5, 500 KCl, 1 mM MgCl2, 2 mM DTT, 500 mM imidazole. Buffer D: 25 mM K-HEPES pH 7.5, 250 mM KCl, 1 mM MgCl2, 2 mM DTT.
The clarified lysate was incubated with Ni-NTA resin (Qiagen) for 40 min. The resin was washed with Buffer B and the protein was eluted with Buffer C. Fractions containing the protein were concentrated using an Amicon Ultra 50K MWCO centrifugal filter and loaded onto a Superose 6 column (10/300 GL, GE Healthcare) in Buffer D. Fractions from the size-exclusion column were concentrated using an Amicon Ultra 50K MWCO centrifugal filter, mixed with 15% (w/v) glycerol, flash frozen in liquid nitrogen and stored at −80 °C.
Co-crystallization of Sc-Dyn-lysoMut with compound 20
Sc-Dyn-lysoMut was concentrated to ~8 mg/mL and compound 20 was added (final compound concentration 100 μM, 2% DMSO) in size-exclusion buffer. A seed stock was prepared by using Seed Bead (Hampton Research, HR2–320) to crush crystals of Sc-Dyn-lysoMut that were generated using a previous condition (Bhabha et al., 2014). Seeds were added to the protein-compound complex (1:4 dilution) and mixed with an equal amount of reservoir solution (100 mM Bis-Tris pH 6.8–7.2, 200 mM sodium acetate, 8–13.5% PEG 3350, and 10 mM TCEP) using the sitting drop method. Crystals were allowed to form at 18°C. The crystal that diffracted to 4.5 Å was from a well containing the following buffer: 100 mM Bis-Tris pH 6.9, 200 mM sodium acetate, 12% PEG 3350 and 10 mM TCEP. Prior to cooling in liquid nitrogen, the crystals were supplemented with ethylene glycol to give a final precipitant (PEG 3350, ethylene glycol) concentration of 35%.
Data Collection and Refinement
Diffraction data were collected at the NSLS-II 17-ID-2 (FMX) beamline (wavelength: 0.920094 Å) at Brookhaven National Laboratory and indexed to P21212 and reduced using XDS (Table S1) (Kabsch, 2010). The X-ray data was phased by molecular replacement using Phaser (McCoy et al., 2007). A nucleotide-free model of the S. cerevisiae dynein motor domain (PDB: 4AI6) was used as the search model to yield a solution. The model was adjusted in Coot (Emsley et al., 2010) and refined using Phenix (McCoy et al., 2007). The lysozyme, which is not present in the search model, was built by rigid body docking of the lysozyme coordinates from PDB: 4W8F into the defined electron density. Ramachandran statistics are 94% favored and 0.5% outliers.
Cryo-EM sample preparation and data collection
For cryo-EM of S. cerevisiae (Sc-Dyn-lysoMut) in the presence of compound 20, freshly purified protein was diluted to either 0.15 or 0.5 mg/mL and mixed with 2X compound 20 stock solution (final concentration: 80 μM compound 20, 0.2% DMSO). Samples were applied to glow discharged Quantifoil 1.2/1.3 copper grids and plunge frozen in liquid ethane using Vitrobot IV (Thermo Fisher Scientific). Dose-fractionated (50 frames, 10s exposure, 44 e− per Å2) super-resolution image stacks were collected on a 300-kV Titan Krios electron microscope (Thermo Fisher Scientific) equipped with a K2-summit detector (Gatan) using automated data collection (SerialEM). Datasets were collected over three separate sessions, where the first two were collected at 1.3 Å per pixel and the last collected at 1.0 Å per pixel.
Data processing and analysis
Two datasets were originally acquired on two different grids that only differed by their protein concentration (0.15 vs 0.5 mg/ml). For these first two datasets, per pixel drift correction and dose-weighting was performed using MotionCor2. The motion-corrected, dose-weighted images were imported into CryoSPARC and contrast transfer function (CTF) parameters were estimated using CTFFind4. For dataset 1, approximately 1,000 particles were manually picked and subjected to 2D classification. Classes that represented different orientations of the protein were used as templates for automatic particle picking. Multiple rounds of 2D classification were performed to discard classes that displayed ice or carbon contamination, or poorly resolved averages. Particles from the classes with the best alignment parameters were selected and used to build an ab initio model as a reference for 3D refinement. A similar process was followed for dataset 2, but for the final refinement, the 124,891 particles selected were combined with the 25,016 particles from the dataset 1, reaching a resolution of ~4.4 Å. The results obtained from those datasets were subsequently used at three stages for the processing of dataset 3. The 2D classes were used to auto-pick, the best particles were then used as seeds to drive 2D classification, and the 3D map was used as a reference for 3D refinement.
Dataset 3 was collected in super-resolution at a higher pixel size (0.518 Å/pixel) and processed using RELION 3.0. First, correction of inter-frame movement for each pixel and dose-weighting was performed using RELION 3.0’s implementation of MotionCor2. Motion-corrected images were first binned to 1.3 Å per pixel and the CTF parameters were estimated as previously described (Rohou and Grigorieff, 2015). 2D class averages from the first two datasets were used as templates for automatic particle picking in RELION 3.0. To expedite 2D classification, the 4,723,853 particles picked were split into 24 sub-sets. Addition of the best 149,907 particles from datasets 1 and 2 to each subset facilitated the separation of good particles from junk during the 2D classification of dataset 3. Each subset was then subjected to seven rounds of 2D classification. Particles selected from dataset 3 were re-extracted at a pixel size of 0.518 A/pixel. While the 3D model obtained from dataset 2 was used as a reference, only particles from dataset 3 were used for refinement. After a round of 3D classification with eight classes, the two best classes were merged and refined to 3.9 Å.
Local resolution estimation revealed that the AAA3 and AAA4 domains contained the highest resolution information, while the map showed lack of density for the AAA1 domain. To increase local resolution, we performed a wide range of signal subtractions to refine individual or adjacent AAA domains. Among those, three locally refined maps of 2 or 3 adjacent AAA domains lead to improved resolution: AAA6-AAA1 (Map 2), AAA2-AAA4 (Map 4), and AAA5-AAA6 (Map 5).
Model Building and Refinement
The initial model used to build models 4 and 5 from Maps 4 and 5 came from the X-ray coordinates in this paper (PDB: 7MI1). A rigid body fit of each individual AAA small and large domain was performed using PHENIX, as part of the real-space refinement procedure (global minimization, ADP refinement, local grid search, secondary structure restraints, Ramachandran restraints, rotamer restraints). Iterative manual model building in Coot (ref) and refinement in PHENIX were carried out. The validation tools in PHENIX derived from Molprobity were used to assess the final model quality. To place the ligands into the model for Map 4 (EMD-23838), computational docking was performed using the GlideEM script as described below, followed by refinement using the PHENIX/OPLS3e algorithm (Robertson et al., 2019).
Model 1 is a composite model, based on individual components built into higher resolution maps from focused refinements of the EM data and our X-ray map. To build Model 1, the coordinates from Models 4 and 5 were rigid body docked into Map 1 (Figure S4F). The coordinates for the linker (residues 1365–1523) and the stalk/buttress (residues 3012–3022, 3306–3314, 3424–3568, 3586–3615) were taken from the X-ray structure and individually docked into their respective densities in Map 1. The AAA1-S domain, which is not clearly observed in Map 1, was first rigid-body docked from the X-ray structure into Map 2. These coordinates were then integrated into Model 1. After rigid body docking of these domains, some residues at the interfaces between individual components of the composite map resulted in clashes. Hence the coordinates were refined against Map 1 with tight restraints (global minimization, ADP refinement, secondary structure restraints, Ramachandran restraints, rotamer restraints). Coot was used for manual model building, and Chimera and Pymol were used to visualize and analyze the maps and models.
Computational docking and refinement
Ligand docking was performed using the GlideEM script in the Schrödinger software (Robertson et al., 2019). The individual AAA2, AAA3, and AAA4 domains were extracted from the model and subjected to computational docking separately. The major tautomer at pH 7.0 of compound 20 was assigned performed using the LigPrep panel in Maestro. Default parameters were used for GlideEM docking, except for the following modifications: RECEP_CCUT=0.24, RECEP_VSCALE=0.9, EPIK_PENALTIES=False, HBOND_DONOR_AROMH=True, HBOND_ACCEP_HALO=True. Real space refinement was performed in PHENIX using default settings except that the OPLS3e/VSGB2.1 force field was used with a weight factor of 1.
Structure figure preparation
The following figures were prepared using Chimera. Figure 4C shows PDB: 7MI6 (Model 1) in Map 2 with a map threshold of 0.0035. EM density was carved by using the zone function in Chimera and a radius of 4 Å was applied. Figures 4E–F show PDB-7MI3 (Model 4) in Map 4 with a map threshold of 0.004. EM density of the protein chain and ligands were carved by using the zone function in Chimera with a radius of 2.8 Å. For Figure 4E, the AAA4L domain was hidden, except for residues 2904–2912, to allow for visualization of the ligand density. Figures 4G, 4I, and S5A–B show poses from GlideEM computational docking (Map 4, EMD-23838) that were prepared using a map threshold of 0.004. EM density was carved by using the zone function and a radius of 2 Å was applied. Figure S4E shows PDB: 7MI3 in Map 4 with a threshold of 0.004. EM density was carved by using the zone function in Chimera with a radius of 2.8 Å.
Radioactive ATPase assay
ATPase assays using Hs-dynein 1 were performed as previously described, except that the protein concentration was reduced to 30 nM and the reaction time was extended to 45 min (Steinman et al., 2017). If microtubules were present, the buffer (25 mM PIPES pH7.0, 30 mM KCl, 1 mM EGTA, 5 mM MgCl2, 0.01% Triton™ X-100, 1 mM DTT) contained 20 μM taxol. For structure-activity relationship studies with the dynapyrazole derivatives, percent inhibition of the ATPase activity was calculated by normalizing the ATPase rate in the presence of compounds to DMSO control. To determine the IC50 of compound 20, the measured activity was plotted against concentration of compound 20 and the data were fit using the sigmoidal dose response curve (Equation (1)) in Prism v. 8.0 (GraphPad Software Inc).
| (1) |
NADH-coupled steady state ATPase assay for kcat analyses
To determine the kcat and k1/2 of GFP-Sc-Dyn and its mutants, an enzymatic ATP regeneration system was used. For GFP-Sc-Dyn and its mutants, the assay buffer contains 30 mM HEPES pH 7.4, 50 mM K-Acetate, 2 mM magnesium acetate, 1 mM EGTA, 0.01% Triton X-100, and 1 mM DTT. A 20 μL reaction was prepared in a flat bottom 384 well black polystyrene plate (Greiner Bio One, Wemmel, Belgium, catalog # 781090) and contained protein (Sc-Dyn-lyso: 5 nM, GFP-Sc-Dyn: 50 nM) and 1X NADH mix. 1X NADH mix contains 200 μM NADH (Sigma, N7410), 1 mM phosphoenol pyruvic acid monopotassium salt (Sigma, P7127), 33.3 U/mL D-lactic dehydrogenase (Sigma, L3888), and 55 U/mL pyruvate kinase (lyophilized powder, Sigma, P9136). The reaction was initiated with the addition of 10X MgATP (2 μL), and the fluorescence signal was monitored using a Synergy NEO Microplate Reader (λex = 340 nm, 440 nm emission filter). The slope of the fluorescence values versus time was calculated to give the rate of fluorescence decrease. The ATPase rate was calculated from the rate of fluorescence decrease from a standard curve measuring the contribution of ADP to the NADH fluorescence signal. Enzyme parameters k1/2, kcat, and Hill coefficients (h) for the recombinant enzymes were determined by fitting the rates to the Hill equation using Prism v. 6.0 (GraphPad Software Inc) at different ATP concentrations (x):
| (2) |
NADH-coupled steady state ATPase assay for analysis of compound 19 and 20
A 20 μL reaction was prepared in a flat bottom 384 well black polystyrene plate (Greiner Bio One, Wemmel, Belgium, catalog # 781090) and contained Sc-Dyn-lyso, 1X NADH mix, and compound. 1X NADH mix contains 200 μM NADH (Sigma, N7410), 1 mM phosphoenol pyruvic acid monopotassium salt (Sigma, P7127), 33.3 U/mL D-lactic dehydrogenase (Sigma, L3888), and 55 U/mL pyruvate kinase (lyophilized powder, Sigma, P9136). For Sc-Dyn-lyso, a ten dose serial dilution was performed in DMSO starting at 4 mM compound 19 or 20. For Hs-FIGL, Dm-spastin, Mm-VCP/p97, Xl-katanin, and Hs-PCH2, compound 19 (1 mM in DMSO) was diluted 1:25 in buffer to achieve 2X compound. For typical conditions, 2X compound (10 μL) was added to protein/NADH mix (8 μL) and incubated for 10 min at RT. The reaction was initiated with the addition of 10 mM MgATP (2 μL), and the fluorescence signal was monitored using a Synergy NEO Microplate Reader (λex = 340 nm, 440 nm emission filter). The slope of the fluorescence values versus time was calculated to give the rate of fluorescence decrease. The ATPase rate was calculated from the rate of fluorescence decrease from a standard curve measuring the contribution of ADP to the NADH fluorescence signal.
Assay buffers:
GFP-Sc-Dyn and its mutants (10–45 nM): 30 mM HEPES pH 7.4, 50 mM KOAc, 1 mM EGTA, 2 mM MgOAc, 1 mM DTT, 0.01% Triton™ X-100
Sc-Dyn-lyso (5 nM): 30 mM HEPES pH 7.4, 50 mM KOAc, 1 mM EGTA, 2 mM MgOAc, 1 mM DTT, 10% glycerol, 0.01% Triton™ X-100
Xl-katanin (50 nM): 25 mM K-HEPES pH 7.5, 70 mM KCl, 20 mM (NH4)2SO4, 5 mM MgCl2, 2.5 mM DTT, 0.01% w/v Triton™ X-100
Mm-p97 (400 nM): 30 mM HEPES pH 7.4, 50 mM KOAc, 1 mM EGTA, 2 mM MgOAc, 1 mM DTT, 0.01% w/v Triton™ X-100
Hs-FIGL1 (50 nM): 25 mM Na-MES pH 6.5, 70 mM KOAc, 20 mM (NH4)2SO4, 5 mM Mg(OAc)2, 1 mM TCEP, 0.01% w/v Triton™ X-100
Dm-spastin (75 nM): 25 mM K-HEPES pH 7.5, 225 mM KCl, 2.5 mM (NH4)2SO4, 5 mM MgCl2, 2.5 mM DTT, 1 mg/mL BSA, 0.005% w/v Triton™ X-100
Microscale thermophoresis assay (MST)
The binding affinities of compound 20 to Sc-Dyn-lysoMut was measured using Monolith NT.115 (NanoTemper Technologies, Munich, Germany). Sc-Dyn-lysoMut was labeled with the Monolith NT Protein Labeling Kit RED-NHS. To obtain a fluorescence intensity between 200 and 1100 counts at 20% LED power, a final concentration of 30–50 nM protein was used. The MST assays were performed in the following MST buffer: 20 mM Tris-HCl pH 8.0, 50 mM K-Ac, 2 mM Mg(Ac)2, 1 mM EGTA, 10% glycerol, 0.005% Triton-X100. Protein samples were prepared in Corning 384 Well Black NBS Flat Bottom Assay plates (Corning #3654). A 50X compound stock was prepared by a 1:2 serial dilution of the compound in DMSO starting from 20 mM. The 50X compound stock was diluted in buffer to obtain a 2X compound stock. The 2X protein stock was mixed well with 2X compound and incubated for 10 min at RT in the dark. Each sample was transferred to a Monolith premium capillary tube, and measurements were performed at at 20% and 40% MST power for Sc-Dyn-lyso and GFP-Sc-Dyn constructs, respectively, at 25°C. A binding curve was observed at 1.5s after the start of thermophoresis. The Fnorm values were fitted to Equation (3) using MATLAB (Natick, Ma) at different concentrations of compound 20.
| (3) |
| (4) |
In Equation (3), Emax is the maximum response, EC50 is the compound concentration that produces the half-maximum response, and h corresponds to the hill slope. In Equation (4) Fhot denotes the fluorescence value at the hot state and Fhot represents the fluorescence value at the cold state. Funbound indicates the mean fluorescence at the unbound state.
For the AMPPMP competition assays, the assay was repeated as above, except either 200 μM or 2 mM AMPPNP (Sigma-Aldrich Cat# 10102547001) was added to the 2X protein stock before diluting it with 2X compound.
The binding affinities of MgAMPPNP to GFP-Sc-Dyn and its mutant (V2391S/M2732S) were also measured using Monolith NT.115 (NanoTemper Technologies, Munich, Germany). A 50X AMPPNP stock was prepared by a 1:2 serial dilution of AMPPNP in 50 mM Tris-HCl pH 8. The 50X AMPPMP stock was diluted in MST buffer to obtain a 2X AMPPMP stock. The 2X protein stock was mixed well with 2X AMPPNP and incubated for 15 min at RT in the dark. Each sample was transferred to a Monolith premium capillary tube, and measurements were performed at 60% MST power at 25°C. A binding curve was observed at 20s after the start of thermophoresis. The Fnorm values were fitted to Equation (3) using MATLAB (Natick, Ma) at different concentrations of AMPPNP.
Single-molecule motility assays
Single-molecule TIRF assays were carried out using a Nikon Eclipse Ti inverted microscopy with a N1–1.49 100x Plan Apo objective (Nikon). The microscope was outfitted with 488 nm (Spectra-physics Cyan Scientific 40 mW) and 561 nm (Cobalt Jive 50 mW) lasers, dichroic mirrors (Semrock Di01-R488 and Di01-R488/561), excitation filters (Semrock FF01–488/6 and FF01–482/563), and emission filters (FF01–525/45 and FF01–609/54). Images were captured using a Photometric Prime 95B sCMOS camera. Flow cells were constructed using glass slides (Ted Pella 260600), glass coverslips (Fisher 12–541A), and double-sided tape. Cover slips were thoroughly washed with 70% ethanol and water prior to use. All single-molecule experiments were carried out at 23°C.
Rhodamine-labeled microtubules were polymerized from bovine tubulin (~10% final rhodamine-labeled tubulin, prepared as previously and stabilized with 10 μM taxol (Sigma T7191) before being pelleted in a TLA120.1 rotor at 90,000 rpm for 10 min at 25°C (Beckman Coulter) (Subramanian et al., 2013; Ti et al., 2016). The pellet was washed and resuspended with BRB80 buffer plus 10 μM taxol. Microtubules were attached to the κ-casein-blocked coverslip surface using rigor-kinesin as previously described (Mickolajczyk et al., 2016).
GFP-labeled dynein GST dimers, prepared as previously, were first incubated in dynein motility buffer (30 mM HEPES pH=7.2, 50 mM K-Acetate, 2 mM Mg-Acetate, 1 mM EGTA, 10% v/v glycerol) containing 50 μM compound 20 in 1% DMSO and incubated on ice for 30 minutes (Niekamp et al., 2019). Motors were drawn from this stock and diluted 10,000-fold (final concentration 100 pM total dynein) into motility buffer containing 0–50 μM compound 20 in 1% DMSO as well as 100 μM MgATP. In the final serial dilution, the motility buffer was supplemented with 1 mM DTT, 1 mM Mg-ATP, 0.05 mg/mL κ-casein, 10 μM taxol, 20 mM glucose, 20 μM/mL glucose oxidase, and 8 μg/mL catalase. The final mixture was added to flow cells containing immobilized microtubules. A single image of rhodamine microtubules was taken first, then a movie of GFP-dynein was taken in the same field of view at 5 frames per second. Landing rates were determined by manual kymograph analysis in ImageJ (NIH). Landing rate data were fitted with a sigmoidal dose response equation:
| (5) |
Where A gives a Y-intercept corresponding to the landing rate in the absence of drug, and IC50 gives the drug concentration yielding A/2. The run lengths and velocities of individual dyneins were determined by linear fitting to particle trajectories obtained using FIESTA software (Ruhnow et al., 2011). Population velocities were obtained by taking the sample mean, and population run lengths were obtained by fitting the cumulative density function to an offset exponential (Thompson et al., 2013; Thorn et al., 2000). All data analysis was performed in MATLAB (Mathworks).
Microtubule gliding assays
The microscope setup, flow cell preparation, and rhodamine microtubule preparation for gliding assays were identical to that of the single-molecule gliding assays. Flow cells were first coated with anti-GFP antibody (Sigma G6539) flowed in at 0.5 mg/mL in BRB80. After five minutes, blocking buffer (BRB80 with 1 mg/mL α-Casein) was added. After five more minutes, the blocking buffer was flushed out with gliding motility buffer (30 mM HEPES pH 7.2, 50 mM K-Acetate, 2 mM Mg-Acetate, 1 mM EGTA, 10% v/v glycerol, 1 mM DTT, 1 mM Mg-ATP, 0.05 mg/mL α-casein, 10 μM taxol, 20 mM glucose, 20 μM/mL glucose oxidase, and 8 μg/mL catalase). GFP-Sc-Dyn was then added to the flow cell at 200 nM (in gliding motility buffer). After five minutes, the microtubules were added at a suitable dilution in gliding motility buffer supplemented with 1% DMSO, 25 μM compound 10, or 25 μM compound 6 (all with final 1% DMSO). The flow cells were loaded onto the microscope and movies (4 frames per second, 250 frames total) were taken both immediately and after waiting 30 minutes. Movies were analyzed using FIESTA software (Ruhnow et al., 2011) and fitted positional data were exported to MATLAB for analysis. Velocity for each microtubule track was calculated by fitting a line to the time versus distance data.
Chemical Synthesis
General. Solvents and reagents were purchased from VWR or Sigma Aldrich. All reactions involving air- or moisture-sensitive compounds were performed under nitrogen atmosphere using dried glassware. For compounds 3-19, 1H and 13C (for 6 and 19) NMR spectra were recorded at 500MHz and 125MHz respectively, on a Bruker Advance III HD 500 MHz NMR spectrometer equipped with at TCI cryogenic probe with enhanced 1H and 13C detection. For compound 20, 1H and 13C NMR spectra were recorded at 600MHz and 151M Hz respectively, on a Bruker Advance II 600 MHz NMR spectrometer equipped with a 5 mm TXI cryogenic probe. All data was collected at 298K, signals were reported in ppm, internally referenced for 1H and 13C to chloroform signal at 7.26 ppm or 77.0 ppm; to DMSO signal at 2.50 ppm or 39.5 ppm, or TMS at 0 ppm. Chemical shifts are reported in parts per million (ppm) and the coupling constants (J) are expressed in hertz (Hz). Splitting patterns are designated as follows: s, singlet; d, doublet; t, triplet; m, multiplet; dd, doublet of doublets; ddd, double of doublets of doublets; dt, doublet of triplets. Flash chromatography purifications were performed on CombiFlash Rf (Teledyne ISCO) as the stationary phase. Purity for all tested compounds was determined through high-performance liquid chromatography and all compounds were found to be >95% pure. Liquid chromatography mass spectral analyses were obtained using a Waters Acquity H-Class UPLC/MS with a QDa mass spectrometer. The system used a eλ Photodiode Array Detector detector, and a Symmetry C18 (3.5 micron) 2.1 × 50 mm column for separation (mobile phase for positive mode: solvent A: water with 0.1% formic acid, solvent B: acetonitrile with 0.1% formic acid). Values are reported in units of mass to charge (m/z).
General method A (used to prepare compounds 6, 9, 10, 13, 17, 18, 19, 20)

A mixture of the appropriate ethyl or methyl (Z)-2-(alkyloxy)-3-(dimethylamino)prop-2-enoate (1.1 equivalents), 5-amino-3- [1-(4-chlorophenyl)cyclopropyl]-1H-pyrazole-4-carbonitrile (1 equivalent), and p-toluenesulfonic acid hydrate (1.4 equivalents) in butanol was stirred at 120 °C for 16 h. The reaction mixture was concentrated in vacuo. The residue was purified column chromatography (silica gel, hexane/ethyl acetate) and washed with ethyl acetate to give the desired product.
General method B (used to prepare compound 16)

To a solution of ethyl (E)-3-(dimethylamino)-2-(aryloxy)prop-2-enoate (1.4 equivalents) in butanol were added 5-amino-3- [1-(4-chlorophenyl) cyclopropyl]-1H-pyrazole- 4-carbonitrile (1 equivalent), p-toluenesulfonic acid hydrate (1 equivalent). The mixture was stirred at 120 °C for 3 days. The mixture was cooled to room temperature and concentrated in vacuo. The residue was purified by column chromatography (0% - 60% hexane in ethyl acetate) to give the corresponding ethyl (E)-3-[[3-[1-(4-chlorophenyl)cyclopropyl]-4-cyano-1H-pyrazol-5-yl]amino]-2-(aryloxy)prop-2-enoate, which was subsequently dissolved in ethanol and treated with aqueous sodium hydroxide (1.8 equivalents NaOH) at room temperature. The mixture was concentrated after being stirred at room temperature for 6 h. The mixture was neutralized with 1N HCl and extracted with ethyl acetate. The combined organic layer was washed with water and brine, dried over MgSO4, filtered and concentrated in vacuo. The residue was purified by column chromatography (silica-gel, 50% - 100% hexane in ethyl acetate) to give the desired product.
General method C (used to prepare compound 4)

A mixture of the appropriate ethyl 2-oxocycloalkane carboxylate (1 equivalent), 5-amino-3-[1-(4-chlorophenyl)cyclopropyl]-1H-pyrazole-4-carbonitrile (1 equivalent) and p-toluenesulfonic acid hydrate (1 equivalent) in butanol was stirred at 120 °C for 1.5 h. The reaction was concentrated in vacuo. The residue was purified by column chromatography (silica-gel, 50–100% ethyl acetate in hexane) to give the desired product.
General method D (used to prepare 7)

A mixture of 5-amino-3-[1-(4-chlorophenyl)cyclopropyl]-1H-pyrazole-4-carbonitrile (1 equivalent), the appropriate 3-substituted ethyl-3-oxopropanoate (1 equivalent) and p-toluenesulfonic acid hydrate (1 equivalent) in butanol was stirred at 120°C for 2 h. The reaction was cooled to room temperature. Resulting precipitates were collected and washed with methanol to give the desired product.
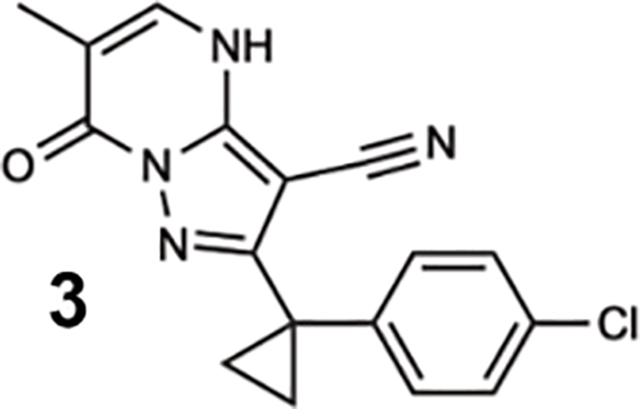
To a solution of methyl (E)-3-(dimethylamino)-2-methyl-prop-2-enoate (180 mg, 1.26 mmol) in butanol were added p-toluenesulfonic acid hydrate (359 mg, 1.89 mmol) and 3-amino-5-[1-(4-chlorophenyl)cyclopropyl]-1H-pyrazole-4-carbonitrile (326 mg, 1.26 mmol). The mixture was stirred at 120 °C for 16 h. The mixture was poured into water and extracted with EtOAc. The organic layer was washed with water, then washed with brine, dried over magnesium sulfate, and concentrated in vacuo. The residue was purified by column chromatography (silica-gel, 10%−60% ethyl acetate in hexane) to give a crude product (140 mg). 29 mg of the crude material was purified with preparative HPLC (water/CH3CN, 0.1% formic acid) to give 2-[1-(4-chlorophenyl) cyclopropyl]-6-methyl-7-oxo-4H-pyrazolo[1,5-a]pyrimidine-3-carbonitrile (3, 16 mg, 49 μmol, 3.91% yield) as a colorless solid. 1H NMR (500 MHz, DMSO-d6) δ 13.22 (s, 0H), 7.71 (s, 1H), 7.47 – 7.14 (m, 4H), 1.94 (s, 3H), 1.46 (s, 2H), 1.30 (s, 2H). MS m/z 325.0 [M+1]+.
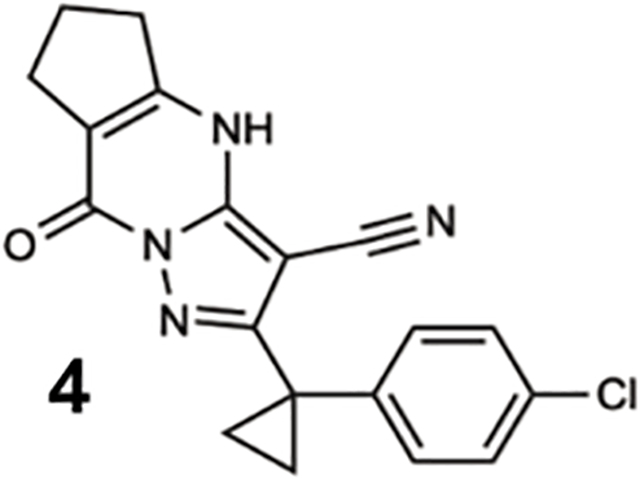
A mixture of ethyl 2-oxocyclopentanecarboxylate (30.2 mg, 193 μmol, 27.9 uL), 3-amino-5-[1-(4-chlorophenyl)cyclopropyl]-1H-pyrazole-4-carbonitrile (50.0 mg, 193 μmol) and p-toluenesulfonic acid hydrate (36.8 mg, 193 μmol) in butanol (1.50 mL) was stirred at 120 °C for 1.5 h. The reaction was concentrated in vacuo. The residue was purified by column chromatgraphy (silica-gel, 50–100% EtOAc in hexane) to give 2-(1-(4-chlorophenyl)cyclopropyl)-8-oxo-5,6,7,8-tetrahydro-4H-cyclopenta[d]pyrazolo[1,5-a]pyrimidine-3-carbonitrile (4, 44.7 mg, 127 μmol, 66% yield) as an off white solid. 1H NMR (500 MHz, DMSO-d6) δ 13.50 (s, 1H), 7.36 (d, J = 7.9 Hz, 2H), 7.28 (d, J = 7.8 Hz, 2H), 2.91 (t, J = 7.6 Hz, 2H), 2.69 (t, J = 7.2 Hz, 2H), 2.13 – 2.03 (m, 2H), 1.50 (s, 2H), 1.37 (s, 2H). MS m/z: 351.2 [M+1]+.
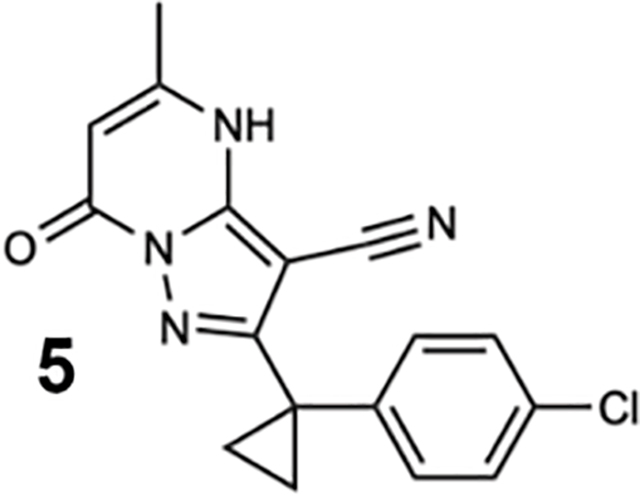
The mixture of ethyl 3-oxobutanoate (50.0 mg, 384 μmol), 3-amino-5-[1-(4-chlorophenyl)cyclopropyl]-1H-pyrazole-4-carbonitrile (99.4 mg, 384 μmol) and p-toluenesulfonic acid hydrate (73.1 mg, 384 μmol) in BuOH (3.0 mL) was stirred at 120 °C for 2 h. The reaction mixture was cooled to room temperature. The precipitate was collected and washed with MeOH to give 2-[1-(4-chlorophenyl) cyclopropyl]-5-methyl-7-oxo-4H-pyrazolo[1,5-a]pyrimidine-3-carbonitrile (5, 62.4 mg, 192 μmol, 50% yield) as an off-white solid. 1H NMR (500 MHz, DMSO-d6) δ 13.17 (s, 1H), 7.38 – 7.34 (m, 2H), 7.31 – 7.26 (m, 2H), 5.83 (s, 1H), 2.29 (s, 3H), 1.50 (s, 2H), 1.37 (s, 2H). MS m/z: 325.1 [M+1]+.
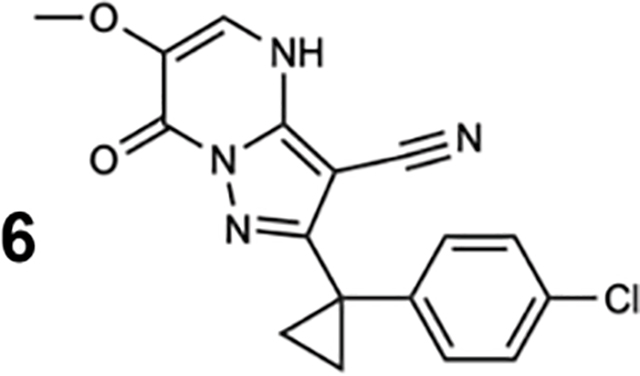
General method A was used to obtain 2-[1-(4-chlorophenyl)cyclopropyl]-6-methoxy- 7-oxo-4H-pyrazolo[1,5-a]pyrimidine-3-carbonitrile (6, 66% yield). 1H NMR (500 MHz, DMSO-d6) δ 13.18 (s, 1H), 7.77 (s, 1H), 7.38 (d, J= 8.5 Hz, 2H), 7.31 (d, J= 8.3 Hz, 2H), 3.77 (s, 3H), 1.53 (q, J= 4.5 Hz, 2H), 1.39 (q, J= 4.5 Hz, 2H). 13C NMR (151 MHz, DMSO-d6) δ 160.50, 152.85, 145.34, 141.15, 135.74, 131.76, 131.76, 130.24, 130.24, 128.79, 123.74, 112.92, 73.87, 58.79, 23.95, 15.90, 15.90 MS m/z: 341.1 [M+1]+.
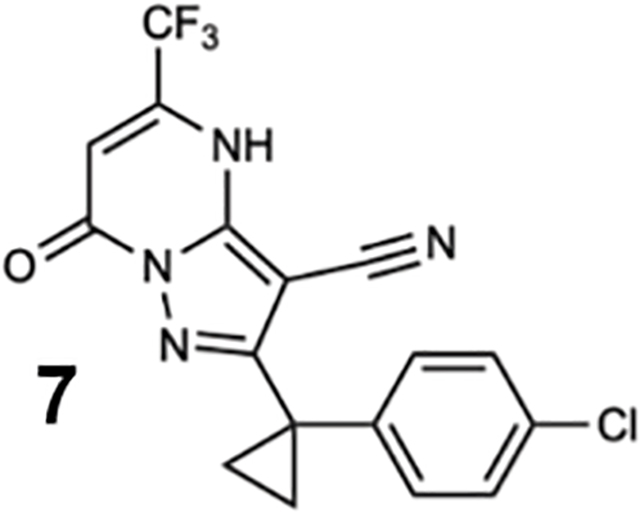
General method D was used to obtain 2-(1-(4-chlorophenyl)cyclopropyl)-7-oxo- 5-(trifluoromethyl)-4,7-dihydropyrazolo[1,5-a]pyrimidine-3-carbonitrile (7, 7.7% yield)1H NMR (500 MHz, DMSO-d6) δ 7.34 (d, J = 7.9 Hz, 2H), 7.26 (d, J = 7.6 Hz, 2H), 5.92 (s, 1H), 1.49 (s, 2H), 1.32 (s, 2H). 1H was hidden. MS; m/z 379.1 (M+1).
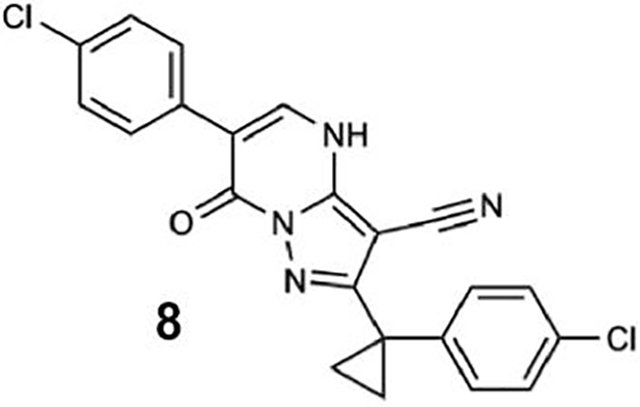
To a solution of methyl (Z)-2-(4-chlorophenyl)-3-(dimethylamino)prop-2-enoate (111 mg, 464 μmol) in butanol (5.00 mL) were added 1 (100 mg, 387 μmol), p-toluenesulfonic acid hydrate (74 mg, 387 μmol). The mixture was stirred at 120 °C for 3 hours. The mixture was cooled to room temperature. The resulting solid was collected by filtration using methanol to give 6-(4-chlorophenyl)-2-[1-(4-chlorophenyl)cyclopropyl]- 7-oxo- 4H-pyrazolo[1,5-a]pyrimidine-3-carbonitrile (8, 74 mg, 176 μmol, 45% yield) as a white solid. 1H NMR (500 MHz, DMSO-d6) δ 13.88 (s, 1H), 8.19 (s, 1H), 7.76 – 7.68 (m, 2H), 7.56 – 7.48 (m, 2H), 7.44 – 7.37 (m, 2H), 7.36 – 7.30 (m, 2H), 1.60 – 1.52 (m, 2H), 1.46 – 1.39 (m, 2H). MS m/z: 419 [M-H]−.
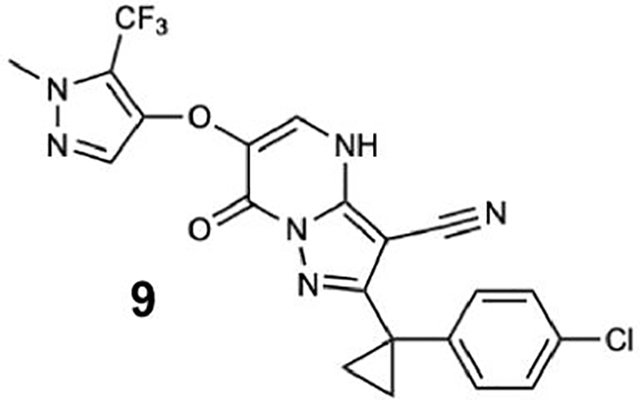
General method A was used to obtain 2-[1-(4-chlorophenyl)cyclopropyl]-6-[1-methyl- 5-(trifluoromethyl)pyrazol-3-yl]oxy-7-oxo-4H-pyrazolo[1,5-a]pyrimidine-3-carbonitrile (9, 43% yield). 1H NMR (500 MHz, DMSO-d6) δ 8.00 (s, 1H), 7.44 – 7.36 (m, 2H), 7.35 – 7.27 (m, 2H), 6.34 (s, 1H), 3.80 (s, 3H), 1.55 – 1.47 (m, 2H), 1.38 – 1.30 (m, 2H). MS m/z: 475.2 [M+1]+.
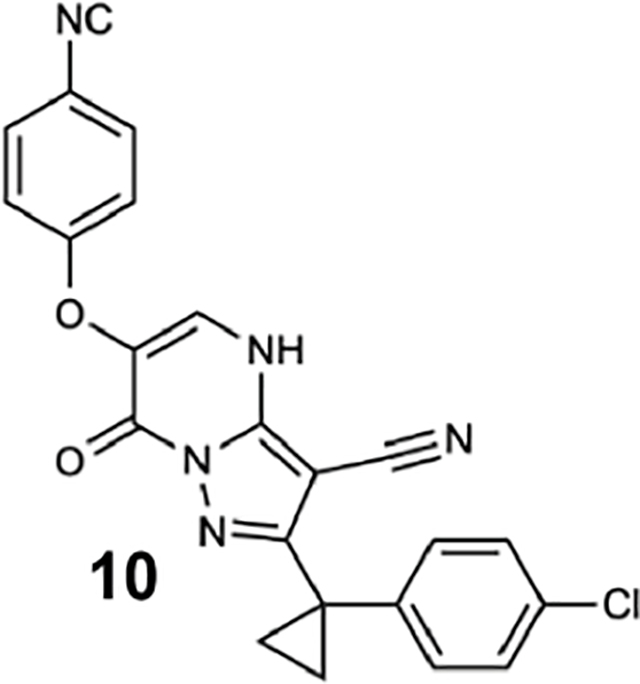
General method A was used to obtain 2-[1-(4-chlorophenyl)cyclopropyl]- 6-(4-cyanophenoxy)- 7-oxo-4H-pyrazolo[1,5-a]pyrimidine-3-carbonitrile (10, 9.9% yield). 1H NMR (500 MHz, DMSO-d6) δ 7.95 (s, 1H), 7.76 (d, J = 8.9 Hz, 2H), 7.41 – 7.35 (m, 2H), 7.34 – 7.27 (m, 2H), 7.06 (d, J = 8.9 Hz, 2H), 1.54 – 1.48 (m, 2H), 1.35 – 1.30 (m, 2H). MS m/z: 428.2 [M+1]+.
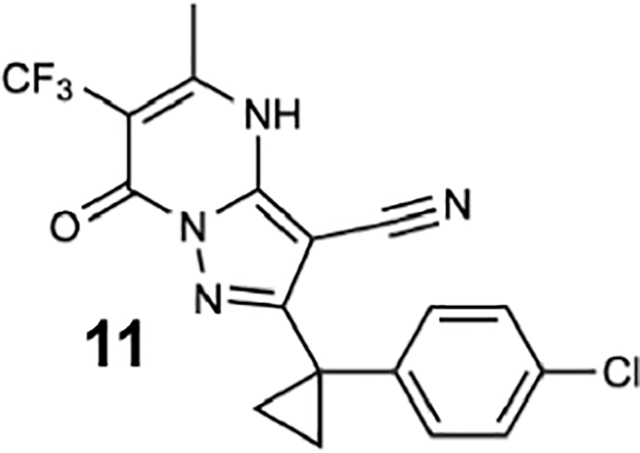
A mixture of 5-amino-3-[1-(4-chlorophenyl)cyclopropyl]-1H-pyrazole-4-carbonitrile (100 mg, 387 μmol), ethyl 3-oxo-2-(trifluoromethyl)butanoate (77 mg, 387 μmol), and p-toluenesulfonic acid hydrate (74 mg, 387 μmol) in butanol (5.00 mL) was stirred at 100 °C for 8 h. The reaction was concentrated in vacuo. The residue was purified by column chromatography (silica-gel, 20–80% ethyl acetate in hexane) and washed with diisopropyl ether to give 2-[1-(4-chlorophenyl)cyclopropyl]- 5-methyl-7-oxo- 6-(trifluoromethyl)-4H-pyrazolo[1,5-a]pyrimidine-3-carbonitrile (11, 56.0 mg, 143 μmol, 37% yield) as a pale yellow solid. 1H NMR (500 MHz, Chloroform-d) δ 10.99 (s, 1H), 7.32 (d, J = 8.4 Hz, 2H), 7.28 – 7.23 (m, 2H), 2.53 – 2.48 (m, 3H), 1.71 – 1.66 (m, 2H), 1.36 (q, J = 4.5 Hz, 2H). MS m/z 393.318 [M+1]+.
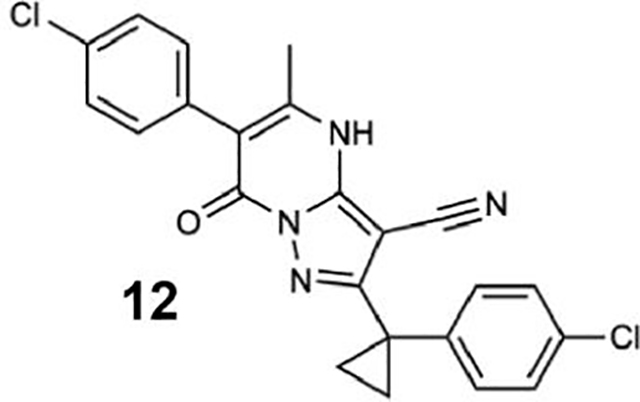
A mixture of 2-[1-(4-chlorophenyl)cyclopropyl]-6-iodo-5-methyl-7-oxo-4H,7H-pyrazolo [1,5-a]pyrimidine-3-carbonitrile (14, 10 mg, 22 μmol), cyclopentyl(diphenyl)phosphane; dichloromethane; dichloropalladium;iron (1.83 mg, 2.22 μmol), potassium carbonate (6.1 mg, 44.4 μmol), and (4-chlorophenyl)boronic acid (4.2 mg, 26.7 μmol) in EtOH (0.5 mL) and toluene (0.5 mL) was stirred at 80 °C for 5.5 h. The reaction was concentrated in vacuo. The residue was purified by column chromatography (silica-gel, 0–100% ethyl acetate in hexane) to give 6-(4-chlorophenyl)-2-[1-(4-chlorophenyl)cyclopropyl]-5-methyl-7-oxo-4H-pyrazolo[1,5-a]pyrimidine-3-carbonitrile (12, 3.6 mg, 8.3 μmol, 37% yield) as a yellow solid. 1H NMR (500 MHz, DMSO-d6) δ 13.30 (s, 1H), 7.50 (d, J = 8.0 Hz, 2H), 7.37 (d, J = 8.5 Hz, 2H), 7.34 – 7.26 (m, 4H), 2.16 (s, 3H), 1.39 (s, 2H), 1.23 (s, 2H). MS m/z 435.3 [M+1]+.
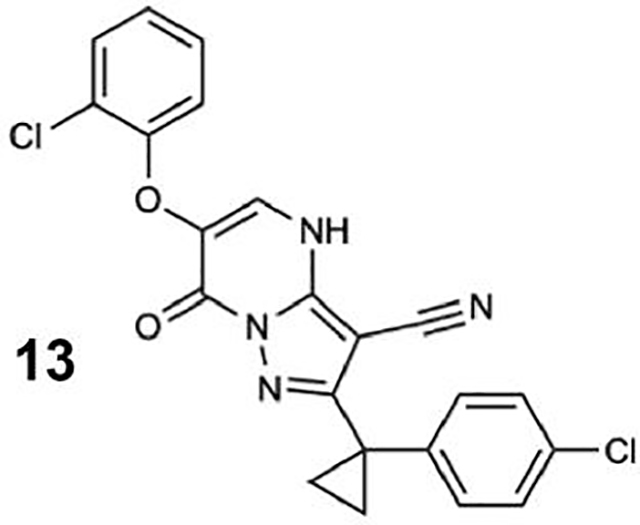
General method A was used to obtain 6-(2-chlorophenoxy)-2-[1-(4-chlorophenyl) cyclopropyl]-7-oxo-4H-pyrazolo[1,5-a]pyrimidine-3-carbonitrile (13, 20% yield). 1H NMR (500 MHz, Chloroform-d) δ 8.09 (s, 1H), 7.48 (d, J = 7.9 Hz, 1H), 7.36 (d, J = 8.6 Hz, 2H), 7.30 (d, J = 8.6 Hz, 2H), 7.22 – 7.15 (m, 1H), 7.01 (t, J = 8.3 Hz, 1H), 6.94 – 6.86 (m, 1H), 1.53 – 1.47 (m, 2H), 1.35 (t, J = 5.6 Hz, 2H). MS m/z: 437.2 [M+1]+.
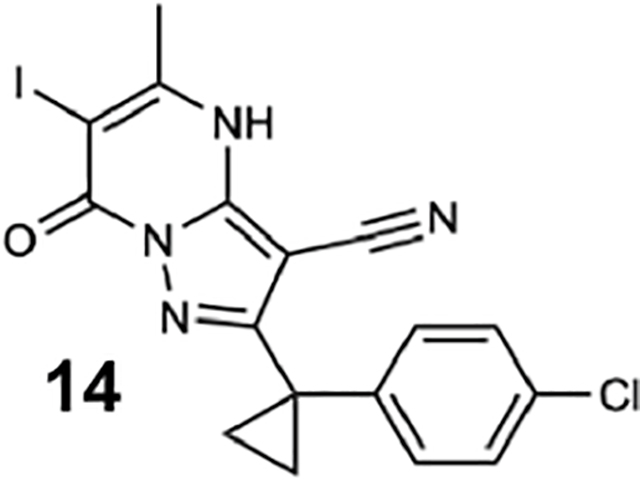
A mixture of ethyl 3-oxobutanoate (50.0 mg, 384 μmol, 48.6 uL), 3-amino-5- [1-(4-chlorophenyl)cyclopropyl]-1H-pyrazole-4-carbonitrile (99.4 mg, 384 μmol) and p-toluenesulfonic acid hydrate (73.1 mg, 384 μmol) in butanol (3.0 mL) was stirred at 120 °C for 2 h. The reaction was cooled to room temperature. The precipitate was collected and washed with MeOH to give 2-[1-(4-chlorophenyl)cyclopropyl]-6-iodo- 5-methyl-7-oxo-4H,7H-pyrazolo [1,5-a]pyrimidine-3-carbonitrile (14, 62.4 mg, 192 μmol, 50% yield) as an off white solid. 1H NMR (500 MHz, DMSO-d6) δ 13.17 (s, 1H), 7.38 – 7.34 (m, 2H), 7.31 – 7.26 (m, 2H), 5.83 (s, 1H), 2.29 (s, 3H), 1.50 (s, 2H), 1.37 (s, 2H). MS m/z 325.1 [M+1]+.
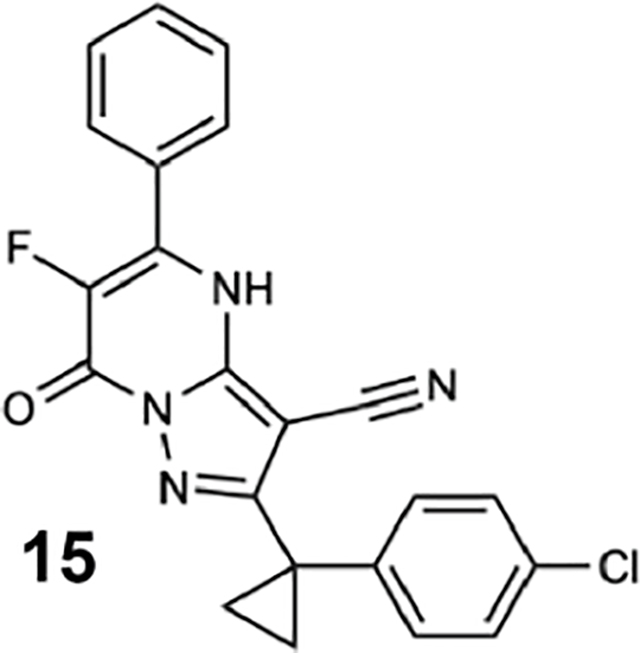
A mixture of 1 (54.5 mg, 211 μmol), ethyl (E)-3-(dimethylamino)-2-fluoro-3- phenyl-prop-2-enoate (50.0 mg, 211 μmol) and p-toluenesulfonic acid hydrate (43.9 mg, 255 mol) in butanol (2.0 mL) was stirred at 130 °C for 2 h. The reaction mixture was concentrated in vacuo. The residue was purified by column chromatography (silica-gel, 50–80%, ethyl acetate in hexane). The resulting solid was triturated with ethyl acetate to give 2-[1-(4-chlorophenyl)cyclopropyl]-6-fluoro-7-oxo-5-phenyl-4H-pyrazolo[1,5-a] pyrimidine-3-carbonitrile (15, 29 mg, 72.1 μmol, 34% yield) as a colorless solid. 1H NMR (500 MHz, DMSO-d6) δ 7.82 – 7.65 (m, 2H), 7.66 – 7.46 (m, 3H), 7.37 (d, J= 8.1 Hz, 2H), 7.30 (d, J= 8.2 Hz, 2H), 1.62 – 1.46 (m, 2H), 1.45 – 1.28 (m, 2H). MS m/z 405.1 [M+1]+.
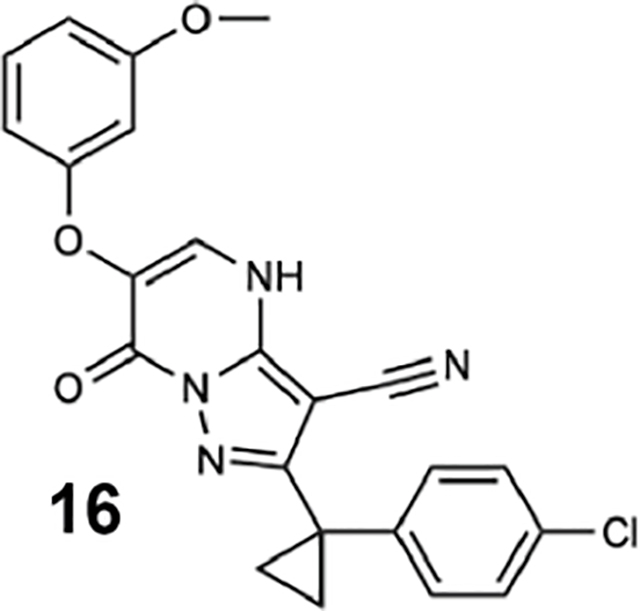
General method B was used to obtain 2-[1-(4-chlorophenyl)cyclopropyl]-6- (3-methoxyphenoxy)-7-oxo-4H-pyrazolo[1,5-a]pyrimidine-3-carbonitrile (16, 80% yield). 1H NMR (500 MHz, DMSO-d6) δ 13.68 (s, 1H), 8.21 (s, 1H), 7.38 (d, J = 8.5 Hz, 2H), 7.32 (d, J = 8.5 Hz, 2H), 7.21 – 7.16 (m, 1H), 6.65 – 6.57 (m, 3H), 3.73 (s, 3H), 1.56 – 1.49 (m, 2H), 1.43 – 1.33 (m, 2H). MS m/z: 433.1 [M+1]+.
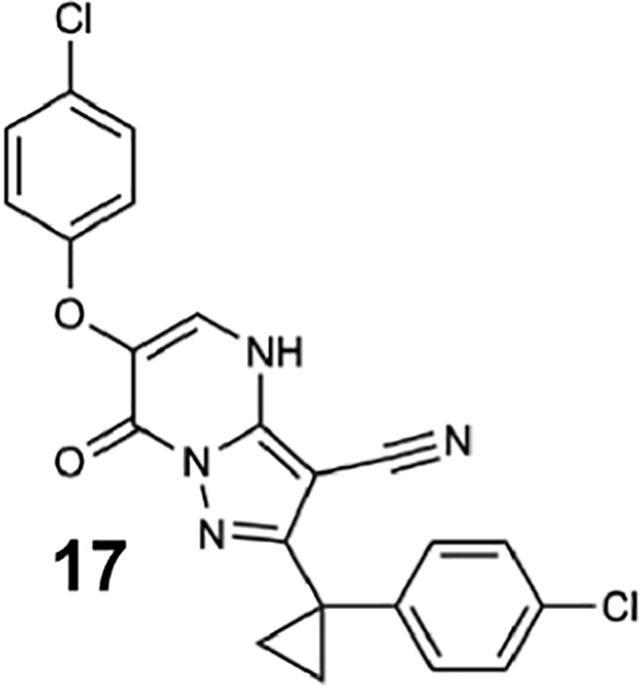
General method A was used to obtain 6-(4-chlorophenoxy)-2-(1-(4-chlorophenyl) cyclopropyl)-7-oxo-4,7-dihydropyrazolo[1,5-a]pyrimidine-3-carbonitrile (17, 14.08% yield). 1H NMR (500 MHz, DMSO-d6) δ 13.69 (s, 1H), 8.09 (s, 1H), 7.48 – 7.24 (m, 6H), 7.00 (d, J = 6.9 Hz, 2H), 1.50 (s, 2H), 1.35 (s, 2H). MS m/z: 437.1 [M+1]+.
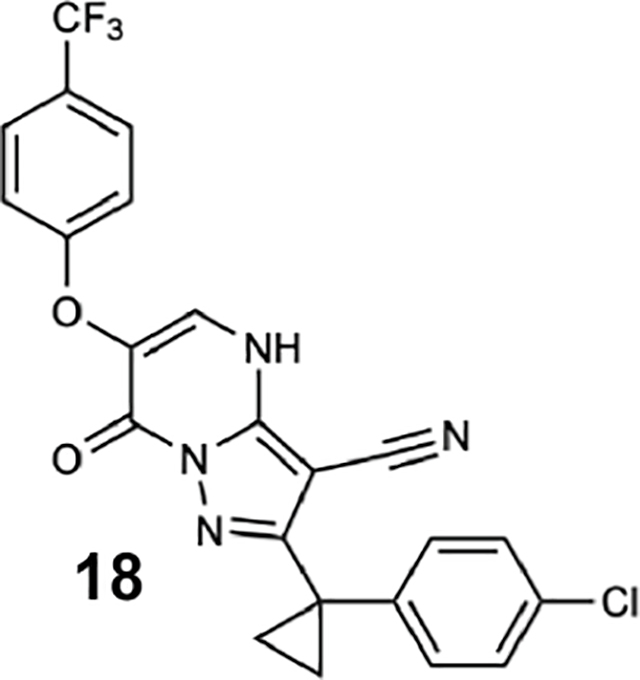
General method A was used to obtain 2-[1-(4-chlorophenyl)cyclopropyl]-7-oxo- 6-[4-(trifluoromethyl)phenoxy]-4H-pyrazolo[1,5-a]pyrimidine-3-carbonitrile (18, 17% yield) as a pale yellow solid. 1H NMR (500 MHz, DMSO-d6) δ 8.15 (s, 1H), 7.66 (d, J = 8.4 Hz, 2H), 7.49 – 7.04 (m, 6H), 1.64 – 1.28 (m, 4H). MS m/z: 469 [M-H]−.
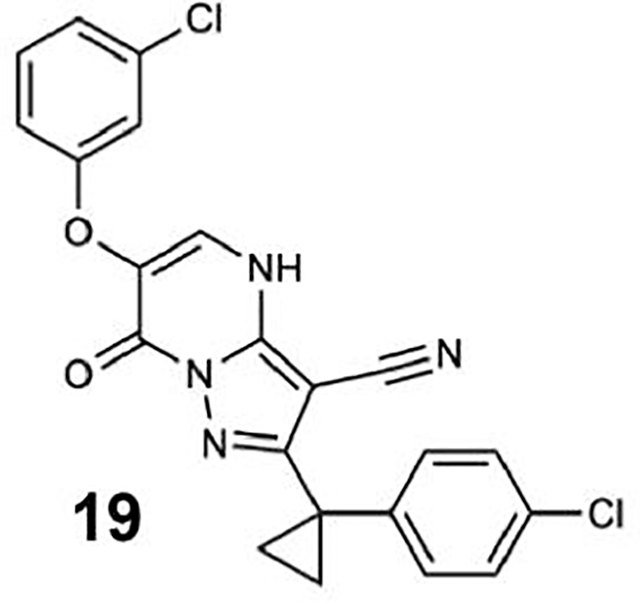
General method A was used to obtain 6-(3-chlorophenoxy)-2-[1-(4-chlorophenyl) cyclopropyl]-7-oxo-4H-pyrazolo[1,5-a]pyrimidine-3-carbonitrile (19, 10% yield) as a beige solid. 1H NMR (500 MHz, DMSO-d6) δ 8.26 (s, 1H), 7.38 (d, J= 8.6 Hz, 2H), 7.36 – 7.29 (m, 3H), 7.18 (d, J= 2.3 Hz, 1H), 7.10 (dd, J= 8.0, 1.9 Hz, 1H), 7.06 (dd, J= 8.4, 2.5 Hz, 1H), 1.57 – 1.46 (m, 2H), 1.45 – 1.34 (m, 2H). 13C NMR (151 MHz, DMSO-d6) δ 163.49, 160.09, 159.87, 153.04, 141.95, 134.10, 131.48, 131.31, 130.13, 130.13, 128.69, 128.69, 128.24, 122.09, 115.46, 115.46, 114.68, 114.68, 75.88, 24.15, 15.73, 15.73. MS m/z: 439 [M+H]+.
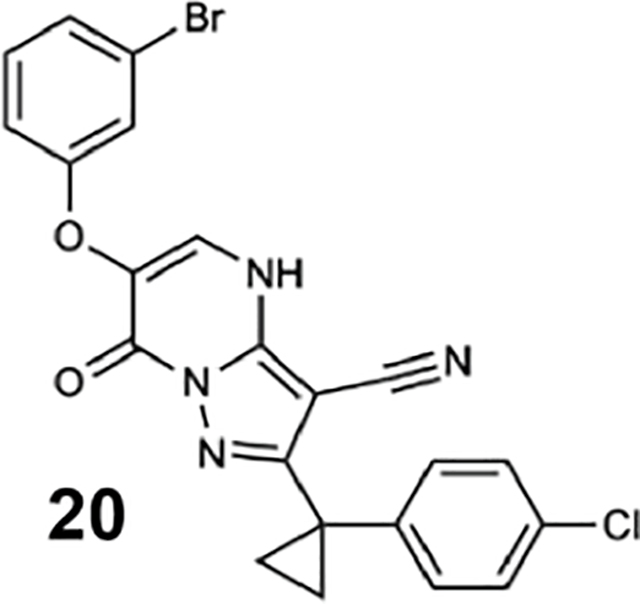
General method A was used to obtain 6-(3-bromophenoxy)-2- [1-(4-chlorophenyl) cyclopropyl]-7-oxo-4H-pyrazolo[1,5-a]pyrimidine-3-carbonitrile (20, 67% yield) as a beige solid. 1H NMR (600 MHz, DMSO-d6) δ 8.26 (s, 1H), 7.38 (d, J = 8.4 Hz, 2H), 7.35 – 7.29 (m, 3H), 7.29 – 7.21 (m, 2H), 7.10 (d, J = 7.9 Hz, 1H), 1.52 (d, J = 5.8 Hz, 2H), 1.40 (d, J = 4.7 Hz, 2H). 13C NMR (151 MHz, DMSO-d6) δ 159.84, 159.01, 152.47, 146.43, 140.70, 134.24, 131.34, 131.23, 129.83, 128.33, 128.21, 125.19, 122.09, 117.84, 114.87, 112.37, 74.96, 23.53, 15.37. MS m/z: 479.2 [M-H]−.
QUANTIFICATION AND STATISTICAL ANALYSIS
Statistical parameters including the number of independent experiments (n), mean ± standard deviation (SD), mean ± confidence interval (CI) or mean ± range are reported in the Results or respective figure legends. For the microtubule gliding assay, N refers to the number of microtubules analyzed over two independent experiments. No methods were required to determine whether the data met assumptions of a particular statistical method.
Supplementary Material
Movie S1. Dynein-driven microtubule gliding in the presence of compound 20, Related to Figure 6. Example movies of GFP-Sc-Dyn driving the gliding of taxol-stabilized microtubules in the presence of 1% DMSO (left), 25 μM compound 20 (middle), or 25 μM compound 6 (right). Movies were taken in the same flow cells both immediately after treatment (top) and after 30 minutes of treatment (bottom).
KEY RESOURCES TABLE.
| REAGENT or RESOURCE | SOURCE | IDENTIFIER |
|---|---|---|
| Antibodies | ||
| Monoclonal Anti-Green Fluorescent Protein (GFP) antibody, clone GFP-20 | Sigma | Cat#6539 |
| Bacterial and virus strains | ||
| Sf9 Insect Cells | Sigma-Aldrich | Cat#71104–3 |
| Bac-to-Bac™ Baculovirus Expression System | ThermoFisher | Cat#10359016 |
| Escherichia coli BL21 Rosetta™ (DE3) | Merck | Cat#70954 |
| Chemicals, peptides, and recombinant proteins | ||
| β-Nicotinamide adenine dinucleotide, reduced disodium salt (NADH) |
Sigma-Aldrich | Cat#N7410 |
| Adenosine 5’-triphosphate disodium salt hydrate | Sigma-Aldrich | Cat#A6419 |
| Adenylyl-imidodiphosphate (AMPPNP) | Roche | Cat#10102547001 |
| Antibiotic-antimyocotic | ThermoFisher | Cat#5240062 |
| Dimethylsulfoxide (DMSO) | Sigma-Aldrich | Cat#276855 |
| D-Lactic Dehydrogenase (LDH) | Sigma-Aldrich | Cat#L3888 |
| Phospho(enol)pyruvic acid monopotassium salt (PEP) | Sigma-Aldrich | Cat#P7127 |
| Phenylmethylsulfonyl fluoride (PMSF) | Sigma-Aldrich | Cat#P7626 |
| Pyruvate Kinase from rabbit muscle (PK) | Sigma-Aldrich | Cat#P9136 |
| Roche cOmplete, EDTA-free Protease Inhibitor | Sigma-Aldrich | Cat#11873580001 |
| Tris(2-carboxyethyl)phosphine HCl (TCEP) | Sigma-Aldrich | Cat# C4706 |
| Triton™ X-100 | Sigma-Aldrich | Cat#X100 |
| IgG Sepharose® 6 Fast Flow | Cytiva | Cat#GE17–0969-01 |
| Sodium acetate trihydrate | Sigma-Aldrich | Cat#71188 |
| Sf-900™ II SFM | ThermoFisher | Cat#10902096 |
| Fetal Bovine Serum | Sigma-Aldrich | Cat# F4135 |
| Taxol | Sigma-Aldrich | Cat#T7191 |
| Glucose Oxidase from Aspergillus niger | Sigma-Aldrich | Cat#G2133 |
| Catalase from bovine liver | Sigma-Aldrich | Cat#C40 |
| Polyethylene glycol 3350 (PEG-3350) | Sigma-Aldrich | Cat#202444 |
| Dithiothreitol (DTT) | Gold Biotechnology | Cat#DTT25 |
| ATP, [γ-32P] | PerkinElmer | BLU002Z250UC |
| TLC PEI Cellulose F | Millipore Sigma | Cat#1055790001 |
| Hepes, ≥99.5% (titration) | Sigma-Aldrich | Cat#H3375 |
| Magnesium acetate tetrahydrate | Sigma-Aldrich | Cat#M5661 |
| Critical commercial assays | ||
| Monolith NT Protein Labeling Kit RED-NHS | Nanotemper | SKU:MO-L001 |
| Deposited data | ||
| Dynein motor domain – ADP complex (template for molecular replacement) | (Schmidt et al., 2012) | PDB: 4AI6 |
| Dynein motor domain – ATP complex | (Schmidt et al., 2012) | PDB: 4AKG |
| Motor domain from human cytoplasmic dynein-1 | (Zhang et al., 2017) | PDB: 5NUG |
| Crystal structure of the dynein motor domain in the AMPPNP-bound state | (Bhabha et al., 2014) | PDB: 4W8F |
| Yeast dynein motor domain in the presence of a pyrazolo-pyrimidinone-based compound, Model 1 | This paper | PDB: 7MI6 |
| Yeast dynein motor domain in the presence of a pyrazolo-pyrimidinone-based compound, Map 1 | This paper | EMD-23841 |
| Signal subtracted reconstruction of the AAA1 domain of dynein in the presence of a pyrazolo-pyrimidinone-based compound, Map 2 | This paper | EMD-23844 |
| Signal subtracted reconstruction of the AAA1 domain of dynein in the presence of a pyrazolo-pyrimidinone-based compound, Map 3 | This paper | EMD-23846 |
| Signal subtracted reconstruction of AAA2, AAA3, and AAA4 domains of dynein in the presence of a pyrazolo-pyrimidinone-based compound, Model 4 | This paper | PDB: 7MI3 |
| Signal subtracted reconstruction of AAA2, AAA3, and AAA4 domains of dynein in the presence of a pyrazolo-pyrimidinone-based compound, Map 4 | This paper | EMD-23838 |
| Signal subtracted reconstruction of AAA5 and AAA5 domains of dynein in the presence of a pyrazolo-pyrimidinone-based compound, Model 5 | This paper | PDB: 7MI8 |
| Signal subtracted reconstruction of AAA5 and AAA5 domains of dynein in the presence of a pyrazolo-pyrimidinone-based compound, Map 5 | This paper | EMD-23842 |
| X-ray structure of yeast dynein motor domain in the presence of a pyrazolo-pyrimidinone-based compound | This paper | PDB: 7MI1 |
| Experimental models: organisms/strains | ||
| GFP-Sc-Dyn (VY137): PDyn:pGal:ZZ:Tev:GFP:HA:D6 MATa; his3–11,15; ura3–1; leu2–3,112; ade2–1; trp1–1; pep4Δ:HIS5; prb1Δ | (Reck-Peterson et al., 2006) | N/A |
| Sc-Dynlyso (VY1027): PDyn:PGal:ZZ:Tev:D4.6_CC10 MATa; his3–11,5; PEP4::HIS5 PRB1D; trp1–1; leu2–3,112; ade2–1; ura3–1 | (Bhabha et al., 2014) | N/A |
| Sc-DynlysoMut (VY972): PDyn:PGal:ZZ:Tev:D4.6_AAA1E/Q_CC10 MATa; his3–11,5; PEP4::HIS5 PRB1D; trp1–1; leu2–3,112; Ade; ura3–1 | (Bhabha et al., 2014) | N/A |
| Sc-DynGST (VY208): DpDyn-pGAL-ZZ-TEV-GFP-3XHA-GST-D6-DYN1-gsDHA:Kan | (Reck-Peterson et al., 2006) | N/A |
| Recombinant DNA | ||
| Plasmid: Hs-Dynein 1 | (Steinman et al., 2017) | N/A |
| pQE9-His-p97 (M. musculus VCP/p97) | (Meyer et al., 2000) | Addgene #14666 |
| pDEST15-FIGL1 (H. sapiens FIGL1) | (Cupido et al., 2019) | N/A |
| pMAL-c5x-p60 (X. laevis katanin p60) | (Loughlin et al., 2011) | N/A |
| pDEST15-Dm-spastin (D. melanogaster spastin) | (Roll-Mecak and Vale, 2008) | N/A |
| Software and algorithms | ||
| MATLAB R018b | MathWorks | https://www.mathworks.com/ |
| FIESTA | (Ruhnow et al., 2011) | https://fusionforge.zih.tu-dresden.de/plugins/mediawiki/wiki/fiesta/index.php/FIESTA |
| PHENIX 1.13_2998 | PHENIX | https://www.phenix-online.org/ |
| XDS 20180319 | XDS | https://xds.mr.mpg.de/ |
| Schrodinger Maestro, release 2019–4 | Schrodinger LLC | https://www.schrodinger.com |
| UCSF Chimera package version 1.14 | UCSF | https://www.cgl.ucsf.edu/chimera/ |
| Other | ||
| Monolith premium capillary tubes | Nanotemper | SKU:MO-K022 |
| Corning 384 Well Black NBS Flat Bottom Assay Plates | Corning | Cat#3654 |
Highlights.
A chemical inhibitor of Saccharomyces cerevisiae dynein enables structural studies
Structural data indicate that the inhibitor binds dynein’s regulatory ATPase sites
Blocking AAA3 and AAA4 sites in the motor protein can inhibit its activity
Data provide a structural framework that can aid in inhibitor optimization
Acknowledgements
T.M.K. is grateful to the NIH/NIGMS for funding (GM98579 and R35 GM130234-01). G.B. is grateful to the NIH/NIGMS R00GM112982 and the Damon Runyon Cancer Research Foundation DFS 20 16 for funding. C.C.S. was supported by the Tri-Institutional PhD Program in Chemical Biology and the Rockefeller University Graduate Program. K.J.M. was supported by a National Cancer Institute K00 Fellowship (K00CA223018). We thank Tommaso Cupido and Rudolf Pisa for providing us the following recombinant AAA proteins: Dm-spastin, Xl-katanin, Mm-VCP and Hs-FIGL1. We are especially grateful to Ronald Vale and the Vale lab for the gift of the VY137, VY972, VY1027, VY208 and VY696 S. cerevisiae strains. We thank James Fraser (University of California, San Francisco), Gydo van Zundert (Schrodinger LLC), and Kenneth Borrelli (Schrodinger LLC) for help with computational docking. We thank Carolina Adura at The Rockefeller University High-Throughput and Spectroscopy Resource Center and Deena Oren at The Rockefeller University Structural Biology Resource Center for assistance. The use of the Formulator robot in the Rockefeller University Structural Biology Resource Center was made possible by 1S10RR027037-01 from the National Center for Research Resources of the NIH. Cryo-EM grids were prepared at NYU Langone Health’s Cryo-Electron Microscopy Laboratory. We also thank Mark Ebrahim and Johanna Sotiris at the Evelyn Gruss Lipper CryoEM Resource Center at The Rockefeller University for assistance in data collection. This research used the 17-ID-2 beamline of the National Synchrotron Light Source II, a US Department of Energy (DOE) Office of Science User Facility operated by the Brookhaven National Laboratory under contract no. DE-SC0012704.
Footnotes
Declaration of Interests
The authors declare no competing financial interests.
Inclusion and Diversity
One or more of the authors of this paper self-identifies as an underrepresented ethnic minority in science.
Publisher's Disclaimer: This is a PDF file of an unedited manuscript that has been accepted for publication. As a service to our customers we are providing this early version of the manuscript. The manuscript will undergo copyediting, typesetting, and review of the resulting proof before it is published in its final form. Please note that during the production process errors may be discovered which could affect the content, and all legal disclaimers that apply to the journal pertain.
References
- Afonine PV, Klaholz BP, Moriarty NW, Poon BK, Sobolev OV, Terwilliger TC, Adams PD, and Urzhumtsev A (2018). New tools for the analysis and validation of cryo-EM maps and atomic models. Acta Crystallogr D Struct Biol 74, 814–840. [DOI] [PMC free article] [PubMed] [Google Scholar]
- Arkhipova V, Guskov A, and Slotboom D-J (2017). Analysis of the quality of crystallographic data and the limitations of structural models. J. Gen. Physiol 149, 1091–1103. [DOI] [PMC free article] [PubMed] [Google Scholar]
- Bhabha G, Cheng H-C, Zhang N, Moeller A, Liao M, Speir JA, Cheng Y, and Vale RD (2014). Allosteric communication in the dynein motor domain. Cell 159, 857–868. [DOI] [PMC free article] [PubMed] [Google Scholar]
- Burgess SA, Walker ML, Sakakibara H, Knight PJ, and Oiwa K (2003). Dynein structure and power stroke. Nature 421, 715–718. [DOI] [PubMed] [Google Scholar]
- Carter AP, Cho C, Jin L, and Vale RD (2011). Crystal structure of the dynein motor domain. Science 331, 1159–1165. [DOI] [PMC free article] [PubMed] [Google Scholar]
- Cho C, Reck-Peterson SL, and Vale RD (2008). Regulatory ATPase sites of cytoplasmic dynein affect processivity and force generation. J. Biol. Chem 283, 25839–25845. [DOI] [PMC free article] [PubMed] [Google Scholar]
- Cupido T, Pisa R, Kelley ME, and Kapoor TM (2019). Designing a chemical inhibitor for the AAA protein spastin using active site mutations. Nat. Chem. Biol 15, 444–452. [DOI] [PMC free article] [PubMed] [Google Scholar]
- DeSantis ME, Cianfrocco MA, Htet ZM, Tran PT, Reck-Peterson SL, and Leschziner AE (2017). Lis1 Has Two Opposing Modes of Regulating Cytoplasmic Dynein. Cell 170, 1197–1208.e12. [DOI] [PMC free article] [PubMed] [Google Scholar]
- DeWitt MA, Cypranowska CA, Cleary FB, Belyy V, and Yildiz A (2015). The AAA3 domain of cytoplasmic dynein acts as a switch to facilitate microtubule release. Nat. Struct. Mol. Biol 22, 73–80. [DOI] [PMC free article] [PubMed] [Google Scholar]
- Elshenawy MM, Canty JT, Oster L, Ferro LS, Zhou Z, Blanchard SC, and Yildiz A (2019). Cargo adaptors regulate stepping and force generation of mammalian dynein–dynactin. Nature Chemical Biology 15, 1093–1101. [DOI] [PMC free article] [PubMed] [Google Scholar]
- Emsley P, Lohkamp B, Scott WG, and Cowtan K (2010). Features and development of Coot. Acta Crystallogr. D Biol. Crystallogr 66, 486–501. [DOI] [PMC free article] [PubMed] [Google Scholar]
- Erzberger JP, and Berger JM (2006). Evolutionary relationships and structural mechanisms of AAA+ proteins. Annu. Rev. Biophys. Biomol. Struct 35, 93–114. [DOI] [PubMed] [Google Scholar]
- Firestone AJ, Weinger JS, Maldonado M, Barlan K, Langston LD, O’Donnell M, Gelfand VI, Kapoor TM, and Chen JK (2012). Small-molecule inhibitors of the AAA+ ATPase motor cytoplasmic dynein. Nature 484, 125–129. [DOI] [PMC free article] [PubMed] [Google Scholar]
- Gibbons BH, and Gibbons IR (1987). Vanadate-sensitized cleavage of dynein heavy chains by 365-nm irradiation of demembranated sperm flagella and its effect on the flagellar motility. J. Biol. Chem 262, 8354–8359. [PubMed] [Google Scholar]
- He M, Agbu S, and Anderson KV (2017). Microtubule motors drive Hedgehog signaling in primary cilia. Trends Cell Biol 27, 110–125. [DOI] [PMC free article] [PubMed] [Google Scholar]
- Höing S, Yeh T-Y, Baumann M, Martinez NE, Habenberger P, Kremer L, Drexler HCA, Küchler P, Reinhardt P, Choidas A, et al. (2018). Dynarrestin, a Novel Inhibitor of Cytoplasmic Dynein. Cell Chemical Biology 25, 357–369.e6. [DOI] [PMC free article] [PubMed] [Google Scholar]
- Jerabek-Willemsen M, André T, Wanner R, Roth HM, Duhr S, Baaske P, and Breitsprecher D (2014). MicroScale Thermophoresis: Interaction analysis and beyond. J. Mol. Struct 1077, 101–113. [Google Scholar]
- Kabsch W (2010). XDS. Acta Crystallogr. D Biol. Crystallogr 66, 125–132. [DOI] [PMC free article] [PubMed] [Google Scholar]
- Kon T, Nishiura M, Ohkura R, Toyoshima YY, and Sutoh K (2004). Distinct functions of nucleotide-binding/hydrolysis sites in the four AAA modules of cytoplasmic dynein. Biochemistry 43, 11266–11274. [DOI] [PubMed] [Google Scholar]
- Kon T, Oyama T, Shimo-Kon R, Imamula K, Shima T, Sutoh K, and Kurisu G (2012). The 2.8 Å crystal structure of the dynein motor domain. Nature 484, 345–350. [DOI] [PubMed] [Google Scholar]
- Loughlin R, Wilbur JD, McNally FJ, Nédélec FJ, and Heald R (2011). Katanin contributes to interspecies spindle length scaling in Xenopus. Cell 147, 1397–1407. [DOI] [PMC free article] [PubMed] [Google Scholar]
- McCoy AJ, Grosse-Kunstleve RW, Adams PD, Winn MD, Storoni LC, and Read RJ (2007). Phaser crystallographic software. J. Appl. Crystallogr 40, 658–674. [DOI] [PMC free article] [PubMed] [Google Scholar]
- Meyer HH, Shorter JG, Seemann J, Pappin D, and Warren G (2000). A complex of mammalian ufd1 and npl4 links the AAA-ATPase, p97, to ubiquitin and nuclear transport pathways. EMBO J 19, 2181–2192. [DOI] [PMC free article] [PubMed] [Google Scholar]
- Mickolajczyk KJ, Deffenbaugh NC, Ortega-Arroyo J, Andrecka J, Kukura P, and Hancock WO (2016). Kinetics of Nucleotide-Dependent Structural Transitions in the Kinesin-1 Hydrolysis Cycle. Biophysical Journal 110, 193a. [DOI] [PMC free article] [PubMed] [Google Scholar]
- Mijalkovic J, Prevo B, Oswald F, Mangeol P, and Peterman EJG (2017). Ensemble and single-molecule dynamics of IFT dynein in Caenorhabditis elegans cilia. Nat. Commun 8, 14591. [DOI] [PMC free article] [PubMed] [Google Scholar]
- Moore JK, Stuchell-Brereton MD, and Cooper JA (2009). Function of dynein in budding yeast: mitotic spindle positioning in a polarized cell. Cell Motil. Cytoskeleton 66, 546–555. [DOI] [PMC free article] [PubMed] [Google Scholar]
- Nicholas MP, Berger F, Rao L, Brenner S, Cho C, and Gennerich A (2015). Cytoplasmic dynein regulates its attachment to microtubules via nucleotide state-switched mechanosensing at multiple AAA domains. Proc. Natl. Acad. Sci. U. S. A 112, 6371–6376. [DOI] [PMC free article] [PubMed] [Google Scholar]
- Niekamp S, Coudray N, Zhang N, Vale RD, and Bhabha G (2019). Coupling of ATPase activity, microtubule binding, and mechanics in the dynein motor domain. EMBO J 38, e101414. [DOI] [PMC free article] [PubMed] [Google Scholar]
- Pisa R, Cupido T, and Kapoor TM (2019). Designing Allele-Specific Inhibitors of Spastin, a Microtubule-Severing AAA Protein. J. Am. Chem. Soc 141, 5602–5606. [DOI] [PMC free article] [PubMed] [Google Scholar]
- Rao L, Hülsemann M, and Gennerich A (2018). Combining Structure-Function and Single-Molecule Studies on Cytoplasmic Dynein. Methods Mol. Biol 1665, 53–89. [DOI] [PMC free article] [PubMed] [Google Scholar]
- Reck-Peterson SL, Yildiz A, Carter AP, Gennerich A, Zhang N, and Vale RD (2006). Single-molecule analysis of dynein processivity and stepping behavior. Cell 126, 335–348. [DOI] [PMC free article] [PubMed] [Google Scholar]
- Reck-Peterson SL, Redwine WB, Vale RD, Carter AP (2018). The cytoplasmic dynein transport machinery and its many cargoes. Nat. Rev. Mol. Cell Biol 19, 382–398 [DOI] [PMC free article] [PubMed] [Google Scholar]
- Roberts AJ (2018). Emerging mechanisms of dynein transport in the cytoplasm versus the cilium. Biochem. Soc. Trans 46, 967–982. [DOI] [PMC free article] [PubMed] [Google Scholar]
- Robertson MJ, Van Zundert GCP, Borrelli K, and Skiniotis G (2019). GemSpot: A Pipeline for Robust Modeling of Ligands into CryoEM Maps. BioRxiv [DOI] [PMC free article] [PubMed] [Google Scholar]
- Rohou A, and Grigorieff N (2015). CTFFIND4: Fast and accurate defocus estimation from electron micrographs. J. Struct. Biol 192, 216–221. [DOI] [PMC free article] [PubMed] [Google Scholar]
- Roll-Mecak A, and Vale RD (2008). Structural basis of microtubule severing by the hereditary spastic paraplegia protein spastin. Nature 451, 363–367. [DOI] [PMC free article] [PubMed] [Google Scholar]
- Ruhnow F, Zwicker D, and Diez S (2011). Tracking single particles and elongated filaments with nanometer precision. Biophys. J 100, 2820–2828. [DOI] [PMC free article] [PubMed] [Google Scholar]
- Schmidt H, and Carter AP (2016). Review: Structure and mechanism of the dynein motor ATPase. Biopolymers 105, 557–567. [DOI] [PMC free article] [PubMed] [Google Scholar]
- Schmidt H, Gleave ES, and Carter AP (2012). Insights into dynein motor domain function from a 3.3-Å crystal structure. Nat. Struct. Mol. Biol 19, 492–497, S1. [DOI] [PMC free article] [PubMed] [Google Scholar]
- Schmidt H, Zalyte R, Urnavicius L, and Carter AP (2015). Structure of human cytoplasmic dynein-2 primed for its power stroke. Nature 518, 435–438. [DOI] [PMC free article] [PubMed] [Google Scholar]
- See SK, Hoogendoorn S, Chung AH, Ye F, Steinman JB, Sakata-Kato T, Miller RM, Cupido T, Zalyte R, Carter AP, et al. (2016). Cytoplasmic Dynein Antagonists with Improved Potency and Isoform Selectivity. ACS Chem. Biol 11, 53–60. [DOI] [PMC free article] [PubMed] [Google Scholar]
- Steinman JB, and Kapoor TM (2019). Using chemical inhibitors to probe AAA protein conformational dynamics and cellular functions. Curr. Opin. Chem. Biol 50, 45–54. [DOI] [PMC free article] [PubMed] [Google Scholar]
- Steinman JB, Santarossa CC, Miller RM, Yu LS, Serpinskaya AS, Furukawa H, Morimoto S, Tanaka Y, Nishitani M, Asano M, et al. (2017). Chemical structure-guided design of dynapyrazoles, cell-permeable dynein inhibitors with a unique mode of action. Elife 6. [DOI] [PMC free article] [PubMed] [Google Scholar]
- Subramanian R, Ti S-C, Tan L, Darst SA, and Kapoor TM (2013). Marking and measuring single microtubules by PRC1 and kinesin-4. Cell 154, 377–390. [DOI] [PMC free article] [PubMed] [Google Scholar]
- Tang WK, Odzorig T, Jin W, and Xia D (2019). Structural Basis of p97 Inhibition by the Site-Selective Anticancer Compound CB-5083. Mol. Pharmacol 95, 286–293. [DOI] [PMC free article] [PubMed] [Google Scholar]
- Thompson AR, Hoeprich GJ, and Berger CL (2013). Single-molecule motility: statistical analysis and the effects of track length on quantification of processive motion. Biophys. J 104, 2651–2661. [DOI] [PMC free article] [PubMed] [Google Scholar]
- Thorn KS, Ubersax JA, and Vale RD (2000). Engineering the processive run length of the kinesin motor. J. Cell Biol 151, 1093–1100. [DOI] [PMC free article] [PubMed] [Google Scholar]
- Ti S-C, Pamula MC, Howes SC, Duellberg C, Cade NI, Kleiner RE, Forth S, Surrey T, Nogales E, and Kapoor TM (2016). Mutations in Human Tubulin Proximal to the Kinesin-Binding Site Alter Dynamic Instability at Microtubule Plus- and Minus-Ends. Dev. Cell 37, 72–84. [DOI] [PMC free article] [PubMed] [Google Scholar]
- Toropova K, Zou S, Roberts AJ, Redwine WB, Goodman BS, Reck-Peterson SL, and Leschziner AE (2014). Lis1 regulates dynein by sterically blocking its mechanochemical cycle. eLife 3. [DOI] [PMC free article] [PubMed] [Google Scholar]
- Zhang K, Foster HE, Rondelet A, Lacey SE, Bahi-Buisson N, Bird AW, and Carter AP (2017). Cryo-EM Reveals How Human Cytoplasmic Dynein Is Auto-inhibited and Activated. Cell 169, 1303–1314.e18. [DOI] [PMC free article] [PubMed] [Google Scholar]
Associated Data
This section collects any data citations, data availability statements, or supplementary materials included in this article.
Supplementary Materials
Movie S1. Dynein-driven microtubule gliding in the presence of compound 20, Related to Figure 6. Example movies of GFP-Sc-Dyn driving the gliding of taxol-stabilized microtubules in the presence of 1% DMSO (left), 25 μM compound 20 (middle), or 25 μM compound 6 (right). Movies were taken in the same flow cells both immediately after treatment (top) and after 30 minutes of treatment (bottom).
Data Availability Statement
Cryo-EM maps have been deposited in the EMDB under accession codes EMD-23841 (Map 1), EMD-23844 (Map 2), EMD-23846 (Map 3), EMD-23838 (Map 4), EMD-23842 (Map 5). Coordinates are available from the RCSB Protein Data Bank under accession codes 7MI6 (Model 1), 7MI3 (Model 4), and 7MI8 (Model 5). The crystal structure of Sc-DynlysoMut has been deposited in RCSB Protein Data Bank under accession code 7MI1. All other data generated or analyzed during this study are available in this article or from the corresponding author on reasonable request.


