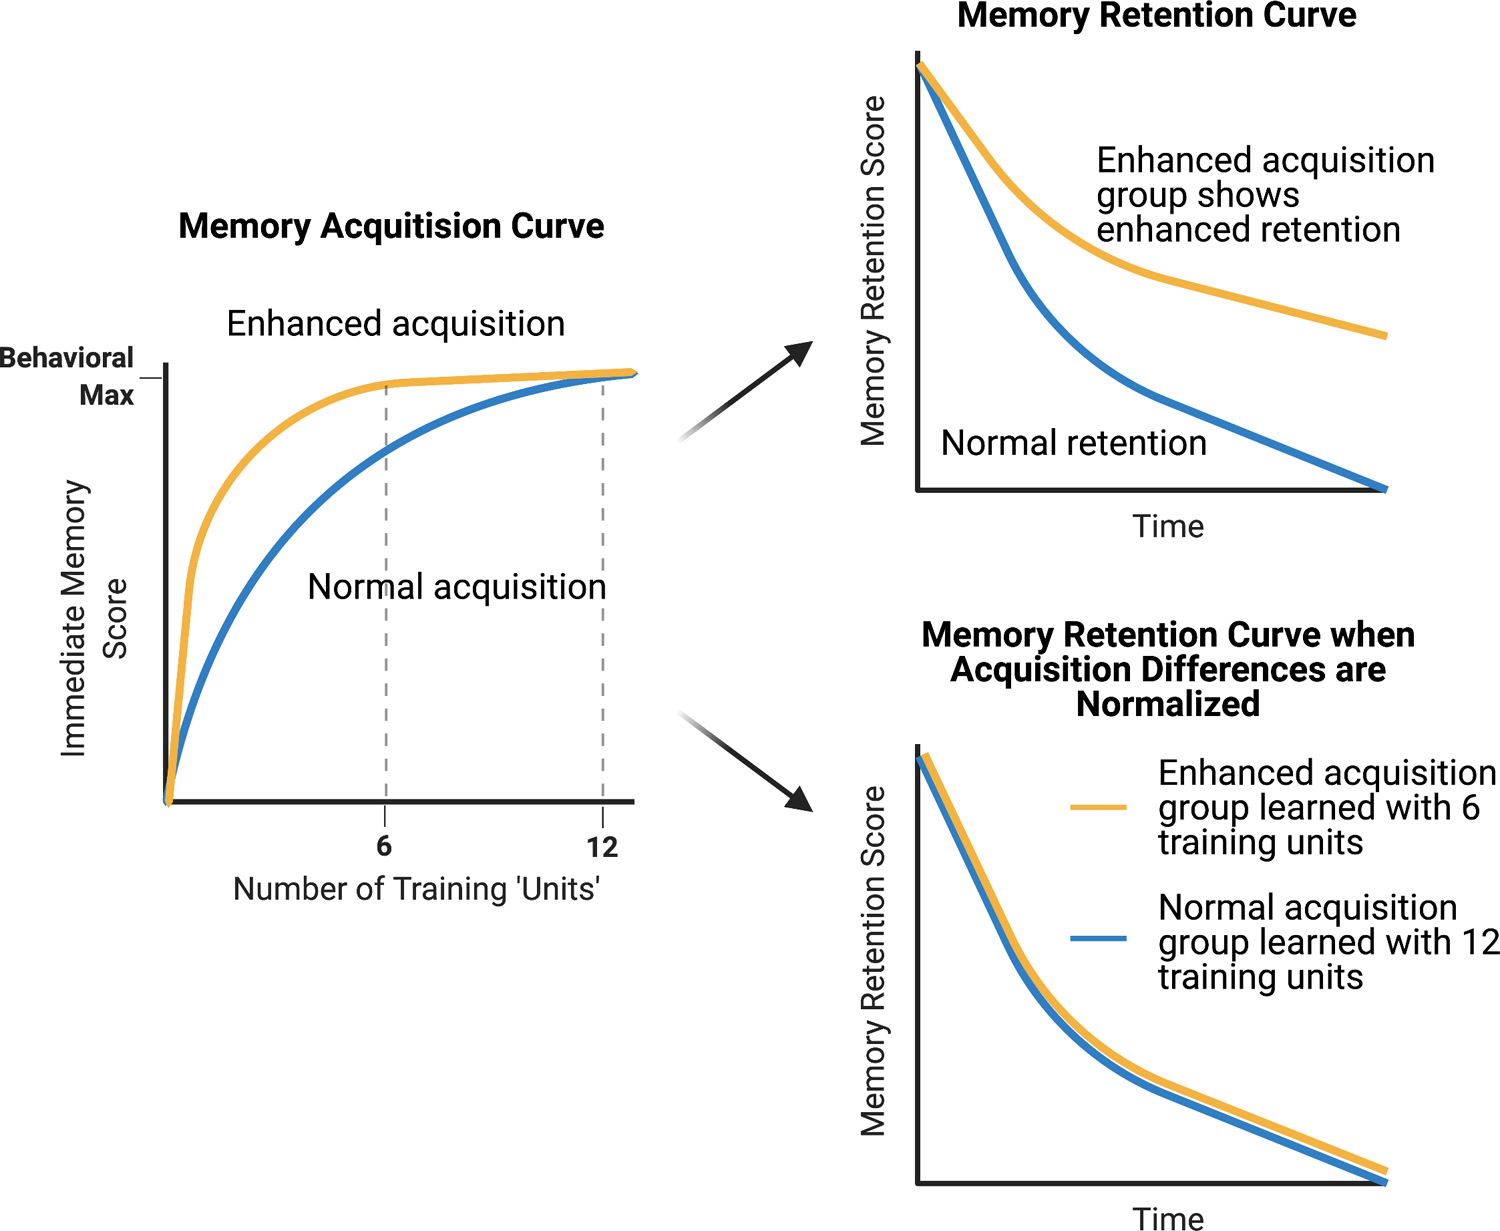
Figure 2: Normalizing for differences in memory acquisition.

Reducing memory suppressors of acquisition results in enhanced memory acquisition scores (yellow line) compared to wildtype animals (blue line) when short, multiple training sessions (‘Units’) are applied (left graph). Both groups often reach the same measured level of behavioral performance with sufficient training due to ceiling levels on performance in the memory tasks employed. When these groups are tested for later memory, they often exhibit enhanced retention scores across time (upper right graph). However, a retention curve obtained when groups reach ceiling levels of performance does not discriminate between enhanced acquisition, enhanced consolidation, or reduced forgetting. To tease these scenarios apart, the two groups are trained with different numbers of training ‘units’, normalizing for differences in acquisition before testing for memory retention (lower right graph). If the retention scores align with one another, this molecule is designated a suppressor of acquisition. If retention scores remain distinct, the molecule is assigned as having a role in acquisition as well as consolidation or active forgetting.
