

Abstract
Background
The severe acute respiratory syndrome coronavirus 2 (SARS-CoV-2) which emerged in late 2019 has spread globally, causing a pandemic of respiratory illness designated coronavirus disease 2019 (COVID-19). A better definition of the pulmonary host response to SARS-CoV-2 infection is required to understand viral pathogenesis and to validate putative COVID-19 biomarkers that have been proposed in clinical studies.
Methods
Here, we use targeted transcriptomics of formalin-fixed paraffin-embedded tissue using the NanoString GeoMX platform to generate an in-depth picture of the pulmonary transcriptional landscape of COVID-19, pandemic H1N1 influenza and uninfected control patients.
Results
Host transcriptomics showed a significant upregulation of genes associated with inflammation, type I interferon production, coagulation and angiogenesis in the lungs of COVID-19 patients compared to non-infected controls. SARS-CoV-2 was non-uniformly distributed in lungs (emphasising the advantages of spatial transcriptomics) with the areas of high viral load associated with an increased type I interferon response. Once the dominant cell type present in the sample, within patient correlations and patient–patient variation, had been controlled for, only a very limited number of genes were differentially expressed between the lungs of fatal influenza and COVID-19 patients. Strikingly, the interferon-associated gene IFI27, previously identified as a useful blood biomarker to differentiate bacterial and viral lung infections, was significantly upregulated in the lungs of COVID-19 patients compared to patients with influenza.
Conclusion
Collectively, these data demonstrate that spatial transcriptomics is a powerful tool to identify novel gene signatures within tissues, offering new insights into the pathogenesis of SARS-COV-2 to aid in patient triage and treatment.
Short abstract
Spatial transcriptomics revealed a significant upregulation of genes associated with inflammation, type 1 interferon production, coagulation and angiogenesis in the lungs of COVID-19 patients compared to non-infected controls https://bit.ly/30k9or0
Introduction
Since its emergence in 2019, severe acute respiratory syndrome coronavirus-2 (SARS-CoV-2) has caused a broad spectrum of disease, ranging from asymptomatic infections to acute respiratory distress syndrome (ARDS). Despite a lower fatality rate than other related coronaviruses, such as SARS-CoV-1 and Middle East respiratory syndrome coronavirus, SARS-CoV-2 is highly transmissible and to date has resulted in >175 million infections and >3.5 million deaths worldwide and rising [1]. Coronavirus disease 2019 (COVID-19) is the clinical manifestation of SARS-CoV-2 infection.
ARDS develops in 42% of COVID-19 patients presenting with pneumonia and accounts for a significant number of deaths associated with COVID-19 [2, 3]. ARDS is a form of hypoxemic respiratory failure defined by the presence of diffuse alveolar damage (DAD) commonly associated with bacterial pneumonia, sepsis, pancreatitis or trauma. The pathogenesis of ARDS is typically attributed to inflammatory injury to the alveolar–capillary membrane which leads to pulmonary oedema and respiratory insufficiency. In response to injury, alveolar macrophages orchestrate inflammation of the lung by recruiting neutrophils and circulating macrophages to the site of injury, leading to the death of alveolar epithelial cells and further impairing lung function [4]. Severe COVID-19 is often also characterised by concurrent vascular disease and coagulopathy. This includes breakdown of the vascular barrier, oedema, endothelialitis and thrombosis. Thrombotic and microvascular complications are frequently recorded in deceased patients, suggesting that vascular pathology is a major driver of severe disease [5]. While these mechanisms contribute to disease progression, it is unclear which mechanisms are the predominant factors in causing fatality.
Transcriptomic analysis of patient tissue offers a unique opportunity to not only understand the pathogenesis of SARS-CoV-2, but also to assist in biomarker validation. To date, the major search for clinical biomarkers, including transcriptomic analyses on COVID-19 patient samples, have been performed on whole blood. Blood samples from infected patients are highly accessible, but it is not clear whether blood parameters accurately reflect either the viral load or the level of tissue damage that clinical treatments aim to control [6]. The lung is the primary site of viral replication, yet only a limited number of transcriptomic studies have been performed on the lungs of COVID-19 patients. Such studies have used transcriptomic analyses on only a small patient cohort (one or two patients) [7, 8] or relied on “bulk” sequencing of whole-lung tissue, where any insight into tissue heterogeneity in this complex organ is lost [5, 9, 10]. In contrast, NanoString GeoMX digital spatial profiling (DSP) gene expression panels applied directly on tissue sections take into account the spatial location of transcriptomic features and are able to directly sample intra-organ heterogeneity [11, 12]. This provides a much deeper picture of the cellular changes driven by viral infection, and is a powerful way to define the characteristics of the host response to the virus and the spatial relationships between them. Indeed, such preliminary transcriptomic analysis of COVID-19 patient lungs appears promising [13]. However, such analyses require the application of advanced bioinformatics techniques to control for the numerous potential confounders present in gene expression data sampled in such a complex experimental design. In addition, there is a clear need to distinguish the host SARS-CoV-2 transcriptomic response (and associated spatial heterogeneity) from other infectious triggers of ARDS, such as influenza virus, which may be circulating concurrently with SARS-CoV-2.
To address these questions, we investigated the pathogenesis of SARS-CoV-2 in lung tissue using spatial transcriptomics approaches from rapid autopsy samples taken from 10 COVID-19 patients, five 2009 pandemic H1N1 (pH1N1) influenza virus patients and four control patient samples collected at a single institution. The NanoString GeoMX DSP platform combined with bioinformatic modelling allowed deconvolution of individual variability from viral and host factors. These data showed that viral load has a heterogeneous impact within a patient on the pulmonary transcriptomic response, and there is significant overlap in the gene expression profiles between influenza virus and SARS-CoV-2 infected samples. However, several unique transcriptomic signatures were detected in the lungs of COVID-19 patients. This study demonstrates the strengths of spatial transcriptomics coupled with powerful linear modelling bioinformatic techniques to broadly identify key pathways involved in viral infections and to clearly differentiate the involvement of distinct cellular and molecular pathways in different infections.
Materials and methods
Study design
Tissue microarray (TMA) cores were prepared from autopsied pulmonary tissue from 10 SARS-CoV-2 and five pH1N1 patients who died from respiratory failure (ARDS) (supplementary tables S1–S3). Control material was obtained from four uninfected patients (supplementary table S3). All SARS-CoV-2 and pH1N1 patients were confirmed for infection through reverse transcriptase quantitative PCR of nasopharyngeal swab specimens, and imaging with computed tomography (CT) showed diffuse and bilateral opacities with ground-glass attenuation, suggestive of viral pulmonary infection. Autopsy and biopsy materials were obtained from the Pontificia Universidade Catolica do Parana national commission for research ethics under the following ethics approval numbers: protocol number 3.944.734/2020 (for the COVID-19 group), 2.550.445/2018 (for the H1N1 and control groups). All methods were carried out following relevant guidelines and regulations. Families permitted the post-mortem biopsy of COVID-19 and H1N1pdm09 samples and conventional autopsy for the cases in the control group. The study was approved under University of Queensland and Queensland University of Technology human research ethics committee ratification.
For both groups, initially, imaging exams such as radiographs and CT scans were analysed to identify the pulmonary segments with more severe lung injury. Once radiographically evident and representative lesions were confirmed (especially the left-lobe pulmonary segments, since they can be removed in a more agile and practical mini-thoracotomy technique), we collected the sample through an anterior mini-thoracotomy on the fourth or fifth intercostal space. The time elapsed between the patient's death, obtaining the consent form by the relatives, and removing the fragments through the mini-thoracotomy did not exceed 4 h (COVID-19 and H1N1 groups). In all these cases (COVID-19 and H1N1 groups), the samples were similarly sized (3×3 cm) and were delicately handled and resected using surgical scissors. The samples were then fixed into a 10% concentration formalin solution and kept in it for ⩾24 h until blocking and slicing for microscopic analysis. The lung formalin-fixed paraffin-embedded (FFPE) samples were stained with haematoxylin and eosin to observe the histopathological aspects and find the appropriate and representative areas to punch and construct the TMA. Clinical data were obtained from medical records during hospitalisation in the intensive care unit (Hospital Marcelino Champagnat, Curitiba, Brazil, for the COVID-19 group and Hospital de Clínicas, Curitiba, for the H1N1 group) (figure 1).
FIGURE 1.

Schematic of the study. TMM: trimmed mean of M-values; UV: ultraviolet; TMA: tissue microarray.
Control group samples
Also included in this study was a control group of lung samples from patients who died from neoplastic or cardiovascular diseases (not involving lung lesions). The samples of the control group were obtained by the conventional autopsy technique.
The time elapsed between the patient's death, obtaining the consent form by the relatives, and removing the fragments through the conventional autopsy did not exceed 6 h.
These control group samples were then fixed into a 10% concentration formalin solution and kept in it for ⩾24 h until blocking and slicing for microscopic analysis.
The lung FFPE samples were stained with haematoxylin and eosin to observe the histopathological aspects and find the proper punch areas to construct the TMA.
Clinical data were obtained from medical records during hospitalisation at the Hospital de Clínicas (Curitiba).
Tissue preparation and histopathology
5-µm thick serial sections were cut from the TMA blocks onto positively charged slides (Bond Apex) and sections were stained with haematoxylin and eosin and Masson's trichrome stain. Brightfield images were obtained using an Aperio (Leica Biosystems, USA) slide scanner for assessment of histopathology by a pathologist. TMA cores were assessed for overall histological pattern. Regions of interest (ROIs) were semi-quantitatively analysed for alveolar haemorrhage and oedema, hyaline membrane formation, acute inflammation, type 2 pneumocyte hyperplasia, squamous metaplasia, capillary congestion, fibroblastic foci and interstitial inflammation.
Immunohistochemistry and RNAscope
Immunohistochemistry was performed on a Leica Bond-RX autostainer (Leica Biosystems, USA) with antibody targeting SARS-CoV-2 spike protein (Abcam, ab272504) at 2 μg·mL−1. Heat-induced epitope retrieval was performed in buffer ER1 at 100°C for 20 min, and the signal visualised with 3,3′-diaminobenzidine substrate. Slides were imaged using a Zeiss Axioscanner (Carl Zeiss, Germany) and immunohistochemistry was scored by a pathologist for bronchiolar epithelium, type 2 pneumocytes, interstitial lymphocytes and alveolar macrophage compartments.
RNAscope probes (ACDBio, USA) targeting SARS-CoV-2 spike mRNA (nCoV2019, #848561-C3), angiotensin-converting enzyme (ACE)2 host receptor mRNA (#848151-C2) and host serine transmembrane protease, serine 2 (TMPRSS2) mRNA (#470341-C1) were used per manufacturer's instructions for automation on Leica Bond RX. DNA was visualised with Syto13 (ThermoFisher Scientific), channel 1 with Opal 570 (1:500), channel 2 with Opal 620 (1:1500) and channel 3 with Opal 690 (1:1500) (PerkinElmer). Fluorescent images were acquired with NanoString Mars prototype DSP at 20×.
NanoString GeoMX DSP COVID-19 immune atlas panel
Freshly cut sections of each TMA were processed according to the NanoString GeoMX DSP slide preparation manual by the technology access programme. Briefly, slides were baked for 1 h at 60°C and then processed by Leica Bond RX autostainer. Slides were pre-treated with proteinase K and then hybridised with mRNA probes contained in the COVID-19 immune atlas panel with additional SARS-CoV-2 spike-in panel. After incubation, slides were washed and then stained with CD68, CD3, PanCK and Syto83 for 1 h then loaded into the GeoMX DSP instrument for scanning and ROI selection. Selected ROIs were guided by RNAscope and immunohistochemistry positivity on SARS-CoV-2 tissues with similar tissue structures captured on H1N1 and uninfected tissue cores. Oligonucleotides linked to hybridised mRNA targets were cleaved and collected for counting using Illumina i5 and i7 dual indexing. PCR reactions were performed with 4 μL of a GeoMX DSP sample. AMPure XP beads (Beckman Coulter) were used at 1.2× bead-to-sample ratio for PCR product purification. Paired-end sequencing (2×75) was performed using NextSeq550 up to 400 million total aligned reads. FASTQ files were processed by the DND system and uploaded to the GeoMX DSP system where raw and Q3 normalised counts of all targets were aligned with ROIs.
Transcriptomic data
Data used in this study result from an mRNA assay conducted with the NanoString GeoMX COVID-19 immune atlas panel using the GeoMX DSP. The data were measurements of RNA abundance of >1800 genes, including 22 add-in COVID-19 related genes, four SARS-CoV-2 specific genes and two negative control (SARS-CoV-2 Neg, NegProbe) genes and 32 internal reference genes. Samples were acquired from three TMA slides, each containing 10 tissue cores from 10 patients. The three slides correspond to either COVID-19, H1N1 or control tissue biopsies. Transcriptomic measurements were made on ROIs within each core. Control samples are COVID-19-free and H1N1-free, but they are not necessarily disease-free samples; they originate from patients with other non-viral diseases. In total, 60 ROIs were analysed (47 COVID-19, eight H1N1 and five “control”). Factors considered in this dataset include disease type (COVID-19, H1N1 and control), patient of origin, dominant tissue type (type 2 pneumocytes, bronchiolar epithelium, hyaline membranes, macrophages) and viral load (based on RNAscope scores).
Bioinformatic analyses
Data exploration and quality checks were conducted on the Q3 normalised count data generated from the Cancer Transcriptome Atlas DSP mRNA assay. Relative log expression plots were used to assess the presence of unwanted variation in the form of batch effects [14]. Data were normalised using the trimmed mean of M-values (TMM) method [15] using all genes in the panel. Specifically, log2-transformed transcript abundance data were median-centred for each gene, and then within each sample the difference between the observed and population median of each gene was calculated. Principal components analysis (PCA) of the samples was conducted to identify variability related to specific factors in the dataset and experimental design.
Differential expression analysis, Gene Ontology and Kyoto Encyclopedia of Genes and Genomes (KEGG) pathway enrichment analysis were carried out using the R/Bioconductor packages edgeR (v3.30.3) [16, 17] and limma (v3.44.3) [18]. Briefly, differential expression was modelled using linear models with various experimental factors as predictors. Variation in gene expression was modelled as the combination of a common dispersion that applies to all genes and a gene-specific dispersion. Limma was used to model and estimate the variation of each gene by borrowing information from all other genes using an empirical Bayes approach, thereby allowing estimation of the common and gene-wise variation with as few as two replicates per condition. Once the linear model was fitted to a given experimental design, various contrasts of interest were used to query the data for differential expression. The resulting statistic was an empirical Bayes-moderated t-statistic, which was more robust than a t-statistic from a classic t-test. Based on the observed differences between cores and tissue structures from the PCA analyses, considerations were made to allow for similarity that exists for regions originating from the same core using duplicationCorrelations in limma [19]. The flexible modelling framework afforded by linear models was used to take into account differences between heterogeneous tissue structures (i.e. bronchiolar epithelial samples versus the rest of the samples) by including them as covariates in the models.
Two main factors were investigated in this analysis, namely disease type (COVID-19, H1N1 and control) and viral load. For disease type, two comparisons were investigated: COVID-19 against control with cores and dominant tissue type as covariates, and COVID-19 against H1N1 samples, with cores and dominant tissue type as covariates. For these two contrasts, the voom-limma with duplicationCorrelations pipeline [20] was used to fit linear models. The t-tests relative to a threshold (TREAT) criterion was then applied [21] (p<0.05) to perform statistical tests and subsequently calculate the t-statistics, log-fold change (logFC) and adjusted p-values for all genes. For viral load, the voom-limma with duplicationCorrelations pipeline [20] (p<0.05) was used to fit linear models for the comparison between high and low viral load regions originating from COVID-19 patient cores (disease type as a covariate). The contrast was applied on two resolutions, firstly by grouping ROIs from the same cores with the same degree of viral load (core/patient-based approach); secondly by treating each regions/ROI sample as an independent observation (ROI-based approach). Gene set enrichment analyses (GSEA) were performed using the fry approach from the limma package. Gene sets from the Molecular Signatures Database hallmarks [22, 23], C2 (curated gene sets) and C7 (immunological signature gene sets) categories were tested using fry. Pathways from the KEGG pathway database were tested using the kegga function in the limma package and gene ontology enrichment was assessed using goana from the limma package [19].
Results
Patient characteristics
Lung tissues were obtained by rapid autopsy from 10 SARS-CoV-2 infected patients, five pH1N1 influenza patients and four non-virally infected control patients. The SARS-CoV-2 cohort was made up of four females and six males with mean age of 76 years (ranging from 46 to 93 years). These patients exhibited multiple comorbidities including obesity, diabetes and heart disease and had received varying treatment following hospital admission. Patient survival after admission ranged from 8 to 38 days, with time on mechanical ventilation ranging from 3 to 21 days (supplementary table S1). Blood profiling performed on admission and again immediately prior to death showed elevated D-dimer levels for seven out of 10 patients, consistent with vascular coagulopathy (supplementary table S2).
The pH1N1 influenza virus patient cohort comprised five males with a mean age of 45.8 years (ranging from 31 to 53 years). All patients had received mechanical ventilation from the time of admission until death. The uninfected control cohort consisted of four males with a mean age of 36.25 years (ranging from 18 to 60 years), whose tissues were donated following death from non-viral and non-respiratory diseases (supplementary table S3).
Histopathological characterisation
TMAs were prepared from pulmonary FFPE cores of each of the three cohorts (one core per patient) and blinded histological examination was performed by a pathologist (supplementary table S4). Acute-phase DAD characterised by hyaline membranes, type 2 pneumocyte hyperplasia and alveolar septal thickening was a prominent feature of SARS-CoV-2 cores. pH1N1 tissues also showed features of DAD, with alveolar haemorrhage evident in two of the cores. These findings were not seen in control cores. Fibrosis was not a prominent feature, apart from one SARS-CoV-2 core that exhibited moderate interstitial and alveolar fibrosis with concordant histological organising pneumonia. Two pH1N1 cores showed mild interstitial fibrosis that were characterised by acute-phase or late organising phase DAD.
RNAscope and ROI selection for digital spatial transcriptional profiling
Transcriptional profiling of target cores was guided by the detection of SARS-CoV-2 spike mRNA. Two cores (figure 2; LN1 and LN3) exhibited strong signals for viral mRNA (figure 2a) and these cores were comprehensively evaluated using the GeoMX DSP platform (shaded regions, figure 2b). 25 ROIs were selected from these two RNAscope positive cores and 21 ROIs were selected from remaining eight cores of SARS-CoV-2 infected patients (minimum of one ROI per patient) for which viral mRNA was below detection by RNAscope. Eight ROIs were selected from the lungs of five pH1N1 patients (minimum of one ROI per patient), and five ROIs were selected from the lungs of control patients (minimum of one ROI per patient).
FIGURE 2.

RNA-fluorescence in situ hybridization (FISH) and digital spatial profiling morphology marker visualisation of novel coronavirus 2019 (nCoV2019) mRNA positive cores. Region of interest (ROI) selection was guided by RNAscope-FISH staining for nCoV2019 spike mRNA. a) RNA-FISH staining on coronavirus disease (COVID) tissue microarray (TMA) showing the cores LN1 and LN3, which were highly positive for nCoV2019 spike mRNA (red). Nuclei are shown in blue (4′,6-diamidino-2-phenylindole (DAPI) staining). Scale bar=250 µm. b) Representative ROIs selected across LN1 and LN3 severe acute respiratory syndrome coronavirus 2 (SARS-CoV-2) virus-positive cores on immunohistological paraffin-embedded sections stained for monocytes (CD68, yellow), T-cells (CD3ε, red), lung epithelial cells (PanCK, green) and nuclei (DAPI, blue). c) High-resolution image of high viral core LN1 where each region of interest has been determined for the majority cell type (hyaline membrane/T2 pneumocyte). d) High-resolution image of high viral core LN3 where each region of interest has been determined for the majority cell type (hyaline membrane, T2 pneumocyte, macrophages, bronchiolar epithelial cells).
SARS-CoV-2 RNAscope abundance was semi-quantitatively assessed for each ROI. Representative scoring criteria from 0 to 3 are shown in supplementary figure S2, where positive scores were allocated only to regions within LN1 and LN3 (supplementary table S5). In addition, concordant spike protein immunohistochemistry appeared to be specific for type 2 pneumocytes and bronchiolar epithelial regions; however, some staining was also observed within interstitial lymphocytes and alveolar macrophages (supplementary figure S1). Interestingly, spike protein immunohistochemistry indicated virus in cores other than LN1 and LN3 (supplementary table S5) that did not produce a detectable signal using RNAscope. Low-level non-specific staining was observed in some regions of pH1N1 and control tissues (supplementary table S5). We thus focused our ROI selection on cores that indicated high mRNA integrity and viral detection by RNAscope.
Histopathology and dominant features of ROIs
Assessment of histology by a pathologist allowed ROIs to be grouped by tissue architecture prior to further analysis. The predominant cell types found within each ROI were annotated in addition to scoring of their histopathology and spike protein immunohistochemistry (supplementary table S5). ROIs could be broadly categorised into regions dominated by bronchiolar epithelial structures, type 2 pneumocytes, hyaline membranes and macrophages (supplementary figure S2). Alveolar oedema, acute inflammation and squamous metaplasia were not observed in diseased or control cores; however, type 2 pneumocyte hyperplasia and capillary congestion were present in SARS-CoV-2 pulmonary tissues.
Data normalisation strategy and exploratory analysis of spatial transcriptomic data
Q3 housekeeping normalised data was corrected for systematic bias by TMM to allow for comparisons between SARS-CoV-2, pH1N1 influenza virus and control samples (supplementary figure S3). PCA plots were then used to explore the variability in SARS-CoV-2, pH1N1 influenza virus and control lung samples and to determine whether they could be clearly separated simply based on the type of infecting pathogen and to identify factors that might confound differential expression analysis. Principal components (PCs) capture orthogonal dimensions of variability in the data in descending order of contribution. Non-infected samples clearly separate from other samples on PC1 and PC3, while SARS-CoV-2 and pH1N1 influenza samples remained associated on these axes (figure 3a). Indeed, across PC1–PC4, SARS-CoV-2 and pH1N1 influenza samples substantially overlapped. This suggests that the transcriptomic profile of SARS-CoV-2 and pH1N1 influenza virus tissues were not highly variable at low viral load, and that a common transcriptome was induced by these two viruses in fatal cases.
FIGURE 3.

Principal components (PCs) identify variability and factors in the transcriptomic data. PCs capturing orthogonal dimensions of variability in the transcriptomic data in descending order of contribution (i.e. PC1–PC2, PC3–PC2 and PC3–PC4) were plotted stratifying based on the following factors in the experimental data: a) disease types, b) cores/patients with disease types, c) dominant tissue types with disease types and d) viral load in cores/patients. BRO_EPI: bronchiolar epithelium; HYALINE: hyaline membranes; MACRO: macrophages; T2_PNEU: type2 pneumocytes; OTHER: other classifications.
To further examine the major sources of variation in the dataset, we labelled PCA plots by multiple different parameters including sample core (figure 3b), dominant cell type (figure 3c) and viral load (figure 3d). When samples were labelled by core, PC3 and PC4 were able to distinguish patient-specific effects, as shown by a clear separation of cores LN1 and LN3, with clustering of other cores with multiple ROIs (LN10) (figure 3b). This suggests that within-patient correlations and patient–patient variation has an important underlying effect on the observed transcriptome and that this needs to be taken into account in any subsequent analysis. Additionally, samples separating on PC2, and clearly clustered from other samples when plotting PC1 and PC2 were grouped based on the dominant cell type found within the sample core (figure 3c). Specifically, ROIs where bronchiolar epithelial cells were the dominant cell type clustered together independent of whether the patient had pH1N1 influenza virus or SARS-CoV-2 (figure 3c), or belonged to the non-infected controls. This implied that the tissue heterogeneity captured by dominant cell type was a substantial contributor to the variability in our experiment. While epithelial cells are the primary cellular target of both SARS-CoV-2 and influenza virus [24], our data did not identify viral epithelial tropism as a key regulator of signal as the cores dominated by bronchial epithelial cells did not exhibit the highest viral load (as defined by RNAscope for SARS-CoV-2) (figure 3d). However, the high SARS-CoV-2 viral load cores separate from other virally infected samples and control samples on PC3 (figure 3d). Together, these analyses suggest that unbiased and accurate comparative transcriptomics analyses between uninfected, SARS-CoV-2 and pH1N1 influenza lung samples must take account of the dominant cell type present in samples, inter-patient variations and within-patient correlations. The ability to include structural and spatial covariates demonstrates the key advantage in using a spatial transcriptomics as compared with bulk RNA sequencing, but also necessitates careful construction of the model used to compare expression across the ROIs sampled.
Severe COVID-19 infection results in a global pro-inflammatory response and downregulation of immune cell effector and regeneration pathways
Differential gene expression analysis was subsequently performed on all sample cores, taking into account the effect of the dominant cell type and the appropriate within- and inter-patient variations. 286 genes were identified as significantly upregulated and 20 genes were significantly downregulated in the lungs of SARS-CoV-2 patients compared with non-virally infected controls (figure 4, supplementary tables S6 and S7).
FIGURE 4.

Coronavirus disease 2019 (COVID-19) infection drives pro-inflammatory response and suppresses immune cell effector and regeneration. Distribution of differentially expressed genes as a function of the average transcript expression and fold change (log2) identified in COVID-19 samples versus uninfected (control) samples. Downregulated genes included immune-related, cytokine, tumour/cell-survival associated genes and cell regeneration genes, inferring a suppression of immune cell effect and regeneration. Upregulated genes are enriched with pro-inflammatory genes including type I interferon (IFN) response and fibrosis genes. Representative genes from these processes are highlighted. Differential expression genes generated using the voom-limma pipeline with limma:duplicationCorrelations and applying t-tests relative to a threshold (TREAT) criteria with absolute log fold change >1.2 with p-value <0.05.
Downregulated genes included immune-related genes such as B lymphocyte antigen CD19, cytokine genes such as IL7, IL9 and IL13 and components of the complement cascade (e.g. C9) together with CSF3, colony stimulating factor, normally associated with mobilisation of cells from the bone marrow (supplementary table S6). A number of tumour-associated genes including GAGE1 and MAGEC2 were downregulated, with these genes being associated with cell survival. Interestingly, PCK1, which is required for tissue gluconeogenesis, and MPL, which regulates the generation of megakaryocytes and thus platelet formation, were also highly reduced [25].
A more diverse array of upregulated genes was found to be differentially expressed in the lungs of SARS-CoV-2 patients compared with those from patients who died of non-viral causes (supplementary table S7). These included genes associated with antigen presentation (e.g. B2M, HLA-DRA, HLA-C and HLA-E), the type I interferon (IFN) response (e.g. LY6E and IFI27), fibrosis and epithelial cell growth (e.g. OL3A1, FN1, KRT7, COL1A1, KRT18 and KRT19) and the complement cascade (C1QA and C1R). Consistent with these observations, gene set enrichment analysis showed that hallmark genes of biological processes such as reactive oxygen species, complement, interleukin (IL)-6/Janus kinase/signal transducer and activator of transcription (STAT)3 signalling, apoptosis, p53 signalling IFN-γ response, hypoxia, IFN-α response, coagulation, transforming growth factor-β signalling, IL-2/STAT5 signalling, angiogenesis, tumour necrosis factor-α signalling via NF-κB and inflammatory response were all significantly upregulated in SARS-CoV-2 infected lungs (table 1). Gene set enrichment using blood coagulation, hypoxia responses and angiogenesis-related genes from NanoString's nCounter PanCancer Progression Panel further confirmed the upregulation of pathways associated with hypoxia responses, blood coagulation and angiogenesis responses (table 2). These analyses show that SARS-CoV-2 samples significantly upregulate genes associated with blood coagulation, angiogenesis and the IFN-α and IFN-γ response and positively regulate cytokine production and cytokine stimulus during the immune response (figure 5). These data are consistent with previous descriptions of a “cytokine storm” response in patients with severe SARS-CoV-2, often accompanied by various coagulopathies [26]. In addition, they are in agreement with the notion that a late-stage or delayed type I IFN response may be observed in concert with a pro-inflammatory response [27].
TABLE 1.
Gene set enrichment analysis for severe acute respiratory syndrome coronavirus 2 (SARS-CoV-2) versus uninfected differential expression genes using Molecular Signatures Database hallmark gene sets
| Gene set name | Genes n | Direction of change | Two-sided directional | Non-directional | ||
| p-value | FDR | p-value | FDR | |||
| HALLMARK_REACTIVE_OXYGEN_SPECIES_PATHWAY | 13 | Up | 6.92 | 2.74 | 2.61 | 6.92 |
| HALLMARK_COMPLEMENT | 76 | Up | 6.60 | 23.44 | 21.74 | 6.60 |
| HALLMARK_KRAS_SIGNALING_DN | 40 | Down | 6.60 | 11.03 | 10.67 | 6.60 |
| HALLMARK_IL6_JAK_STAT3_SIGNALING | 73 | Up | 6.46 | 19.71 | 18.62 | 6.46 |
| HALLMARK_UNFOLDED_PROTEIN_RESPONSE | 16 | Up | 6.37 | 2.47 | 2.35 | 6.37 |
| HALLMARK_APOPTOSIS | 79 | Up | 6.37 | 17.81 | 17.02 | 6.37 |
| HALLMARK_OXIDATIVE_PHOSPHORYLATION | 33 | Up | 5.25 | 5.28 | 5.05 | 5.25 |
| HALLMARK_P53_PATHWAY | 56 | Up | 4.98 | 16.44 | 15.69 | 4.98 |
| HALLMARK_MTORC1_SIGNALING | 47 | Up | 4.84 | 12.27 | 11.85 | 4.84 |
| HALLMARK_INTERFERON_GAMMA_RESPONSE | 110 | Up | 4.84 | 13.77 | 13.25 | 4.84 |
| HALLMARK_PROTEIN_SECRETION | 10 | Up | 4.78 | 1.14 | 1.11 | 4.78 |
| HALLMARK_GLYCOLYSIS | 48 | Up | 4.75 | 14.00 | 13.44 | 4.75 |
| HALLMARK_PANCREAS_BETA_CELLS | 5 | Down | 4.59 | 0.09 | 0.09 | 4.59 |
| HALLMARK_HYPOXIA | 60 | Up | 4.55 | 18.84 | 17.84 | 4.55 |
| HALLMARK_MYC_TARGETS_V2 | 8 | Up | 4.49 | 0.25 | 0.24 | 4.49 |
| HALLMARK_CHOLESTEROL_HOMEOSTASIS | 15 | Up | 4.33 | 1.83 | 1.77 | 4.33 |
| HALLMARK_INTERFERON_ALPHA_RESPONSE | 52 | Up | 4.33 | 8.74 | 8.41 | 4.33 |
| HALLMARK_SPERMATOGENESIS | 19 | Down | 3.68 | 1.59 | 1.54 | 3.68 |
| HALLMARK_MYC_TARGETS_V1 | 28 | Up | 3.60 | 4.40 | 4.22 | 3.60 |
| HALLMARK_KRAS_SIGNALING_UP | 77 | Up | 3.38 | 16.13 | 15.43 | 3.38 |
| HALLMARK_ADIPOGENESIS | 30 | Up | 3.30 | 4.88 | 4.67 | 3.30 |
| HALLMARK_COAGULATION | 56 | Up | 3.05 | 15.14 | 14.49 | 3.05 |
| HALLMARK_XENOBIOTIC_METABOLISM | 36 | Up | 2.98 | 11.63 | 11.25 | 2.98 |
| HALLMARK_ANDROGEN_RESPONSE | 16 | Up | 2.86 | 2.24 | 2.14 | 2.86 |
| HALLMARK_FATTY_ACID_METABOLISM | 20 | Up | 2.79 | 4.63 | 4.44 | 2.79 |
| HALLMARK_APICAL_JUNCTION | 61 | Up | 2.69 | 18.58 | 17.70 | 2.69 |
| HALLMARK_UV_RESPONSE_UP | 46 | Up | 2.68 | 12.07 | 11.67 | 2.68 |
| HALLMARK_EPITHELIAL_MESENCHYMAL_TRANSITION | 81 | Up | 2.64 | 14.94 | 14.32 | 2.64 |
| HALLMARK_ESTROGEN_RESPONSE_EARLY | 40 | Up | 2.60 | 8.46 | 8.16 | 2.60 |
| HALLMARK_TGF_BETA_SIGNALING | 20 | Up | 2.53 | 3.35 | 3.20 | 2.53 |
| HALLMARK_ESTROGEN_RESPONSE_LATE | 51 | Up | 2.51 | 12.47 | 12.01 | 2.51 |
| HALLMARK_DNA_REPAIR | 27 | Up | 1.99 | 5.96 | 5.71 | 1.99 |
| HALLMARK_MITOTIC_SPINDLE | 27 | Up | 1.94 | 3.12 | 2.98 | 1.94 |
| HALLMARK_IL2_STAT5_SIGNALING | 85 | Up | 1.81 | 14.68 | 14.10 | 1.81 |
| HALLMARK_ANGIOGENESIS | 19 | Up | 1.81 | 2.23 | 2.13 | 1.81 |
| HALLMARK_UV_RESPONSE_DN | 44 | Up | 1.78 | 8.73 | 8.41 | 1.78 |
| HALLMARK_HEDGEHOG_SIGNALING | 12 | Up | 1.75 | 0.98 | 0.96 | 1.75 |
| HALLMARK_G2M_CHECKPOINT | 67 | Up | 1.70 | 12.43 | 11.99 | 1.70 |
| HALLMARK_APICAL_SURFACE | 13 | Up | 1.68 | 1.32 | 1.28 | 1.68 |
| HALLMARK_TNFA_SIGNALING_VIA_NFKB | 107 | Up | 1.57 | 13.21 | 12.71 | 1.57 |
| HALLMARK_INFLAMMATORY_RESPONSE | 115 | Up | 1.49 | 20.51 | 19.29 | 1.49 |
| HALLMARK_E2F_TARGETS | 61 | Up | 1.46 | 8.04 | 7.76 | 1.46 |
| HALLMARK_NOTCH_SIGNALING | 21 | Up | 1.26 | 3.71 | 3.54 | 1.26 |
| HALLMARK_MYOGENESIS | 35 | Up | 1.11 | 7.37 | 7.11 | 1.11 |
| HALLMARK_PI3K_AKT_MTOR_SIGNALING | 56 | Up | 1.11 | 18.55 | 17.70 | 1.11 |
| HALLMARK_PEROXISOME | 17 | Up | 0.80 | 2.12 | 2.04 | 0.80 |
| HALLMARK_ALLOGRAFT_REJECTION | 141 | Up | 0.42 | 22.32 | 20.92 | 0.42 |
| HALLMARK_WNT_BETA_CATENIN_SIGNALING | 27 | Up | 0.38 | 5.58 | 5.34 | 0.38 |
| HALLMARK_BILE_ACID_METABOLISM | 14 | Down | 0.25 | 1.79 | 1.73 | 0.25 |
| HALLMARK_HEME_METABOLISM | 19 | Up | 0.04 | 2.19 | 2.10 | 0.04 |
All p-value and false discovery rates (FDRs) reported as −log10 values. Gene set signatures in green are enriched in SARS-CoV-2 compared to control (i.e. direction is up), while red is the opposite direction (i.e. down); gene sets highlighted in yellow indicate biological processed upregulated in SARS-CoV-2 infected lungs. List ordered by descending FDR.
TABLE 2.
Gene set enrichment analysis for severe acute respiratory syndrome coronavirus 2 (SARS-CoV-2) versus uninfected differential expression genes using NanoString's nCounter PanCancer Progression Panel custom gene sets
| Gene set name | Genes n | Direction of change | Two-sided directional | Non-directional | ||
| p-value | FDR | p-value | FDR | |||
| Blood coagulation | 47 | Up | 4.30 | 3.56 | 11.62 | 11.06 |
| Angiogenesis response | 56 | Up | 2.30 | 1.74 | 22.35 | 21.31 |
| Hypoxia response | 36 | Up | 1.89 | 1.43 | 7.35 | 6.97 |
| Positive regulation of angiogenesis | 35 | Down | 0.98 | 0.79 | 8.38 | 7.94 |
| Negative regulation of angiogenesis | 17 | Up | 0.51 | 0.42 | 1.62 | 1.35 |
| Fibrosis | 9 | Up | 0.27 | 0.23 | 1.05 | 0.96 |
| Regulation of angiogenesis | 11 | Down | 0.08 | 0.08 | 1.12 | 0.96 |
All p-values and false discovery rates (FDRs) reported as −log10 value. Gene sets highlighted in green indicate biological processes identified by gene set enrichment analysis to be differentially upregulated in SARS-CoV-2 infected lungs versus uninfected samples with FDR <0.05.
FIGURE 5.
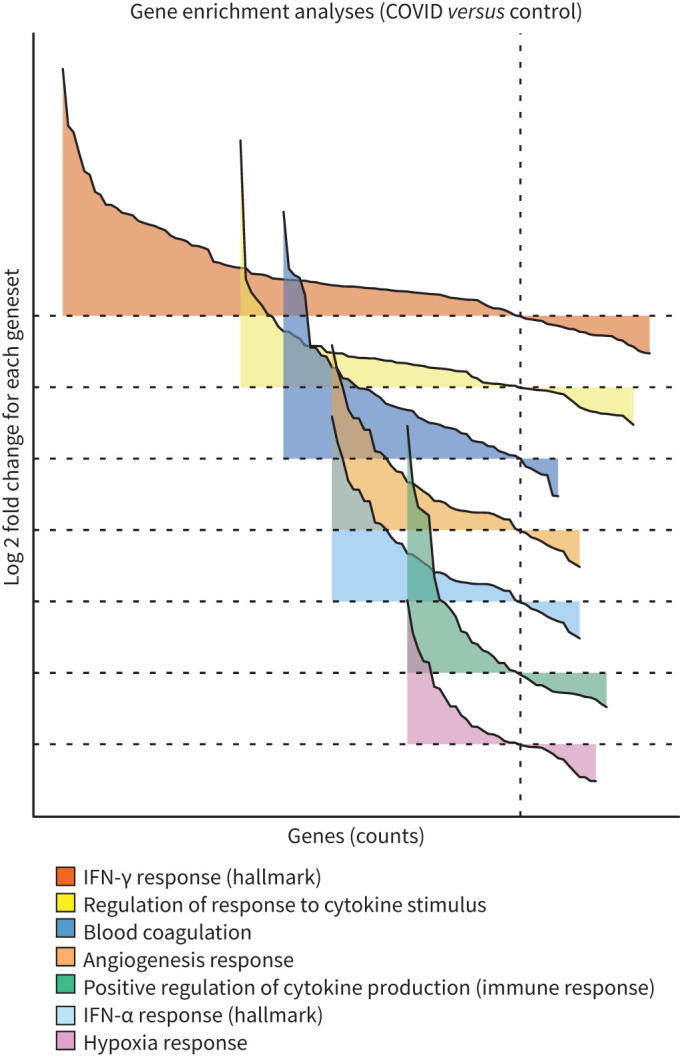
Gene set enrichment analysis (GSEA) reveals upregulated cytokine responses with accompanying coagulopathies in coronavirus disease 2019 (COVID-19) infection. GSEA for differentially expressed genes comparing COVID-19 and uninfected samples were conducted using the estimated log2 fold change and p-values with the distribution of significantly differentiated gene sets visualised as a function of the log2 fold change (logFC) and genes sorted by the logFC (waterfall plot). The gene sets visualised are custom gene sets for “angiogenesis response”, “blood coagulation”, “hypoxia” responses based on NanoString's nCounter PanCancer Progression Panel were identified by GSEA to be differentially upregulated in COVID-19 samples (table 2); Molecular Signatures Database (MSigDB) hallmark gene set for interferon (IFN)-α and IFN-γ and MSigDB Gene Ontology (GO) gene sets for “regulation of response to cytokine stimulus” and “positive regulation of cytokine production involved in immune response”. Gene sets ordered by gene counts. Refer to the comprehensive list in table 1. GSEA conducted using limma:fry with false discovery rate <0.05. The direction and relative change in expression are shown. Details of each gene set are provided in supplementary figures S4 and S5.
Limited differential gene expression associated with SARS-CoV-2 viral load
The pathogenesis of SARS-CoV-2 is a complex interplay of host immunopathology and viral load. To determine how viral load influenced the host transcriptomic signal, we performed a differential expression analysis of SARS-CoV-2 samples stratifying based on viral load. Patient sample cores were classified as either “high” or “low” based on the presence of viral mRNA by RNAscope. Thus, two cores which were scored positively by RNAscope, LN1 and LN3, were designated as “high”, while the remaining eight cores from SARS-CoV-2 patients were scored as “low”. This analysis showed that only 17 upregulated and seven downregulated genes were differentially expressed between the high viral load SARS-CoV-2 infected cores and the other SARS-CoV-2 cores (figure 6, table 3). Consistent with our RNAScope analyses, SARS-CoV-2 specific genes S and ORF1ab were the most strongly upregulated genes in the high viral load group (1.916 and 1.861 log2 fold change, respectively). This is also consistent with previous observations that in at least some COVID-19 patients, these are the most highly expressed viral genes in the lung [28]. All other upregulated genes with >1 log2 fold change in expression were associated with the type I IFN response (CXCL10, IFIT3, ISG15, MX1, GBP1 and IFI6) (figure 6a, table 3).
FIGURE 6.

Resolution provided by spatial data reveals that type I interferon (IFN) gene signature associates with coronavirus disease 2019 (COVID-19) viral load. Distribution of differentially expressed genes as a function of the average transcript expression and fold change (log2) identified in high viral load versus low viral load COVID-19 samples. Analyses were conducted at two resolutions, firstly by a) grouping regions of interest (ROIs) from the same cores with the same degree of viral load (core patient-based approach); and secondly by b) treating each region/ROI sample as an independent observation (ROI-based approach). In both approaches, severe acute respiratory syndrome coronavirus 2 (SARS-CoV-2)-specific genes S and ORF1ab were strongly upregulated in the high viral load group, consistent with results of the RNAscope. Consistent with previous reports, type I IFN response genes were associated with SARS-CoV-2 RNA expression. Notably, the core-based approach reveals limited differential gene expression with the finer resolution ROI-based approach revealing additional differential changes in complement cascade, ribosomal protein and antioxidants genes. Representative genes are highlighted. Differential expression genes derived using voom-limma pipeline with limma:duplicationCorrelations and applying absolute log2 fold change >1.0 with p-value <0.05.
TABLE 3.
Genes differentially expressed in the lungs of severe acute respiratory syndrome coronavirus 2 (SARS-CoV-2) patients with high viral load compared with patients with low viral load (patient-based analysis)
| Gene name | Fold change (log2) | Average expression | p-value | Adjusted p-value # |
| S | 1.916 | 8.900 | 4.54 | 2.01 |
| ORF1ab | 1.861 | 9.036 | 4.41 | 2.01 |
| CXCL10 | 1.761 | 9.153 | 5.03 | 2.24 |
| IFIT3 | 1.346 | 9.616 | 4.85 | 2.19 |
| ISG15 | 1.286 | 9.454 | 4.09 | 1.78 |
| MX1 | 1.249 | 9.748 | 5.45 | 2.48 |
| GBP1 | 1.151 | 9.005 | 8.88 | 5.61 |
| IFI6 | 1.037 | 9.913 | 3.45 | 1.43 |
| STAT1 | 0.927 | 9.820 | 4.37 | 2.01 |
| IDO1 | 0.925 | 8.539 | 3.73 | 1.58 |
| OAS3 | 0.795 | 8.783 | 4.45 | 2.01 |
| RSAD2 | 0.792 | 8.662 | 3.28 | 1.36 |
| TAP1 | 0.748 | 10.082 | 3.34 | 1.39 |
| PSMB9 | 0.725 | 9.919 | 3.78 | 1.59 |
| GBP4 | 0.677 | 9.248 | 3.84 | 1.61 |
| HERC6 | 0.627 | 8.451 | 3.20 | 1.31 |
| IFI35 | 0.485 | 9.026 | 3.34 | 1.39 |
| NR3C1 | −0.313 | 8.839 | 3.44 | 1.43 |
| ATF2 | −0.330 | 8.348 | 3.52 | 1.46 |
| SERINC3 | −0.415 | 9.130 | 3.24 | 1.33 |
| JAK1 | −0.479 | 9.550 | 3.86 | 1.61 |
| FYN | −0.518 | 8.918 | 3.60 | 1.51 |
| C4BPA | −0.728 | 8.366 | 3.61 | 1.51 |
| SERPINA1 | −1.251 | 10.750 | 3.41 | 1.42 |
Upregulated genes in high viral load compared to low viral load SARS-CoV-2 lung samples are shown in green; downregulated genes are shown in red. p-values and adjusted p-values are reported as −log10 value. #: the smallest familywise significance level for multiple comparison testing.
The above analysis assumed that every ROI derived from the same core would have the same degree of viral infection (i.e. high or low). However, viral infection is unlikely to be uniform across tissues. Indeed, none of the bronchiolar epithelial ROIs in the two viral high cores were classified as high (figure 3d, supplementary table S5). To examine the impact of this, we considered each ROI as an independent sample which was classified as either “high” (score >0) or “low” (score=0) by RNAscope positivity. By stratifying cores with this criterion and accounting for the dominant cell type as well as correlations between ROIs from the same core, we identified 33 differentially upregulated genes and 132 downregulated genes in high viral load ROIs compared to low viral load ROIs (supplementary table S8). Once again, S and ORF1ab were the most strongly upregulated genes in the high viral load group (2.415 and 2.365 log2 fold change, respectively). Other upregulated genes of note were those associated with the type I IFN response (e.g. RSAD2, OASL, TLR8, IL1RN and IKBKE), chemokines associated with IFN-γ (e.g. CXCL11, CCL8 and CCL7) and the SARS-CoV-2 receptor ACE2. A more diverse array of genes were downregulated in high viral load samples including those associated with the complement cascade (e.g. C3), ribosomal proteins (e.g. RPS6 and RPL23) and antioxidants (e.g. PRDX5) (figure 6b). Taken together, these data suggest that a pronounced type I IFN gene signature is associated with SARS-CoV-2 RNA expression and the spatial context provided by this technology enables finer details of viral load associations to be determined.
Severe COVID-19 is associated with a limited differential transcriptome when compared with severe influenza
Only a limited number of genes were identified as differentially expressed between COVID-19 and pH1N1 influenza samples (two downregulated and four upregulated genes; figure 7). Of the six genes significantly differentially regulated in COVID-19 samples, three were associated with the type I IFN response (LY6E, IFI27 and IFI6); two were heat shock protein family members (HSPA6 and HSPA1A); and one, CT45A1, when combined with various growth factors, was associated with cell survival and tumorigenesis. Interestingly, all three of the IFN-inducible genes were also significantly upregulated in COVID-19 samples compared to those without a viral infection (supplementary table S7). Two heat shock protein family members (HSPA1A and HSPA6) were also identified as significantly downregulated in COVID-19 tissues. These two genes were also significantly upregulated in pH1N1 tissues compared to uninfected tissues (supplementary figure S6), suggesting a potential influenza-specific signature. To understand the relevance of these genes to COVID-19 and pH1N1, we have compared these differentially expressed genes to other published spatial transcriptomics approaches both experimentally and analytically, and that is shown by the varying sizes of the gene sets (figure 8). It is clear that our approach is able to identify a focussed set of gene signatures specific to COVID-19 infection as compared to other studies (IFI27 and LY6E common across all studies, and IFI6 common in four out of the five studies). Together, these data indicate that fatal pH1N1 influenza virus and SARS-CoV-2 lung samples have only subtly different host transcriptomes, but may be potentially distinguished by specific gene signatures. This is further clarified in the pH1N1 versus control (supplementary figure S6) and GSEA analysis (supplementary figure S7) which shows many common activation pathways for both COVID-19 and pH1N1 infected tissue when compared to control. These data suggest that many differential expression pathways identified in the COVID-19 sample may be indicative of a more generic viral-induced ARDS, while only a limited number of differentially expressed genes may be unique to COVID-19 itself.
FIGURE 7.

Limited transcriptomic differences associated with coronavirus disease 2019 (COVID-19) infection compared with pH1N1. Distribution of differentially expressed genes as a function of the average transcript expression and fold change (log2) identified in COVID-19 samples versus pH1N1 samples were visualised with the six differentially expressed genes labelled and classified based on associated biological processes. The genes associated with the type I interferon (IFN) response, heat shock protein family members and (associated) with cell survival and tumorigenesis are shown. This exclusive list of genes reveals the subtle differences between COVID-19 and pH1N1 infected transcriptome and presents a potential disease specifc-transcriptomic signature for distinguishing the two disease types. Differential expression genes were derived using voom-limma pipeline with limma:duplicationCorrelations and applying t-tests relative to a threshold (TREAT) criteria with absolute log fold change >1.2 with p-value <0.05.
FIGURE 8.

Comparison of coronavirus disease 2019 (COVID-19)-specific gene sets identified across multiple studies. Upset plot describing the overlaps between gene sets across five different studies. The size of the gene sets varies across the studies, with the COVID-specific gene set identified in this study (COVID-19 versus pH1N1) having the smallest number of genes (n=6). Notably, IFI27 and LY6E are common across all the studies, while IFI6 is common among four out of the five studies. Studies compared include Margaroli et al. [8], Grant et al. [41], Desai et al. [42] and Butler et al. [43].
Discussion
Understanding the biological functions, networks and host–pathogen interactions that impact organ and disease development requires both cellular information and a spatial context. Analyses of bulk RNA sequencing or single-cell RNA sequencing provides a global overview of an organ's response to a pathogen, typically identifying broad inflammatory pathways. However, such approaches fail to identify subtle individual cellular changes that are spatially distinct. This has particular impact when considering innate and adaptive immune cells that may be crucial for understanding pathogen-specific responses, and to distinguish the profile of one pathogen from another. In contrast, spatially resolved transcriptomes of virally infected tissues offer the possibility of disentangling the individual infected cells, contributions of viral load, cellular responses and hence patient-to-patient variability.
The clinical spectrum of COVID-19 is highly variable. Association of viral load with disease severity would provide a mechanism for early stratification of patients for treatment options. Indeed, analyses of nasopharyngeal swabs suggests that nasopharyngeal SARS-CoV-2 RNA is independently correlated with disease severity [29], similar to earlier observations with SARS-CoV-1 [30]. However, the association between viral replication in the lung and severe disease remains more complicated. Here, we observed that eight out of 10 patients who died because of COVID-19 had no detectable viral RNA in lung biopsies as determined by RNAscope. While this rate of viral RNA detection may be lower than expected, it is important to recognise that viral antigen deposition in the lung is heterogeneous, and therefore these data may simply reflect random sample selection. There was no notable difference in time from admission to death in patients who were positive versus those who were negative by viral RNAscope. However, we do not have information for these patients on time between symptom onset and hospital admission, which may have influenced viral clearance. Nevertheless, it is important to note that all patients in this study were PCR-positive for SARS-CoV-2 RNA via nasopharyngeal swab. Therefore, if the absence of viral RNA in the lungs of eight patients reflects viral clearance, this was restricted to the lower respiratory tract.
Transcriptomic analysis showed that areas of high viral load were associated with a pronounced type I IFN response, consistent with other preliminary spatial analysis of the lungs of COVID-19 patients [13] and assumedly due to increased viral pathogen-associated molecular patterns available for type I IFN stimulation. Nevertheless, even in samples where no viral RNA was detected, a pronounced type I IFN gene signature could still be observed in the pulmonary tissue. These observations add weight to the growing understanding of the role of type I IFNs in SARS-CoV-2 infections [31]. Recent findings in a COVID-19 tissue atlas study found upregulation of IFN-α and IFN-γ response genes and oxidative phosphorylation pathways in the lungs of COVID-19 patients versus controls [32]. Current evidence suggests that an early and robust induction of type I interferons can help control viral replication and help ensure a mild infection. In contrast, a delayed induction of type I IFN (i.e. after the peak of viral replication) is largely irrelevant for viral control, as viral titres have already declined at this point in the infection, but may help perpetuate the detrimental pro-inflammatory response and lung damage [31, 33]. The transcriptomic data presented here thus speak to the potential dual-role of type I IFNs in SARS-CoV-2 infection.
Pulmonary transcriptomic analysis is a powerful tool to delineate the pathogenesis of SARS-CoV-2 and identify how it differs compared to other respiratory pathogens such as influenza virus. Previous studies have suggested that the lungs of COVID-19 patients display an increased incidence of alveolar capillary microthrombi and thrombosis with microangiopathy compared to those of influenza patients [5]. Consistent with these observations, an earlier report using bulk lung RNA analyses to identify 69 differentially expressed angiogenesis-related genes in COVID-19 patients, but not in influenza patients [13]. In the present study, we observed that both COVID-19 and influenza patients had an upregulation of genes associated with coagulation and angiogenesis, these genes were not differentially expressed between the two virus-infected patient groups. These contrasting data most likely reflect the fact that all samples in the present study were collected at the end stage of disease and accordingly, it was not possible to examine earlier differences in influenza and COVID-19 disease pathogenesis and severity. However, these data do highlight both the difficulties and importance of finding specific biomarkers that are sensitive enough to differentiate COVID-19 from other respiratory viral infections, even at end-stage disease.
Several potential clinical and transcriptional biomarkers for triaging patients with COVID-19 have been explored. Clinical biomarkers include C-reactive protein, serum amyloid A, IL-6, lactate dehydrogenase, neutrophil-to-lymphocyte ratio, D-dimer, lymphocytes and platelet count [34, 35]. However, the majority of these studies have focused on biomarkers in patient blood. While peripheral blood samples are a convenient and highly accessible site for clinical sampling, a biomarker that could be rapidly identified in the respiratory tissue (e.g. via a nasal swab) may be more accessible in low-resource settings. IFI27 levels in the blood have been previously identified to have 88% diagnostic accuracy (AUC) and 90% specificity in discriminating between influenza and bacterial infections in patients [36]. Interestingly, previous analyses of IFI27 in the blood of COVID-19 patients revealed that IFI27 was upregulated in SARS-CoV-2 infection [37–39]. Here, we identified IFI27 as differentiated and upregulated in the lungs of both COVID-19 patients versus control patients and in the highly restricted set of genes differentially expressed between COVID-19 and influenza patients. These data raise the exciting possibility that IFI27 may not only represent a biomarker for severe COVID-19, but that it may also help differentiate this disease from other clinically similar viral infections. This becomes particularly important as the “second wave” of COVID-19 in the United States and Europe is set to overlap with the winter influenza season. Validation of this gene in nasal specimens, as well as associations with disease severity will be required to confirm IFI27 as a gene signature that is useful in stratifying COVID-19 patients.
This study was subject to several important limitations. Firstly, all data were derived from a small sample cohort derived from a single study site, including unbalanced patient versus control groups, and it remains to be determined how much these data can be extrapolated to other patient populations. Importantly, future studies with a larger number of patients should include an equal number of males and females, as male sex is independently associated with increased COVID-19 severity [40]. Furthermore, additional studies are required across a broader range of patients (i.e. those with mild and moderate disease) to determine the therapeutic value of measuring IFI27 levels during infection. Moreover, there have been rapid advances using antibody guided ROI capture, whole transcriptome assays, and cellular deconvolution to infer cell types. However, despite these limitations, these data reveal the unprecedented power of spatial profiling combined with detailed multiparameter bioinformatic analyses to dissect the key variables that contribute to differential gene expression across highly variable patient cohorts and the heterogeneous distribution of virus and immune responsiveness within tissues.
Supplementary material
Please note: supplementary material is not edited by the Editorial Office, and is uploaded as it has been supplied by the author.
Supplementary tables ERJ-01881-2021.Tables (1.2MB, pdf)
Supplementary figures ERJ-01881-2021.Figures (16.7MB, pdf)
Shareable PDF
Acknowledgements
We thank Stephanie Weaver and Miki Haraguchi (Fred Hutch Experimental Histopathology Department, Seattle, WA, USA), Liuliu Pan and Andy Nam (NanoString Technologies, Seattle), Ilaria Stefani (University of Queensland Diamantina Institute Translational Innate Immunology Group, Brisbane, Australia) and Gordon Smyth (Walter and Eliza Hall Institute of Medical Research, Melbourne, Australia). This research was carried out at the Translational Research Institute, Woolloongabba, Queensland, Australia. The Translational Research Institute is supported by a grant from the Australian Government. We thank the patients and their families who made this study possible.
Footnotes
This article has supplementary material available from erj.ersjournals.com
Data and materials availability: NanoString data that support the findings of this study will be deposited with the Gene Expression Omnibus (GEO) repository and made available on publication. All the data to evaluate the conclusions in this paper are present either in the main text or in supplementary materials.
Author contributions: A. Kulasinghe, F. Souza-Fonseca-Guimaraes, K.R. Short, G.T. Belz and K. O'Byrne conceived of the study. A. Kulasinghe, A.F. Ribeiro dos Santos Miggiolaro, J. Monkman, J.d.S. Motta Junior, C. Busatta Vaz de Paula, S. Nagashima, C.P. Baena, P. Souza-Fonseca-Guimaraes, L. de Noronha, C. Cooper, T. McCulloch and G.R. Rossi performed the experimentation. A. Kulasinghe, C.W. Tan, D.D. Bhuva, J. Monkman, C. Cooper, B. Tang, K.R. Short, M.J. Davis, F. Souza-Fonseca-Guimaraes and G.T. Belz performed the data analysis and interpretation. All authors critically reviewed and approved the manuscript prior to submission.
Conflict of interest: Fernando Souza-Fonseca-Guimaraes is a consultant for Biotheus Inc. However, all opinions and reviews presented in this manuscript belong to the authors alone and are independent of the relationships with Biotheus. All other authors declare no competing interests.
Support statement: This work was supported by grants and fellowships from the National Health and Medical Research Council (NHMRC) of Australia (1157741 A. Kulasinghe; 1135898 G.T. Belz, 1140406 F. Souza-Fonseca-Guimaraes), Priority driven Collaborative Cancer Research Scheme, funded by Cure Cancer Australia with the assistance of Cancer Australia and the Can Too Foundation (1182179 A. Kulasinghe; 1158085 F. Souza-Fonseca-Guimaraes), Princess Alexandra Research Foundation (K. O'Byrne), University of Queensland (G.T. Belz, F. Souza-Fonseca-Guimaraes), Queensland University of Technology (A. Kulasinghe), The Garnett Passe and Rodney Williams Memorial Foundation (A. Kulasinghe), Walter and Eliza Hall Institute of Medical Research (C.W. Tan, D.D. Bhuva and M.J. Davis). M.J. Davis is supported by the Betty Smyth Centenary Fellowship in Bioinformatics. D.D. Bhuva is supported by a Chan Zuckerberg Initiative Program grant awarded to G. Smyth. Funding information for this article has been deposited with the Crossref Funder Registry.
References
- 1.World Health Organization . WHO Coronavirus Disease (COVID-19) Dashboard. 2020. https://covid19.who.int/
- 2.Grasselli G, Tonetti T, Protti A, et al. Pathophysiology of COVID-19-associated acute respiratory distress syndrome: a multicentre prospective observational study. Lancet Respir Med 2020; 8: 1201–1208. doi: 10.1016/S2213-2600(20)30370-2 [DOI] [PMC free article] [PubMed] [Google Scholar]
- 3.Gibson PG, Qin L, Puah SH. COVID-19 acute respiratory distress syndrome (ARDS): clinical features and differences from typical pre-COVID-19 ARDS. Med J Aust 2020; 213: 54–56. doi: 10.5694/mja2.50674 [DOI] [PMC free article] [PubMed] [Google Scholar]
- 4.Short KR, Kroeze EJBV, Fouchier RAM, et al. Pathogenesis of influenza-induced acute respiratory distress syndrome. Lancet Infect Dis 2014; 14: 57–69. doi: 10.1016/S1473-3099(13)70286-X [DOI] [PubMed] [Google Scholar]
- 5.Ackermann M, Verleden SE, Kuehnel M, et al. Pulmonary vascular endothelialitis, thrombosis, and angiogenesis in Covid-19. N Engl J Med 2020; 383: 120–128. doi: 10.1056/NEJMoa2015432 [DOI] [PMC free article] [PubMed] [Google Scholar]
- 6.Xiong Y, Liu Y, Cao L, et al. Transcriptomic characteristics of bronchoalveolar lavage fluid and peripheral blood mononuclear cells in COVID-19 patients. Emerg Microbes Infect 2020; 9: 761–770. doi: 10.1080/22221751.2020.1747363 [DOI] [PMC free article] [PubMed] [Google Scholar]
- 7.Blanco-Melo D, Nilsson-Payant BE, Liu W-C, et al. Imbalanced host response to SARS-CoV-2 drives development of COVID-19. Cell 2020; 181: 1036–1045. doi: 10.1016/j.cell.2020.04.026 [DOI] [PMC free article] [PubMed] [Google Scholar]
- 8.Margaroli C, Benson P, Sharma N, et al. Spatial mapping of SARS-CoV-2 and H1N1 lung injury identifies differential transcriptional signatures. Cell Rep Med 2021; 2: 100242. doi: 10.1016/j.xcrm.2021.100242 [DOI] [PMC free article] [PubMed] [Google Scholar]
- 9.Nienhold R, Ciani Y, Koelzer VH, et al. Two distinct immunopathological profiles in autopsy lungs of COVID-19. Nat Commun 2020; 11: 5086. doi: 10.1038/s41467-020-18854-2 [DOI] [PMC free article] [PubMed] [Google Scholar]
- 10.Staines HM, Kirwan DE, Clark DJ, et al. Dynamics of IgG seroconversion and pathophysiology of COVID-19 infections. medRxiv 2020; preprint [ 10.1101/2020.06.07.20124636]. [DOI] [Google Scholar]
- 11.Merritt CR, Ong GT, Church SE, et al. Multiplex digital spatial profiling of proteins and RNA in fixed tissue. Nat Biotechnol 2020; 38: 586–599. doi: 10.1038/s41587-020-0472-9 [DOI] [PubMed] [Google Scholar]
- 12.Monkman J, Taheri T, Ebrahimi Warkiani M, et al. High-plex and high-throughput digital spatial profiling of non-small-cell lung cancer (NSCLC). Cancers 2020; 12: 3551. doi: 10.3390/cancers12123551 [DOI] [PMC free article] [PubMed] [Google Scholar]
- 13.Desai N, Neyaz A, Szabolcs A, et al. Temporal and spatial heterogeneity of host response to SARS-CoV-2 pulmonary infection. Nat Commun 2020; 11: 6319. doi: 10.1038/s41467-020-20139-7 [DOI] [PMC free article] [PubMed] [Google Scholar]
- 14.Gandolfo LC, Speed TP. RLE plots: visualizing unwanted variation in high dimensional data. PLoS One 2018; 13: e0191629. doi: 10.1371/journal.pone.0191629 [DOI] [PMC free article] [PubMed] [Google Scholar]
- 15.Robinson MD, Oshlack A. A scaling normalization method for differential expression analysis of RNA-seq data. Genome Biol 2010; 11: R25. doi: 10.1186/gb-2010-11-3-r25 [DOI] [PMC free article] [PubMed] [Google Scholar]
- 16.McCarthy DJ, Chen Y, Smyth GK. Differential expression analysis of multifactor RNA-Seq experiments with respect to biological variation. Nucleic Acids Res 2012; 40: 4288–4297. doi: 10.1093/nar/gks042 [DOI] [PMC free article] [PubMed] [Google Scholar]
- 17.Robinson MD, McCarthy DJ, Smyth GK. edgeR: a Bioconductor package for differential expression analysis of digital gene expression data. Bioinformatics 2010; 26: 139–140. doi: 10.1093/bioinformatics/btp616 [DOI] [PMC free article] [PubMed] [Google Scholar]
- 18.Ritchie ME, Phipson B, Wu D, et al. limma powers differential expression analyses for RNA-sequencing and microarray studies. Nucleic Acids Res 2015; 43: e47. doi: 10.1093/nar/gkv007 [DOI] [PMC free article] [PubMed] [Google Scholar]
- 19.Smyth GK, Michaud J, Scott HS. Use of within-array replicate spots for assessing differential expression in microarray experiments. Bioinformatics 2005; 21: 2067–2075. doi: 10.1093/bioinformatics/bti270 [DOI] [PubMed] [Google Scholar]
- 20.Law CW, Chen Y, Shi W, et al. voom: precision weights unlock linear model analysis tools for RNA-seq read counts. Genome Biol 2014; 15: R29. doi: 10.1186/gb-2014-15-2-r29 [DOI] [PMC free article] [PubMed] [Google Scholar]
- 21.McCarthy DJ, Smyth GK. Testing significance relative to a fold-change threshold is a TREAT. Bioinformatics 2009; 25: 765–771. doi: 10.1093/bioinformatics/btp053 [DOI] [PMC free article] [PubMed] [Google Scholar]
- 22.Subramanian A, Tamayo P, Mootha VK, et al. Gene set enrichment analysis: a knowledge-based approach for interpreting genome-wide expression profiles. Proc Natl Acad Sci USA 2005; 102: 15545–15550. doi: 10.1073/pnas.0506580102 [DOI] [PMC free article] [PubMed] [Google Scholar]
- 23.Liberzon A, Birger C, Thorvaldsdóttir H, et al. The Molecular Signatures Database (MSigDB) hallmark gene set collection. Cell Syst 2015; 1: 417–425. doi: 10.1016/j.cels.2015.12.004 [DOI] [PMC free article] [PubMed] [Google Scholar]
- 24.Radzikowska U, Ding M, Tan G, et al. Distribution of ACE2, CD147, CD26, and other SARS-CoV-2 associated molecules in tissues and immune cells in health and in asthma, COPD, obesity, hypertension, and COVID-19 risk factors. Allergy 2020; 75: 2829–2845. doi: 10.1101/2020.05.14.090332 [DOI] [PMC free article] [PubMed] [Google Scholar]
- 25.Carvelli J, Demaria O, Vély F, et al. Association of COVID-19 inflammation with activation of the C5a–C5aR1 axis. Nature 2020; 588: 146–150. doi: 10.1038/s41586-020-2600-6 [DOI] [PMC free article] [PubMed] [Google Scholar]
- 26.Shi W, Lv J, Lin L. Coagulopathy in COVID-19: focus on vascular thrombotic events. J Mol Cell Cardiol 2020; 146: 32–40. doi: 10.1016/j.yjmcc.2020.07.003 [DOI] [PMC free article] [PubMed] [Google Scholar]
- 27.Israelow B, Song E, Mao T, et al. Mouse model of SARS-CoV-2 reveals inflammatory role of type I interferon signaling. J Exp Med 2020; 217: e20201241. doi: 10.1084/jem.20201241 [DOI] [PMC free article] [PubMed] [Google Scholar]
- 28.Liu T, Jia P, Fang B, et al. Differential expression of viral transcripts from single-cell RNA sequencing of moderate and severe COVID-19 patients and its implications for case severity. Front Microbiol 2020; 11: 603509. doi: 10.3389/fmicb.2020.603509 [DOI] [PMC free article] [PubMed] [Google Scholar]
- 29.Pujadas E, Chaudhry F, McBride R, et al. SARS-CoV-2 viral load predicts COVID-19 mortality. Lancet Respir Med 2020; 8: e70. doi: 10.1016/S2213-2600(20)30354-4 [DOI] [PMC free article] [PubMed] [Google Scholar]
- 30.Giannis D, Ziogas IA, Gianni P. Coagulation disorders in coronavirus infected patients: COVID-19, SARS-CoV-1, MERS-CoV and lessons from the past. J Clin Virol 2020; 127: 104362. doi: 10.1016/j.jcv.2020.104362 [DOI] [PMC free article] [PubMed] [Google Scholar]
- 31.Park A, Iwasaki A. Type I and type III interferons – induction, signaling, evasion, and application to combat COVID-19. Cell Host Microbe 2020; 27: 870–878. doi: 10.1016/j.chom.2020.05.008 [DOI] [PMC free article] [PubMed] [Google Scholar]
- 32.Delorey TM, Ziegler CGK, Heimberg G, et al. COVID-19 tissue atlases reveal SARS-CoV-2 pathology and cellular targets. Nature 2021; 595: 107–113. doi: 10.1038/s41586-021-03570-8 [DOI] [PMC free article] [PubMed] [Google Scholar]
- 33.Lee JS, Shin EC. The type I interferon response in COVID-19: implications for treatment. Nat Rev Immunol 2020; 20: 585–586. doi: 10.1038/s41577-020-00429-3 [DOI] [PMC free article] [PubMed] [Google Scholar]
- 34.Kermali M, Khalsa RK, Pillai K, et al. The role of biomarkers in diagnosis of COVID-19 – a systematic review. Life Sci 2020; 254: 117788. doi: 10.1016/j.lfs.2020.117788 [DOI] [PMC free article] [PubMed] [Google Scholar]
- 35.Malik P, Patel U, Mehta D, et al. Biomarkers and outcomes of COVID-19 hospitalisations: systematic review and meta-analysis. BMJ Evid Based Med 2021; 26: 107–108. doi: 10.1136/bmjebm-2020-111536 [DOI] [PMC free article] [PubMed] [Google Scholar]
- 36.Tang BM, Shojaei M, Parnell GP, et al. A novel immune biomarker IFI27 discriminates between influenza and bacteria in patients with suspected respiratory infection. Eur Respir J 2017; 49: 1602098. doi: 10.1183/13993003.02098-2016 [DOI] [PubMed] [Google Scholar]
- 37.Xu G, Qi F, Li H, et al. The differential immune responses to COVID-19 in peripheral and lung revealed by single-cell RNA sequencing. Cell Discov 2020; 6: 73. doi: 10.1038/s41421-020-00225-2 [DOI] [PMC free article] [PubMed] [Google Scholar]
- 38.Wilk AJ, Rustagi A, Zhao NQ, et al. A single-cell atlas of the peripheral immune response in patients with severe COVID-19. Nat Med 2020; 26: 1070–1076. doi: 10.1038/s41591-020-0944-y [DOI] [PMC free article] [PubMed] [Google Scholar]
- 39.Arunachalam PS, Wimmers F, Mok CKP, et al. Systems biological assessment of immunity to mild versus severe COVID-19 infection in humans. Science 2020; 369: 1210–1220. doi: 10.1126/science.abc6261 [DOI] [PMC free article] [PubMed] [Google Scholar]
- 40.Longmore DK, Miller JE, Bekkering S, et al. Diabetes and overweight/obesity are independent, nonadditive risk factors for in-hospital severity of COVID-19: an international, multicenter retrospective meta-analysis. Diabetes Care 2021; 44: 1281–1290. [DOI] [PMC free article] [PubMed] [Google Scholar]
- 41.Grant RA, Morales-Nebreda L, Markov NS, et al. Circuits between infected macrophages and T cells in SARS-CoV-2 pneumonia. Nature 2021; 590: 635–641. doi: 10.1038/s41586-020-03148-w [DOI] [PMC free article] [PubMed] [Google Scholar]
- 42.Desai N, Neyaz A, Szabolcs A, et al. Temporal and spatial heterogeneity of host response to SARS-CoV-2 pulmonary infection. Nat Commun 2020: 11: 6319. doi: 10.1038/s41467-020-20139-7 [DOI] [PMC free article] [PubMed] [Google Scholar]
- 43.Butler D, Mozsary C, Meydan C, et al. Shotgun transcriptome, spatial omics, and isothermal profiling of SARS-CoV-2 infection reveals unique host responses, viral diversification, and drug interactions. Nat Commun 2021: 12: 1660. doi: 10.1038/s41467-021-21361-7 [DOI] [PMC free article] [PubMed] [Google Scholar]
Associated Data
This section collects any data citations, data availability statements, or supplementary materials included in this article.
Supplementary Materials
Please note: supplementary material is not edited by the Editorial Office, and is uploaded as it has been supplied by the author.
Supplementary tables ERJ-01881-2021.Tables (1.2MB, pdf)
Supplementary figures ERJ-01881-2021.Figures (16.7MB, pdf)
This one-page PDF can be shared freely online.
Shareable PDF ERJ-01881-2021.Shareable (1MB, pdf)