

Abstract
Purpose
Leber's hereditary optic neuropathy (LHON) is the most common mtDNA optic neuropathy. It most frequently causes dense bilateral central scotomas that are often characterized in clinical studies by Humphrey visual field testing (HVF) using a stimulus size III. This provides numerical quantification of the visual field defect using the mean deviation. However, this size III testing strategy has limitations. We used stimulus size V to monitor these patients and evaluated intertest variability and dynamic range to determine the testing reliability and reproducibility.
Methods
This was a longitudinal retrospective cohort study comparing Stimulus III and Stimulus V HVF of 62 LHON patients who had reached the plateau stage of the disease. The intertest variability and mean defect were calculated for both stimulus sizes for 38 patients. The mean defect for stimulus size V was calculated using an algorithm developed by the University of Iowa Visual Field Reading Center.
Results
Stimulus size V HVFs had lower inter-test variability as measured by mean defect standard deviation (Z = 169, P < 0.01). The floor effect seen with Stimulus III HVF in LHON, was less pronounced with Stimulus V HVF. The correlation of stimulus size III and V mean defect was strong (r = 0.90, P < 0.01), and a mathematical model was constructed to calculate the Stimulus size V mean defect from the Stimulus size III results (MDstimV = 0.988 x MDStimIII + 1.35, R2 = 0.82 P < 0.01).
Conclusions
Stimulus size V HVF had lower intertest variability and a better dynamic range than Stimulus size III HVF in LHON patients. This makes the stimulus V HVF a more reliable metric to follow LHON patients especially in clinical trials. The mathematical model presented can be used to generate a Stimulus V equivalent mean defect from Stimulus III HVFs.
Translational Relevance
Using Stimulus V HVF in LHON patients increases its ability to detect and quantify a response to treatment, making it a useful metric for future LHON clinical trials and the clinical setting.
Keywords: Leber's hereditary optic neuropathy, visual field, clinical course, diagnosis, mathematical model
Introduction
Leber's hereditary optic neuropathy (LHON) is the most common inherited mitochondrial disease affecting around affecting 3.5–12 per 100.000.1–5 More than 90% of all LHON cases are associated with three primary mitochondrial mutations: mt.11778, mt.11484, and mt.3460, although more than 45 mutations have been described to date.6–8 Conversion from carrier to the affected state can occur and usually leads to dense bilateral central scotomas.8–10
Initially, the cecocentral scotoma may present as a mild central depression.10 However, in subsequent weeks the scotoma often enlarges and becomes denser.10 Studies using manual and semiautomated kinetic perimetry have demonstrated that the visual field defect in LHON is usually located in the central 20° of vision and almost never encompasses less than the central 10°.11,12 The visual field defect parallels the visual acuity decline as it becomes progressively more dense centrally, plateauing at about eight months after the initiation of symptoms.10,13,14
Currently, the most common visual field test used to test these patients is the Humphrey visual field analyzer (HVF) with a 24-2 or 30-2 SITA strategy using a Goldmann stimulus size III test point (Stim III).15 The mean deviation is a common metric to characterize the visual loss in Leber's patients. The mean deviation is average age-corrected visual loss per test location weighted for intrasubject and intersubject variability related to eccentricity. The mean defect is simply the average total deviation loss across the visual field and may be problematic when there is central visual loss because, with visual loss, test locations have higher variability.
Overall though, the differences between the mean deviation and mean defect are minimal.16 In LHON, the mean deviation is often at the bottom end of the scale, <−30 dB.10,14,17 This limits the dynamic range of the test leading to a floor effect as the patient becomes unable to perceive the small size III stimulus.6,10,18,19 The dynamic range of the visual field is defined as the range between the smallest and largest values that the device is capable of displaying.20 With a very dense scotoma, fixation losses and false-negative errors increase, making the test “unreliable,” and the mean deviation metric also becomes insensitive to change, making it difficult to track progression or improvement in the visual field deficit.21 Given that the device becomes insensitive to the small changes in the “unreliable” conditions, the range between the smallest and largest values collapses, flattering the dynamic range.22
These factors make it problematic for the interpretation of visual field change in patients with LHON and dense central scotomas, and for clinical studies of LHON. Other strategies have been described, particularly in the field of glaucoma, for testing patients with low vision. One of these strategies is to increase the size of the stimulus.20,21 We propose that using the Goldmann stimulus size V (Stim V) could increase the dynamic range and decrease the floor effect seen with Stim III HVF tests in LHON patients that have reached the plateau stage of the disease. To evaluate the utility of Stim V testing in LHON, we determined the intertest variability for both Stim V and Stim III HVFs for LHON patients in the plateau stage of the disease. We also calculated the Stim III and Stim V mean defect using a large normative database and an algorithm developed by the University of Iowa Visual Field Reading Center (IOWA). This study followed the STROBE guidelines for cohort study reports.23
Objectives
We wanted to describe the variability of chronic central scotomas in LHON patients that reach the plateau stage using Stim III and Stim V HVF by comparing the retest variabilities of the two stimulus sizes and to demonstrate the relationship of Stim III and Stim V results and establish a formula to calculate Stimulus V mean defect from the Stimulus III results.
Methods
We conducted a longitudinal retrospective cohort study of patients with LHON. All patients were followed at the Doheny Eye Institute of the University of California, Los Angeles, between July of 2014 and September of 2019. Authorization of the University of California, Los Angeles, Institutional Review Board was obtained (18-000138). All data use followed the Declaration of Helsinki for medical research with human subjects and the Health Insurance Portability and Accountability Act (1996).
Patients with vision loss and a genetically confirmed primary LHON mutation, and no other identifiable cause of vision loss, were included in this study. All patients were taking idebenone for the duration of the study in concert with consensus.24 Patients with other ocular or neurological diagnoses or other causes of vision loss were excluded. Likewise, patients taking medical treatments for LHON besides idebenone or involved in clinical trials for LHON were excluded.
All subjects had reached the plateau stage of the disease, which was defined as the point where there was no further decline in visual acuity, HVF, and Optical Coherence Tomography (OCT), as previously published elsewere.10 Patients who were experiencing recovery of vision, defined as a clinically meaningful improvement in vision, were also excluded from this study.
All patients underwent bilateral visual field examination with a 30-2 SITA-FAST strategy (Humphrey Visual Field Analyzer II, Carl Zeiss, Dublin, CA, USA) with white Stim III (0.438 diameter, 4 mm2). Because there is no SITA program for Stim V (1.728 diameter, 64 mm2), a full threshold strategy was used. The worse eye was chosen, and the same eye was followed up over time. All tests were performed by a trained technician or a physician. The reliability of the VHF results was evaluated by a senior physician, and reliable tests were included. The mean deviation and mean defect were computed for each Stim III test. The mean defect for the Stim V tests was calculated with the algorithm developed by IOWA. The IOWA mean defect is an average of the total deviations. Unlike the HVF mean deviation, it is not centrally weighted. The description of the algorithm has been published previously.25,26
Variables
-
•
Mean deviation with Stim III in dB
-
•
Mean defect with Stim V calculated by the IOWA algorithm in dB
-
•
Mean defect with Stim III calculated by the IOWA algorithm in dB
Statistical Analysis
Statistical analysis was performed with Stata data analysis software v.12.0. A power of 80% and an alpha of 95% were used to determine statistical significance.
Descriptive data were obtained for all variables. Data normality was tested with the Shapiro-Wilk normality test. A comparison of the measured Stim III mean deviation and the Stim III mean defect calculated with the IOWA algorithm was performed with a Pearson correlation coefficient to establish the permutability of the measured data with the calculated data for all patients. Intertest variability was calculated for patients who had more than two Stim III and two Stim V tests. A Wilcoxon signed rank test was performed to compare the intertest variability of the Stim III tests against the inter-test variability of the Stim V tests. Both the standard deviation and the range of variability were calculated. An analysis of variance test and a single variable linear regression model were then calculated for the prognostic value of the measured Stim III mean defect to predict the Stim V mean defect.
Results
Seventy-five LHON patients had a Stim III and/or a Stim V HVF. Of those, 62 patients had reached the plateau stage (Fig. 1). The demographic characteristics of the 62 patients are summarized in the Table. As expected, all variables failed the Shapiro-Wilk normality test, suggesting a non-normal distribution. The 62 patients had 381 Stim III tests, with a median Stim III mean deviation of −14.35 dB (95% confidence interval [CI] −15.35 to 113.35) The median IOWA Stim III mean defect was −15.5 dB (95% CI −16.55 to 14.45), and 231 Stim V tests with a median IOWA Stim V mean defect of −14.31 dB (95% CI −15.72 to 12.89).
Figure 1.

Patient flowchart.
Table.
Demographic Characteristics
| Mean Age at Nadir (Years ± SD) | 29.7 ± 13.67 |
| Gender (F/M) | 7:31 |
| Mutation | |
| mt.11778 | 33 |
| mt.14484 | 3 |
| mt.3460 | 2 |
| Mean visual acuity in at nadir (LogMar ± SD) | 1.41 ± 0.28 |
| Mean time between diagnosis and plateau stage (months ± SD) | 10 .52 ± 2.36 |
There was a strong permutability between the measured Stim III mean deviation and the IOWA Stim III mean defect (Pearson's test r = 0.99, P = <0.01) (Fig. 2).
Figure 2.

Stim III mean defect Permutability. Stim III mean deviation: Stim III mean defect in decibels in absolute values. Dispersion graph demonstrating a linear relationship between the measured and the calculated Stim III mean defect. This relationship has a Pearson's test r = 0.99, P < 0.01.
Intertest Variability
Twenty-four patients had only one Stim V test and were excluded from further analysis. The intertest variability for the remaining 38 patients (31 male and seven female) Stim III is reported in Figure 3. Each patient had on average of 6.84 (range 4–16) Stim III HVF tests. The mean standard deviation (SD) was −3.18 dB (95% CI −4.26 to 2.11). The average range of mean defect was −7.36 dB (95% CI −9.34 to 4.73), with a maximal range in one individual subject of 30.37 dB. Subjects with mean defect closer to 0 or under −25 dB had less intertest variability.
Figure 3.

Box-Plot of Stim III mean defect and Stim V mean defect intertest variability. The box-plot illustrates the inter-test variability of the Stim III (in dark gray) and Stim V (light gray) mean defect (MD) for each individual subject in decibels (dB). Large inter-test variability is seen in the Stim III MD, both with multiple outlier measurements and large interquartile ranges. It is noticeable that the subjects with mean defect <−25 dB showed less intertest variability. This is described as the floor effect of the Stim III. The intertest variability for Stim V is smaller than the Stim III MD. Fewer outlier measurements were noted, and the interquartile range is smaller with Stim V for the majority of patients. The floor effect is also less pronounced with Stim V.
Intertest variability of the IOWA Stim V mean defect is reported in Figure 3. Each patient had on average of 4.58 (range 4–12) Stim V HVF tests. The mean SD was −2.54 dB (95% CI [−3.47 −1.61]). The average range of mean defect was −5.17 dB (95% CI − 6.79 to 3.54), with a maximal range in one individual subject of 20.87 dB.
Because of the non-normal distribution, a Wilcoxon matched pair signed ranked test was performed for the difference between the measured Stim III mean deviation and the IOWA Stim V mean defect. The test demonstrated a statistically significant lower inter-test variability for the standard deviation of IOWA Stim V mean defects, when compared to the inter-test variability of the standard deviation of measured Stim III mean deviation (Z = 169, P < 0.01). A Wilcoxon matched paired signed ranked test was also calculated and found that the range of IOWA Stim V mean defect was smaller than the range of measured Stim III mean deviation in a statistically significant fashion. (Z = 253, P < 0.05)
The point-wise limits of test–retest variability were established from the empiric fifth and 95th percentiles of the distribution of retest values, and subsequently they were stratified by the value of the first test. Because empiric percentiles are difficult to estimate precisely from small samples, the retest intervals were estimated by Loess smoothing (Fig. 4). Stim V showed better repeatability, based on the narrower width of the 95th percentile confidence interval, below −25 dB. Conversely, between 0 to −10 dB Stim III responses had a lower test-retest variability compared to Stim V.
Figure 4.
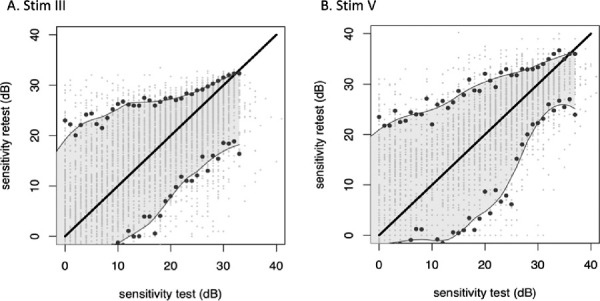
Point-wise limits of test–retest variability established from the empiric fifth and 95th percentiles of the distribution of retest values, stratified by the value of the first test. Stim III: stimulus size III- Stim V: Stimulus size V. The solid lines indicate the location of the empiric fifth and 95th percentiles. Because empiric percentiles are difficult to estimate precisely from small samples, the retest intervals were estimated by Lowess smoothing (shaded areas between the lines connecting the fifth and 95th percentiles). Individual data points are shown as scattered dots with slight jitter to improve visibility. The graphs show that Stim V appears to have substantially better repeatability on the basis of the narrower width of the 95th percentile confidence interval. To help illustrate the effect, absolute values were used to construct these graphs.
Association of Stim III Mean Defect and Stim V Mean Defect
Pearson's test of association showed a strong correlation between the IOWA Stim III mean deviation and the IOWA Stim V mean defect (r = 0.90, P < 0.01). The analysis of variance also demonstrated a significant association (analysis of variance F(1, 175) = 770.87, MSE = 14607.51, P < 0.01). A univariable linear regression model was constructed to mathematically represent the association of the IOWA Stim V mean defect and the measured Stim III mean defect. For a given Stim III mean defect, the Stim V mean defect could be predicted by the following formula: MDstimV = 0.988 × x MDStimIII + 1.35, R2 = 0.82 P < 0.01 (See Fig. 5).
Figure 5.

Linear regression scatterplot diagram for Stim V mean defect. The scatterplot diagram illustrates the linear regression model (in light gray) in relationship with the measured data (in black). The graph can be summarized by the following formula: MDstimV = 0.988 × x MDStimIII + 1.35.
Discussion
To our knowledge, this is the largest study to systematically look at mean deviation and mean defect values for patients with a dense central scotoma from LHON. We compared the mean defect from both Stim III and Stim V results for patients in the chronic phase of the disease after the visual field changes had plateaued. We were able to demonstrate that the mean defect calculated by the IOWA algorithm was similar to the mean deviation from the HVF for Stim III for this patient population. We also found that the Stim V mean defect had lower inter-test variability when compared to the Stim III and that the Stim V mean defect could be approximated by the formula MDstimV = 0.988 × x MDStimIII + 1.35.
The intertest variability of both stimulus sizes was calculated on the basis of both the SD and the absolute range of the values for each patient and the variability of the mean defect of each individual compared to the variability of the mean deviation of each individual for every test. Across all subjects, the Stim III mean deviation had significantly greater intertest variability and significantly larger SD, when compared to the Stim V mean defect results. These differences are visually apparent in the Box-plots (Figs. 3 and 4) and were statistically significant with a Wilcoxon test. Subject 19 is a good illustration of this finding because he had high test-retest variability with Stim III testing strategy (30.37 dB), and this decreased by 60% (12.14 dB) with the Stim V testing strategy (Fig. 6).
Figure 6.

Visual Field gray maps. Representative visual fields of the right eye of two patients (A and B) taken 1 year apart (1 and 2). The top row contains the gray-scale maps of the Stimulus III tests, and the bottom row has the gray-scale maps of the Stimulus V tests. The Stimulus III tests for both patients show dense central scotomas, more so for patient A. The variability in the mean defect (MD) for each test is shown below the figures. The Stimulus III tests had greater intertest variability in the MD. The stimulus V maps show less variability in the calculated MD and demonstrate peripheral sparing that is not present in the Stimulus III tests, demonstrating the better dynamic range of the Stimulus V test for patients with LHON.
We also demonstrated a larger clinically effective dynamic range with the use of Stim V when compared to Stim III. The effective dynamic range is defined as that part of the physical range that is physiologically meaningful and clinically useful.20 Although patients with low mean defects (>−25 dB) had less intertest variability with Stim III, this increase was at the end of the dynamic range of Stim III testing for patients with a dense central scotoma and represented a floor effect (because the standard deviation of 0 is 0).6,10,18,19 In comparison, the Stim V results show that patients with mean defect lower than −25 dB were able to perform the HVF with increased repeatability. Conversely between 0 and −10 dB the intertest variability with Stim III results was better than those with Stim V again likely because of a floor effect.
The present study has limitations. Our sample size, though large for LHON, was limited by the rarity of this disease. As such we were not able to prospectively test the validity of our formula in this study. Patients were evaluated and tested at multiple time points, but all patients were in the plateau stage of the disease and did not have visual changes in any other metric. This correlates with the previously described parameters for this stage of LHON10,13 Thus the variability seen in this patient cohort was not from a clinically meaningful change in the patients’ vision, but rather related to day to day fluctuations in vision and visual testing—the intertest variability. The intertest variability provides a minimal threshold before a change in mean defect would represent an improvement or a decline in vision. The use of the larger Stim V could potentially miss small changes, both improvements and worsening, as the test is a lower resolution test of the visual field. This effect should be partially negated, however, by the decreased intertest variability for Stim V testing. Also, LHON damages large nerve fiber bundles so that Stim V is used to test large areas of loss. Regardless, the improvement in retest variability of Stim V allows improved detection of visual field change. Last, the Stim V Full threshold strategy is a lengthier procedure, compared to the Stim III SITA strategy. Given that the Stim III SITA strategy has several limitations and is ineffective in the follow-up of LHON patients, the increase in test time could be balanced against the benefits of the Stim V strategy.
The increased useful dynamic range and decreased intertest variability of Stim V testing increases its ability to detect and quantify a response to treatment, making it a useful metric for future LHON clinical trials. Our formula could also be used to compare prior Stim III mean deviation values to those obtained from Stim V testing. Further studies would help validate this formula and expand the utility of Stim V testing to other disease which cause dense central scotomas.
Acknowledgments
The authors thank Shellee Rockwell, COT, at the Doheny Eye Institute for her relentless help with the visual fields and for making our research days run smoothly.
Supported by the Pan-American Ophthalmological Foundation (PAOF) and the Retina Research Foundation (RRF) (2019 Gillingham Grant). The funding bodies did not have any role in the design of the study and collection, analysis, and interpretation of data and in writing the manuscript.
Disclosure: A.J. Mejia-Vergara, None; A.A. Sadun, None; A.F. Chen, None; M.F. Smith, None; M. Wall, None; R. Karanjia, None
References
- 1. Yu-Wai-Man P, Griffiths PG, Howell N, Turnbull DM, Chinnery PF.. The epidemiology of Leber hereditary optic neuropathy in the north east of England. Am J Hum Genet. 2016; 98: 1271. [DOI] [PMC free article] [PubMed] [Google Scholar]
- 2. Schapira AH V. Mitochondrial disease. Lancet. 2006; 368(9529): 70–82. [DOI] [PubMed] [Google Scholar]
- 3. Puomila A, Hämäläinen P, Kivioja S, et al.. Epidemiology and penetrance of Leber hereditary optic neuropathy in Finland. Eur J Hum Genet. 2007; 15: 1079–1089. [DOI] [PubMed] [Google Scholar]
- 4. Ueda K, Morizane Y, Shiraga F, et al.. Nationwide epidemiological survey of Leber hereditary optic neuropathy in Japan. J Epidemiol. 2017; 27: 447–450. [DOI] [PMC free article] [PubMed] [Google Scholar]
- 5. Rosenberg T, Nørby S, Schwartz M, et al.. Prevalence and genetics of Leber hereditary optic neuropathy in the Danish population. Invest Ophthalmol Vis Sci. 2016; 57: 1370–1375. [DOI] [PubMed] [Google Scholar]
- 6. Barboni P, Carbonelli M, Savini G, et al.. Natural history of Leber's hereditary optic neuropathy: longitudinal analysis of the retinal nerve fiber layer by optical coherence tomography. Ophthalmology. 2010; 117: 623–627. [DOI] [PubMed] [Google Scholar]
- 7. Carelli V, Ross-Cisneros FN, Sadun AA.. Mitochondrial dysfunction as a cause of optic neuropathies. Prog Retin Eye Res. 2004; 23: 53–89. [DOI] [PubMed] [Google Scholar]
- 8. Poincenot L, Pearson AL, Karanjia R.. Demographics of a large international population of patients affected by Leber's hereditary optic neuropathy. Ophthalmology. 2020; 127: 679–688. [DOI] [PubMed] [Google Scholar]
- 9. Newman NJ, Lott MT, Wallace DC.. The clinical characteristics of pedigrees of Leber's hereditary optic neuropathy with the 11778 mutation. Am J Ophthalmol. 1991; 111: 750–762. [DOI] [PubMed] [Google Scholar]
- 10. Hwang TJ, Karanjia R, Moraes-Filho MN, et al.. Natural history of conversion of Leber's hereditary optic neuropathy: a prospective case series. Ophthalmology. 2017; 124: 843–850. [DOI] [PubMed] [Google Scholar]
- 11. Nowomiejska K, Kiszka A, Koman-Wierdak E, et al.. Analysis of visual field defects obtained with semiautomated kinetic perimetry in patients with Leber hereditary optic neuropathy. J Ophthalmol. 2018; 2018: 5985702. [DOI] [PMC free article] [PubMed] [Google Scholar]
- 12. Nikoskelainen EK, Huoponen K, Juvonen V, Lamminen T, Nummelin K, Savontaus ML.. Ophthalmologic findings in Leber hereditary optic neuropathy, with special reference to mtDNA mutations. Ophthalmology. 1996; 103: 504–514. [DOI] [PubMed] [Google Scholar]
- 13. Sadun F, De Negri AM, Carelli V, et al.. Ophthalmologic findings in a large pedigree of 11778/Haplogroup J Leber hereditary optic neuropathy. Am J Ophthalmol. 2004; 137: 271–277. [DOI] [PubMed] [Google Scholar]
- 14. Newman NJ, Biousse V, Newman SA, et al.. Progression of visual field defects in Leber hereditary optic neuropathy: experience of the LHON treatment trial. Am J Ophthalmol. 2006; 141: 1061–1067. [DOI] [PubMed] [Google Scholar]
- 15. Bengtsson B, Heijl A.. SITA Fast, a new rapid perimetric threshold test. Description of methods and evaluation in patients with manifest and suspect glaucoma. Acta Ophthalmol Scand. 1998; 76: 431–437. [DOI] [PubMed] [Google Scholar]
- 16. Funkhouser A, Fankhauser F.. The effects of weighting the “mean defect” visual field index according to threshold variability in the central and midperipheral visual field. Graefes Arch Clin Exp Ophthalmol. 1991; 229: 228–231. [DOI] [PubMed] [Google Scholar]
- 17. Liu HL, Yuan JJ, Tian Z, Li X, Song L, Li B.. What are the characteristics and progression of visual field defects in patients with Leber hereditary optic neuropathy: a prospective single-centre study in China. BMJ Open. 2019; 9(3): 1–6. [DOI] [PMC free article] [PubMed] [Google Scholar]
- 18. Wall M, Woodward KR, Doyle CK, Zamba G.. The effective dynamic ranges of standard automated perimetry sizes III and V and motion and matrix perimetry. Arch Ophthalmol. 2010; 128: 570–576. [DOI] [PubMed] [Google Scholar]
- 19. Gardiner SK, Swanson WH, Demirel S.. The effect of limiting the range of perimetric sensitivities on pointwise assessment of visual field progression in glaucoma. Invest Ophthalmol Vis Sci. 2016; 57: 288–294. [DOI] [PMC free article] [PubMed] [Google Scholar]
- 20. Wall M, Zamba GKD, Artes PH.. The effective dynamic ranges for glaucomatous visual field progression with standard automated perimetry and stimulus sizes III and V. Invest Ophthalmol Vis Sci. 2018; 59: 439–445. [DOI] [PMC free article] [PubMed] [Google Scholar]
- 21. Swanson WH, Horner DG, Dul MW, Malinovsky VE.. Choice of stimulus range and size can reduce test-retest variability in glaucomatous visual field defects. Transl Vis Sci Technol. 2014; 3(5): 6. [DOI] [PMC free article] [PubMed] [Google Scholar]
- 22. Gardiner SK, Demirel S, Goren D, Mansberger SL, Swanson WH.. The effect of stimulus size on the reliable stimulus range of perimetry. Transl Vis Sci Technol. 2015; 4(2): 10. [DOI] [PMC free article] [PubMed] [Google Scholar]
- 23. Von Elm E, Altman DG, Egger M, Pocock SJ, Gøtzsche PC, Vandenbroucke JP.. The Strengthening the Reporting of Observational Studies in Epidemiology (STROBE) statement: guidelines for reporting observational studies. PLoS Med. 2007; 4: 1623–1627. [DOI] [PMC free article] [PubMed] [Google Scholar]
- 24. Carelli V, Carbonelli M, de Coo IF, et al.. International Consensus Statement on the Clinical and Therapeutic Management of Leber Hereditary Optic Neuropathy. J Neuroophthalmol. 2017; 37: 371–381. [DOI] [PubMed] [Google Scholar]
- 25. Wall M, Brito CF, Woodward KR, Doyle CK, Kardon RH, Johnson CA.. Total deviation probability plots for stimulus size v perimetry: a comparison with size III stimuli. Arch Ophthalmol. 2008; 126: 473–479. [DOI] [PubMed] [Google Scholar]
- 26. Wall M, Doyle CK, Zamba KD, Artes P, Johnson CA.. The repeatability of mean defect with size III and size V standard automated perimetry. Invest Ophthalmol Vis Sci. 2013; 54: 1345–1351. [DOI] [PubMed] [Google Scholar]