

Abstract
CD40L mRNA stability is dependent on an activation-induced pathway that is mediated by the binding of RNA binding complexes containing the multifunctional RNA binding protein, polypyrimidine tract-binding protein 1 (PTBP1) to a 3’ untranslated region of the transcript. To understand the relationship between regulated CD40L expression and the requirement for variegated expression during a T-dependent (TD) response, we engineered a mouse lacking the CD40L stability element (CD40L∆5) and asked how this mutation altered multiple aspects of the humoral immunity. We found that CD40L∆5 mice expressed CD40L at 60% WT levels and lowered expression corresponded to significantly decreased levels of TD antibodies, loss of germinal center (GC) B cells and a disorganized GC structure. Gene expression analysis of B cells from CD40L∆5 mice revealed that genes associated with cell cycle and DNA replication were significantly downregulated and genes linked to apoptosis highly upregulated. Importantly, somatic hypermutation was relatively unaffected although the number of cells expressing high affinity antibodies was greatly reduced. Importantly, a significant loss of plasmablasts and early memory B precursors as a percentage of total GL7+ B cells was observed indicating that differentiation cues leading to the development of post-GC subsets was highly dependent on a threshold level of CD40L dependent on mRNA stability. Thus, regulated mRNA stability plays an integral role in the optimization of humoral immunity by allowing for a dynamic level of CD40L expression on CD4 T cells that results in the proliferation and differentiation of pre-GC and GC B cells into functional subsets.
Introduction
At early time points in an immune response CD40/CD40L engagement leads to the rapid proliferation and differentiation of antigen (Ag)-selected B cells into short-lived extrafollicular plasmablasts or founder cells that seed germinal centers (GCs) (1–4). Importantly, enhanced CD40 signaling at this early stage of the response results in a preferential shift towards plasmablast differentiation and limits B cell entrance into the follicles (5–8). CXCR5+ T cells that preferentially help B cells produce antibodies can be visualized using intravital two-photon imaging as early T follicular helper cell (TFH)-B cell interactions at the border of the B cell follicles (9–11). The TFH cells require BCL-6 and are physically located in the follicle and germinal center (GC) where they are critical for establishing GCs, selecting high affinity B cells and modulating the differentiation of cells into plasma and memory subsets (12). These GC processes are highly dependent on the dynamic signaling between CD40L and CD40 that may flux in amplitude and duration throughout the course of the response (13). Delivering sufficient levels of CD40L to antigen-selected B cells is carried out by long-lived immunological synapses of T-B interactions at the T zone-follicle border allowing the B cells to expand and form GCs. In contrast, T-B interactions inside GCs are of relatively short duration with a few isolated cases of extended contact (2, 14, 15). In addition, the quality of TFH cognate signals received by GC B cells has been shown to lead to the upregulation of ICOSL through a CD40-dependent pathway and this upregulation is critical for enhancing GC B cell-TFH interactions (15).
The histological division of the GC into a dark zone (DZ) and light zone (LZ) reflects a partial compartmentalization of B cell function where proliferation and somatic hypermutation (SHM) primarily occur in the DZ and selection of high affinity variants takes place in the LZ (16, 17). LZ B cells with improved antigen binding express a high density of MHC II/peptide resulting in increased fitness to compete for limited CD40L helper function (18–20). Once selected, LZ B cells eventually proceed down differentiation pathways leading to short-lived antibody secreting cells (ASCs), resting memory B cells, or plasma cells (21). Alternatively, cells can return to the DZ for additional rounds of proliferation and SHM. Together these findings shed light on the criticality of CD40-CD40L interactions for B cell fate decisions at both the onset and later checkpoints of the reaction, which is reinforced by the phenotype of mice with targeted deletions of CD40L and human hyper-IgM patients with genetic loss of function mutations in CD40L (5, 14, 16, 18, 19, 22–24). The importance of context-specific bi-directional signaling between GC B cells and T cells to collectively shape the quality of a GC response is evident. However, our understanding of pathways that regulate the expression of CD40L throughout the course of a GC response is limited.
It has previously shown that CD40L mRNA expression in CD4 T cells is dynamically regulated by an activation-induced process of mRNA stability mediated by RNA binding complexes containing the polypyrimidine tract-binding protein 1 (PTBP1) (25–28). Whereas PTBP1 is most well-characterized as playing a major role in splice-site selection of a diverse set of transcripts in many different cell types, it is also known to be critical for multiple steps of mRNA biosynthesis including polyadenylation, transport, stability and initiation of protein translation (29, 30). PTBP1 consists of four RNA recognition motifs connected by unstructured linker regions that bind short CU sequences contained within a longer pyrimidine tract (31, 32). In addition to PTBP1, two PTB paralogs are expressed in mammalian tissues: PTBP2, which is expressed principally in neurons (33) and ROD1 or PTBP3, expressed preferentially in hematopoietic cells (34). Recent work targeting PTBP1 and PTBP2 in B cells revealed that PTBP1 plays an essential role in the development or maintenance of mature B cells, and if deleted is compensated by the upregulation of PTBP2 (35).
Our previous studies that analyzed the expression of CD40L in ex vivo CD4 T cells revealed that the mRNA was unstable at early times of activation followed by an increase in transcript stability at extended times of activation (25, 27). We further showed that the stability phase of this process was mediated by two PTBP1-containing complexes (termed Complex I and II) which bound to three distinct sites (A-C) within the CD40L 3’UTR (26, 27, 36). Although Complex I, which also contains nucleolin, is critical for protecting the mRNA from decay, Complex II is likely involved in translational control of CD40L through hnRNPL, another component of Complex II, which binds to an extended stretch of CA repeats within site C at the 3’ end of the stability element (37, 38). The possibility that other proteins, including the PTB paralogs, are essential for the formation of the distinct stability complexes or under certain circumstances can substitute for PTBP1 has not been resolved. The binding of Complex I to CD40L mRNA was found to correspond to a phosphorylation pattern unique to the cytoplasmic fraction of PTBP1 at late times of activation, although exact amino acids or the kinase(s) that target these sites have yet to be determined (28). Finally, PTBP1 knockdown in human T cells resulted in decreased CD40L expression, diminished proliferation as well as reduced activity through PLCγ1/ERK1/2 and the NF-κB signaling pathways (39).
From these earlier studies it was clear that regulated mRNA decay was critical for modulating CD40L expression, however, the significance of this regulatory pathway within the physiological context of a developing immune response was unclear. Thus, in this work we report the development of a mouse model of reduced CD40L expression that is based on mutating the mRNA stability element (termed CD40L∆5). This model was used to determine how the stability pathway of CD40L expression functioned in critical biological events within an emerging TD immune response. Our findings clearly demonstrate that an intact CD40L stability pathway is essential for optimal production of GC-specific B cells and the generation of IgM and IgG plasmablasts and precursor B memory cells. Additionally, significant loss of GC-specific B cells corresponded to a disrupted GC architecture and an altered distribution of cells between the LZ and DZ. Whereas many of the observed changes could be explained by a decrease in the number of GL7+ B cells due to reduced proliferation and increased apoptosis, the overwhelming reduction of differentiated precursor memory and plasmablast pools suggested an additional and important requirement for precise levels of CD40L expression in determining GC output. Thus, regulated mRNA stability plays a major role in maintaining the amplitude of CD40L expression on CD4 T cells that is essential for driving optimal B cell proliferation and differentiation in a humoral immune response.
Materials and Methods
Generation of the CD40L∆5 targeting construct
CD40L Frag. 2 (1418 bp fragment corresponding to the 3’ region of exon 5 (GB Accession no. AL672128.8, bp 149859–151162) plus downstream sequences (bp 151163–151277)) were PCR amplified from C57BL/6J genomic DNA using Pfu Polymerase (Promega) and 0.2μM Frag. 2 primers (all primers listed in Supplementary Table 2). This fragment was subcloned into the pGEM-T Easy vector using the T-A cloning and site-directed mutagenesis was carried out targeting 178 bp within the CD40L stability element corresponding to repetitive CU and CA stretches in binding Sites B and C, respectively (150812–150990). CD40L fragments 1 (bp 145532 to 149859) and 3 (bp 151278 to 155100) were PCR amplified and cloned into pBlueScript (pBS) using Not I and Pst I sites (Frag. 1) and Hind III and Not I sites (Frag. 3) to generate pBS-Frag.-1 and pBS-Frag.-3. pBS-Frag.-1 and Frag. 2 were combined into pBS-Frag.1+2 and the final targeting construct was generated by combining pBS-Frag. 1+2 and pBs-Frag. 3 into the pEasy Flox vector (Addgene plasmid # 11725; http://n2t.net/addgene:11725; RRID:Addgene 11725, (40)) to generate pEasy-Complete. The genetic organization was confirmed by restriction enzyme analysis and PCR. The fidelity of all exons was confirmed by sequencing.
Generation of CD40L∆5 mice
Generation of knock-in mice harboring the pEasy-Complete vector was carried out by the Rodent Genetic Engineering Laboratory at NYU Langone (NY, NY). Gene Targeting was carried out using proprietary C57BL/6 Embryonic Stem Cell lines. 200 positive clones were screened for the presence of the targeted allele. Seven positive clones were analyzed by PCR and Southern blot analysis and positive clones were introduced by microinjection into C57BL/6 tetraploid blastocysts, which resulted in the generation of fully ESC-derived mice. The neomycin-resistance gene (NeoR) was removed by crossing mice carrying the targeted allele to a Cre-deleter transgenic male and resultant mice carrying the Cre gene were backcrossed several generations until the Cre gene was no longer detectable by PCR. Only hemizygote males (Y/+,Y/∆5) and homozygote females (+/+, ∆5/∆5) were used in these studies and both males and females were included in all experiments, where possible. Due to the location of the mutation on the X chromosome, WT females and ∆5/∆5 females were not able to be generated from the same litter, but were generated from breeding male Y/+ or Y/∆5 to female heterozygotes. All animals were caged within the same room. Mice were housed in ventilated micro-isolators under specific pathogen-free conditions in a Rutgers University mouse facility and used at 6–10 weeks of age in accordance with NIH guidelines and under an animal protocol approved by Animal Care and Use Committee of Rutgers University.
Immunization
Sheep red blood cells (SRBC) (Innovative Research Inc., Novi, MI) were resuspended at a ratio of 1:1 in PBS and 500 μL injected intraperitoneally (i.p.). Mouse spleens were harvested at day 8 and splenic mononuclear cells dissociated by mincing between glass slides, filtered and suspended in HBSS with 5% FBS. Following RBC lysis for 35 seconds using 1X Ammonium-Chloride-Potassium (ACK) lysis buffer, splenic cells were washed 3 times with HBSS with 5% FBS, resuspended in RPMI with 10% FBS and counted. Bone marrow cells were isolated by flushing the femurs with PBS.
NP-KLH (Biosource) was dissolved in sterile PBS at a concentration of 1 mg/ml. For primary immunizations and secondary boosters (at 21 days), NP-KLH was mixed with Alum at a 1:1 ratio and 200 µL containing 100 µg was injected i.p. into mice. Prior to injection, mice blood was collected at day -4, and then following injection at days 7, 14, 21 and 28 by submandibular bleeding, centrifuged and serum collected and stored at -80°C. Draining mesenteric lymph node cells and splenocytes were collected from NP-immunized mice at day 28 using protocols described above.
Antibodies and Primers
All antibodies and primers used in this study are listed in Supplementary Tables 1 and 2.
B cell morphological examination
Spleens from SRBC immunized mice (day 8) were embedded and snap frozen in Optimal Cutting Temperature compound (OCT, Sakura Fintech) and stored at -80°C. Microsections (20µm) were prepared using a CM1900 cryostat microtome (Leica) and stained with Mayer’s Hematoxylin (Sigma) followed by Eosin Y stain (Sigma). For expression of GC-specific proteins, slides were rehydrated with 1X PBS and blocked with 1XPBS + 0.1% Tween 20 (1x PBS-T) containing 1% Fc-block (Mouse Fc Block, BD) and 3% BSA. Sections were stained with either A594-CD4, APC-IgD and AF488-GL7 mAbs or FITC-CD21/35, PE-CD23 and A647-CXCR4 mAbs diluted in PBS-T with 1% Fc Block. After incubation at RT for 1 h, slides were washed with PBS-T, mounted and bright-field micrographs of sections were imaged using a Nikon Eclipse E600.
Flow Cytometry
Single cell suspensions (1 × 10⁶ cells) from spleen, lymph nodes, thymus, and BM were stained with Zombie-NIR fixable viability dye (Biolegend) for 15 min, washed and suspended in PBS with 1% BSA, 2% rat serum and 1µg/mL of anti-FcγR to block FcR binding. After 10 min of incubation on ice, the appropriate primary antibodies, unconjugated or conjugated to different fluorescent markers, were added to the cells at a concentration 1–10 μg/ml and incubated for 30 min on ice. The cells were washed 2X with PBS + 1% BSA, and secondary antibodies were added if needed for 30 min on ice. The cells were washed 2X in PBS + 1% BSA and fixed in PBS + 1% paraformaldehyde. For staining of intracellular antigens, fixed cells were either incubated with 0.1% Triton-X for 5 min and washed twice before staining or maintained in Cytofix/Perm buffer (BD) for the duration of staining. Flow cytometric analysis was performed on a FACS Calibur or Cytek Aurora cytometer and results analyzed with FlowJo software (TreeStar). FSC-SSC gating for single lymphocytes excluding cell aggregates, small erythrocytes, and dead cell debris, was used for analyzing flow-cytometric data.
The surface mobilization assay to identify preformed CD40L was carried out as previously described with slight modifications (41). Briefly, splenocytes were harvested from NP-KLH challenged and boosted mice at 28 days and treated with 10 ug/mL cycloheximide (CHX) for 1 h prior to and during activation with 50 ng/mL PMA and 1 ug/mL ionomycin at 37°C for 30 min. CD4 T cells were identified using CD4-FITC antibody and cells expressing CD40L with CD40L-PE.
Isolation of Cells
CD19+ B cells were isolated from splenocytes using the Mojosort positive selection kit (Biolegend). Briefly, 10µl of CD19 nanobeads were added to 107 splenocytes and incubated on ice for 15 min. 2.5 ml of MojoSort buffer was added and cells collected after magnetic separation. The unlabeled fraction was poured off and the beads washed 1X in PBS and this process was repeated 2X to remove the non-B cell fractions.
To isolate GC B cells 10 µl of PNA-Biotin was added to 10⁷ total cells, incubated for 5 min on ice followed by addition of 20 µl of anti-Biotin MicroBeads according to the manufacture’s protocol (Miltenyi Biotec). Cells were washed and resuspend in 500 µl of buffer and applied to a magnetic column for separation. RNA was isolated CD19 and GC B cells as described below.
Gene Expression Profiling
CD19+ B cell cDNA library was constructed with the Next Ultra RNA Library Prep Kit for Illumina (NEB). The size range of RNA was estimated on a 2100 Bioanalyzer (Agilent Technologies) and RNA-seq carried out at Novogene Corp on a NovaSeq 6000 sequencer (Illumina) in a 150 bp paired-end read mode. The raw data were processed with CASAVA 1.8.2 (Illumina) to generate fastq files. The sequence reads were aligned to the Mus musculus reference genome (mm9) using STAR. According to the mapped data, the fragments per kilobase of exon per million reads (FPKM) was calculated with the M. musculus genome annotation NCBI build 37.2. The differential expression analysis of two conditions/groups was performed using the DESeq2 R package. The resulting P values were adjusted using the Benjamin and Hochberg’s approach for controlling the false discovery rate. Three biological replicates were used for each population. To identify if biological functions or pathways that were significantly associated with differentially expressed genes, the clusterProfiler software was used for enrichment analysis, including Gene Ontology (GO), KEGG and Reactome database Enrichment. GO, Reactome and KEGG terms with padj< 0.05 are classified as significant enrichment. Results for the RNAseq analysis have been deposited in the National Institutes of Health Gene Expression Omnibus database under the accession number GSE163962 (https://www.ncbi.nlm.nih.gov/geo/).
Total RNA isolation, cDNA synthesis, and RT-qPCR analysis
Total RNA was isolated from 1–5X10⁶ cells using the TRIzol reagent (Invitrogen) and DNase treated in solution for 10 min (RNAeasy plus kit) to remove any remaining genomic DNA. Purified RNA was quantified using a NanoDrop 2000 spectrophotometer and cDNA was synthesized with 1 µg total RNA using SuperScript III First-Strand Synthesis System kit (Invitrogen). qPCR was performed with Power SYBR Green PCR master mix (Applied Biosystems, A25741) using forward and reverse primers. GAPDH and β2-microglobulin were used as endogenous controls.
Sequencing of V186.2 gene rearrangements
Mice (N = 6) were injected i.p. with 100 ug NP-KLH and dissociated splenocytes were isolated at day 14 post immunization. PNA positive GC B cells were isolated and RNA extracted as described above. To selectively amplify V186.2 Cγ1 transcripts, RNA was reverse-transcribed using the Cγ1-cDNA primer and 2 µL of cDNA added to reaction buffer with 10 mM dNTPs, 25 mM MgCl2, 0.2 μM each V186.2-leader primer Cγ1-PCR primer, followed by amplification (95°C 2 min, 30X (95°C 30 s, 70 °C 30 s, 72 °C, 90 s), 72 °C 5 min). A nested PCR was performed with 2 µl of PCR product from the first round with using 0.2 μM each of the V186.2-nested primer and the Cγ1-PCR primer. PCR products were ligated into the pGEM-T Easy vector and selected bacterial colonies sequenced using the T7 primer. Obtained sequences were run against the VBASE2 database (http://www.vbase2.org, V186.2 corresponds to musIGHV057). The V186.2 mutation frequency was determined dividing the number of somatic mutations by the number of V186.2 nucleotides sequenced (excluding sequences encoded by N, D, and joining (J) nucleotides).
ELISpot detection of NP-specific antibody forming cells (AFC)
Multi-Screen 96-Well Assay Plates (MilliporeSigma, MSIPS4W10) were pre-treated with 15 μl of 35% EtOH per well for 1 min followed by 3 washes with 200 μl of sterile PBS. The plates were coated with 100 µl of NP20–25-BSA (50 µg/ml in PBS) and incubated at 4°C o/n. Plates were blocked with 100 μl per well RPMI + 10% FBS for 2 h at 37°C. Two-fold dilutions of cells starting from 10^6 cells/100 µl were added to the ELISpot plate and samples incubated O/N at 37°C and 5% CO2. The plates were washed 6X with 1X PBS-T. 100 μl of AP-conjugated anti-mouse IgG1 (1µg/ml) was added to the plate at a dilution of 1:2000 in PBS with 2% BSA and incubated at RT for 1 h. Following incubation, plates were washed 3X with 1X PBS-T, and an additional 3X with PBS. Ready to use NBT/BCIP substrate buffer was added at 100 μl per well and incubated 5–10 min. Spot development was stopped by washing under running water and counted after 24 h.
Measurement of antibody responses
Relative levels of anti-NP antibodies in immune sera were assayed by ELISA on serial dilutions binding to either NP20–25-BSA (high valency) or NP8 (low valency to restrict binding to the high-affinity antibody). Briefly, 96-well plates (Nunc, maxisorb) were coated with 50 μl per well of 5 μg/ml of NP-BSA diluted in PBS. Following overnight incubation at 4°C, plates were washed 3X with 1X PBS-T, blocked with PBS+2% BSA and incubated at RT for 1 h. Diluted samples were added to plates, incubated for 2 hours at 37 °C and plates washed 3X with 1X PBS-T and blotted dry. Following the incubation, 50 μl of detection antibody diluted 1:2000 in PBS–1% BSA was added to each well, incubated at RT for 1 h and plates washed 4X with 1X PBS-T, and 50 µl of PNPP substrate solution added for 10–30 min. Plates were read on a spectrophotometer at 405 nm absorbance. The sample concentrations were interpolated from the standard curves using GraphPad Prism.
Data analysis and statistics
Unless specifically stated in the figure legend, results are presented as the geometric mean ± s.e.m. The statistical test for each set of experiments is listed in the figure legend. In the majority of cases, P values were calculated by unpaired, student t-test, with *P ≤ 0.05, **P ≤ 0.01, and ***P ≤ 0.001. Statistical analyses were performed on GraphPad Prism software version 7.
Results
Generation of a mouse model of decreased CD40L expression
The mouse CD40L stability element was previously defined as a 350 bp region that showed high homology to a stability region in the human CD40L gene. Using the entire region as a probe in R-EMSA we found that all complexes that bound to this region were competed for by anti-PTBP1 antibodies suggesting that PTBP1 was a component of all complexes binding to this region (42). However, the possibility exists that other RNA binding proteins are in complex with PTBP1 and contribute to mRNA stability. We identified nucleolin as one such protein and it is possible that other proteins may have important functions in these complexes. To identify sequences within the 3’UTR that resulted in destabilization of the transcript, the different regions were cloned into the pGL3 vector and luciferase measured following transfection into Jurkat cells. We found that Site B and to a lesser extent a region equivalent to human Site C, enhanced expression of luciferase whereas Site A alone or in combination with other elements had a negative effect on expression (Supplementary Figs.1a and 1b). We therefore generated a targeting construct containing a deleted region of 175 bp, which included the regions defined as Sites B and C. Following targeted recombination, the loxp flanked NeoR gene was removed by breeding with a Cre-deleter strain and a pure line of mutant mice lacking the stability element was generated (termed CD40L∆5) (Supplementary Figs. 1c-f).
To understand the role of mRNA stability in providing threshold levels of CD40L for TD antibody responses and cellular fate decisions, CD40L∆5 mice were analyzed for production and distribution of T cells and B cells prior to immunization. Distribution of thymic and splenic T cell subsets revealed no obvious differences with WT controls (Supplementary Fig. 2a). Additionally, prior to and following antigen challenge, the absolute number of B220+, B220+IgM+IgD+/-, B220+IgM+/-IgD+, follicular (B220+CD21intCD23hi) and marginal zone (B220+CD21hiCD23int) B cells were similar between CD40L∆5 mutants and WT controls (Supplementary Fig. 2b). Thus, mice carrying the CD40L∆5 mutation were indistinguishable from WT mice with respect to the distribution and number of lymphoid cells prior to antigen challenge.
The CD40L∆5 mice express lower levels of CD40L on CD4 T cells
We next asked whether the expression of CD40L was decreased in CD4 T cells from mice immunized in vivo with NP-KLH followed by ex vivo stimulation with antigen presenting cells (APCs) presenting KLH (APC-KLH). Specifically, CD40L surface expression was found to be frequently lower in CD40L∆5 CD4 T cells that were solely stimulated ex vivo alone with APCs alone although this difference was not consistently seen in all animals (Figs. 1a-b, left panels). Notably, CD40L∆5 CD4 T cells that were re-stimulated ex vivo with APC-KLH expressed significantly less CD40L than WT cells and this difference was highest at 12 h post activation (Figs. 1a-b, right panels and Fig. 1c). We also examined the presence of preformed CD40L in ex vivo splenic CD4 T cells (28 days post immunization and boost) following acute re-activation with PMA/ionomycin. Similar to what we observed with APC-stimulation at early time points ex vivo, there was no significant difference in in this intracellular pool of preformed CD40L upon re-activation between CD40L∆5 and WT CD4 cells (Fig. 1d).
Fig. 1: CD40L∆5 mice express less CD40L on activated CD4 T cells.
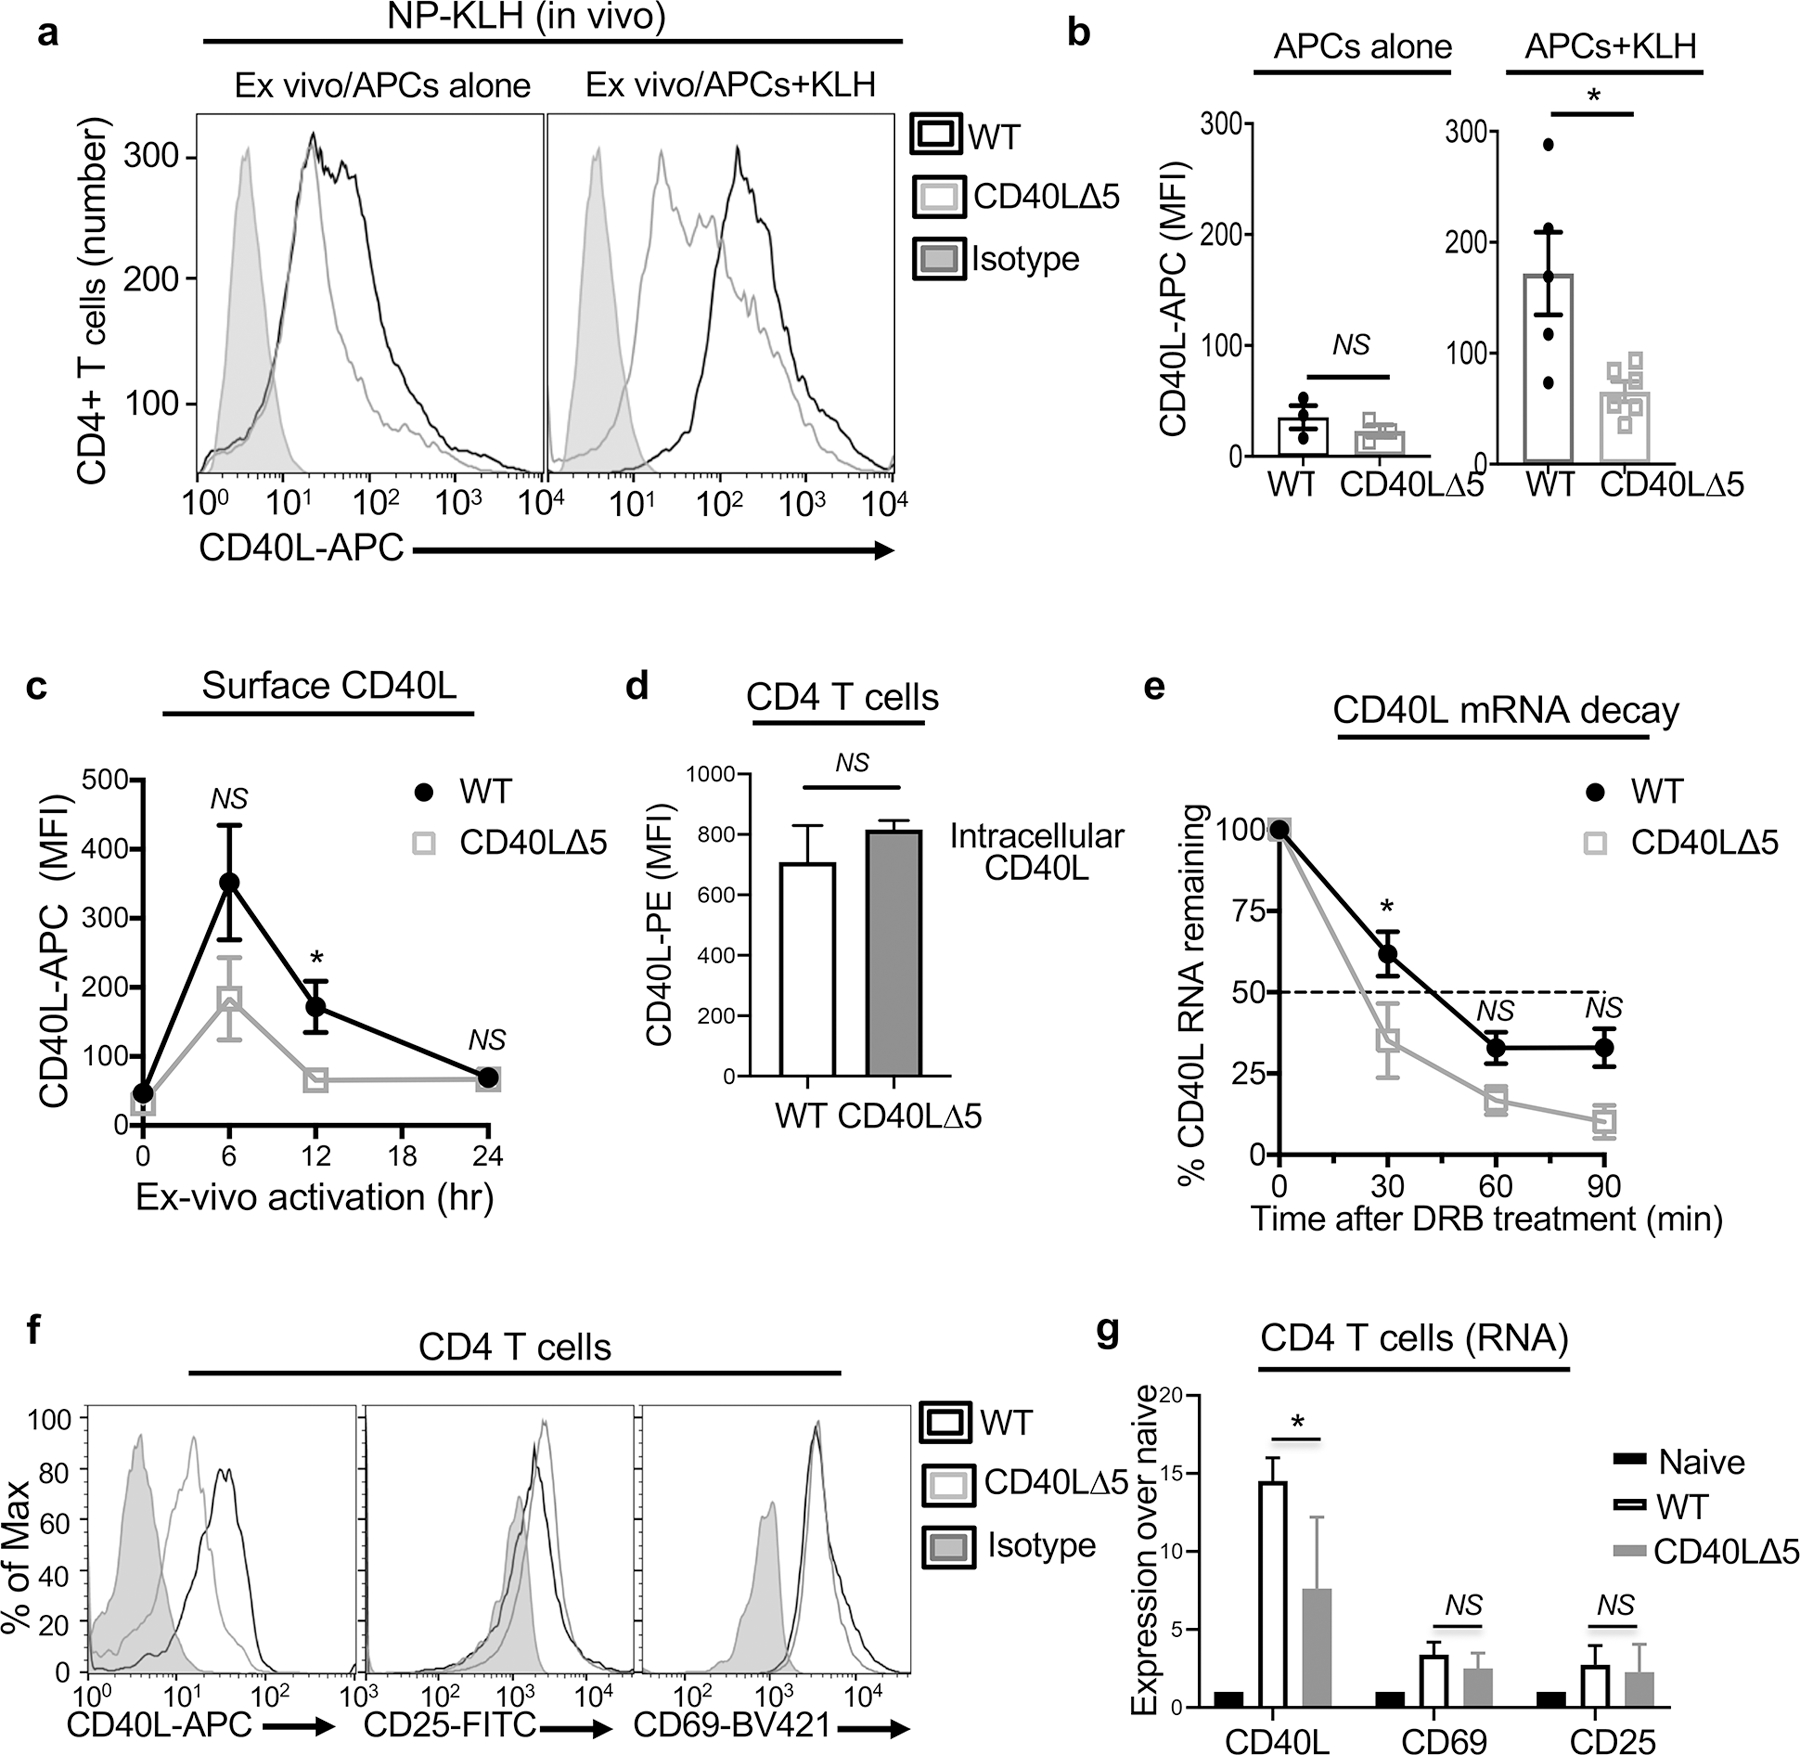
(a) CD40L∆5 and WT littermates were immunized i.p. with 4-hydroxy-3-nitrophenyl-acetyl-keyhole limpet hemocyanin (NP)-KLH at day 0, boosted 21 days later and draining mesenteric lymph nodes collected 7 days later. Dissociated cells were incubated with 1 µg/ml KLH for 12 h followed by staining with anti-CD4-PE and anti-CD40L-APC antibodies. (b) Compiled data showing expression of CD40L on CD4 T cells stimulated ex vivo with antigen presenting cells (APCs)-alone (left graph) or APCs+KLH (right graph) (c) Surface CD40L expression on CD4 T cells analyzed as in (a) and expression measured over a time course of activation with plate bound APCs-KLH. (d) Spleens were isolated from mice that had been injected with NP-KLH at day 1 and boosted at day 21. Total splenic cells were treated with 10 ug/ml cycloheximide for 1h prior to activation with 50 ng/ml PMA and 1 ug/ml ionomycin for 30 min. The presence of preformed CD40L was determined by staining cells with anti-CD4-FITC and anti-CD40L-PE antibodies. Shown is the graphical representation of three independent experiments with horizontal bars representing the geometrical mean and the SD of the mean. (e) Purified CD4 T cells were isolated from NP-KLH activated mice (as described in a-c), activated with KLH for 12 h, collected and dissociated in media. Incubation was carried out with 50 μM of the elongation inhibitor 5,6-Dichlorobenzimidizole 1-β-D-ribofuranoside (DRB) for 30, 60 and 90 min. (f-g) Analysis of surface protein (f) and mRNA expression (g) of CD40L, CD25 and CD69 on CD4 T cells isolated from NP-KLH immunized mice (as in (a)). Significance was determined at the 95% confidence level by paired two tailed t-test (b) and unpaired two tailed t-test (c-e, g) with significance defined as *P ≤ 0.05, NS = not significant.
To determine if the observed decrease in CD40L expression in CD4 T cells from CD40L∆5 mice was consistent with altered mRNA stability splenic CD4 T cells were isolated from NP-KLH immunized mice, stimulated ex vivo for 12 h with APC-KLH and treated with the transcriptional inhibitor DRB. Decay was measured over a time course of 90 min and cells collected and analyzed every 30 min for CD40L RNA by RT-qPCR. Compared to our findings with WT CD4 T cells, the stability of the CD40L transcript in mutant cells was reduced to a t1/2 < 30 min from ~ 45 min (Fig. 1e). Finally, to confirm that the stimulation of CD4 T cells expressing the CD40L∆5 mutation did not result in an overall decrease in activation, splenic CD4 T cells from NP-KLH immunized mice were isolated and the expression of two additional activation markers were assessed by flow cytometry and RT-qPCR. In contrast to CD40L, no significant difference in CD69 and CD25 expression was observed in CD4 T cells from CD40L∆5 mice confirming that loss of the stability program did not result in a global decrease in CD4 T cell activation but was confined to affecting only the expression of CD40L (Figs. 1f -g).
The pathway of CD40L stability is critical for the establishment of the GL7+ B cell population
Although the requirement of CD40-CD40L interactions in the formation of GCs is well documented in both mice and humans we wished to discern whether the threshold of CD40L expression provided by mRNA stability is critical for the establishment and function of these structures (43). Thus, splenic sections from mice injected with sheep red blood cells (SRBCs) were visualized using immunohistochemistry (IHC) to delineate distinct structural regions of the GCs including naïve B cells (IgD+), T cells (CD4+) and antigen-selected GC B cells (GL7+) (20, 44). Surprisingly, we found that the GC architecture in spleens from CD40L∆5 mice was highly disorganized relative to those from WT mice; the IgD+ and CD4+ sectors appeared relatively normal, whereas the GL7+ area was smaller and positively stained cells were diffused throughout the GC (Figs. 2a and 2b). When sections were analyzed in more detail, there appeared to be little difference in the overall number of initiated GCs, however the size of the individual GC was significantly decreased in the mutant (median: 5.9 vs 3.8, respectively) and disorganized (Figs. 2c and 2d). Further confirmation of these findings was carried out using flow cytometry to quantify the GC B cell population (CD19+Fas+GL7+). Again, we found the GL7+ B cell population was significantly reduced (approximately 2–3-fold) in mice expressing the CD40L∆5 mutation (Fig. 2e).
Figure 2: Disruption of the CD40L stability pathway results in disorganized GCs and a loss of GL7+ B cells.
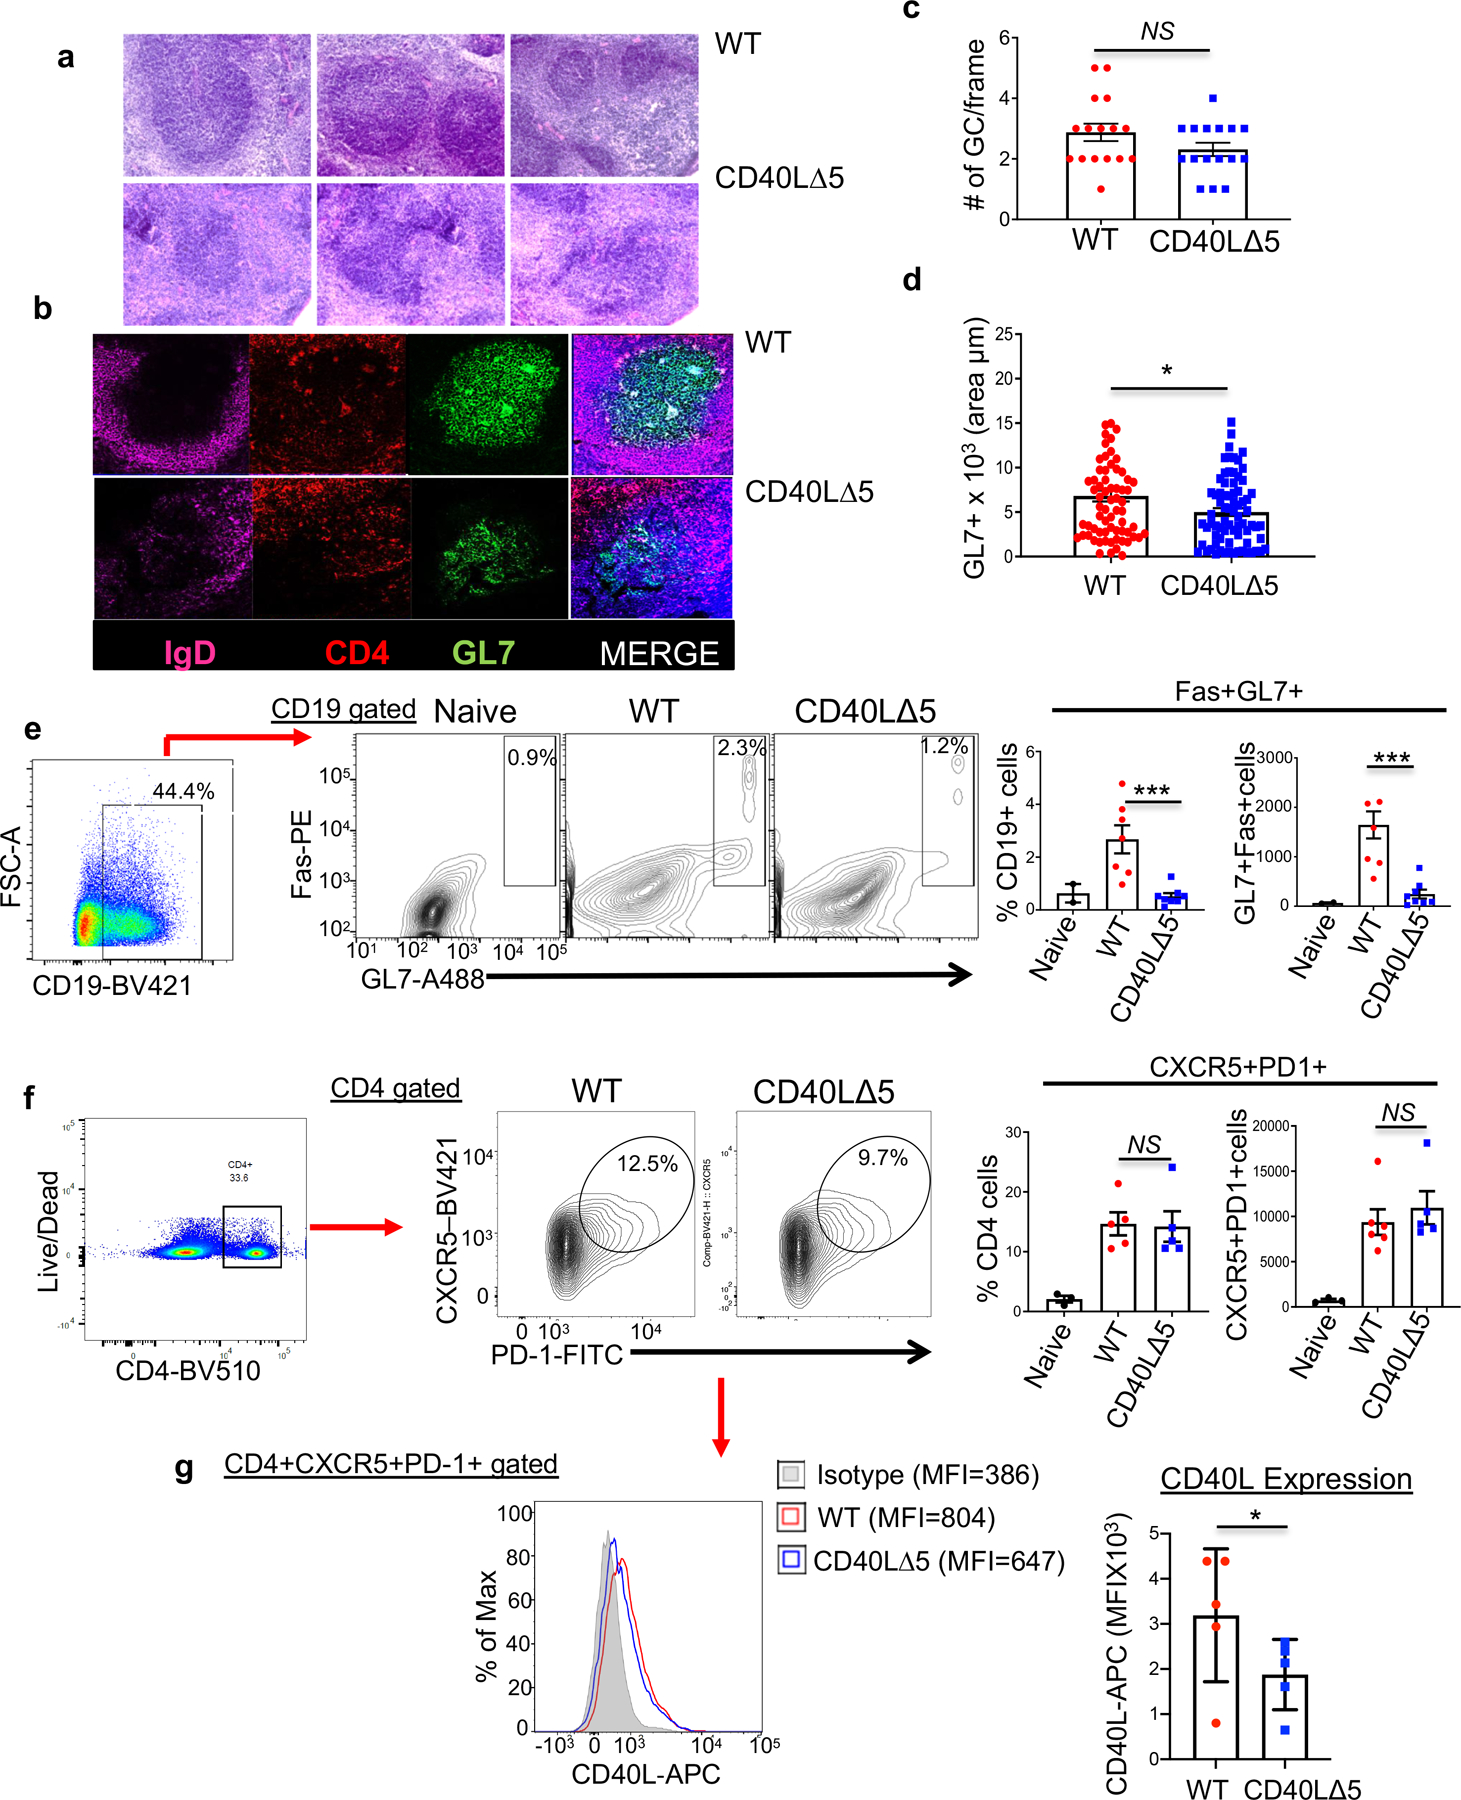
(a) GC structures were visualized in mice 8 days following SRBC immunization using 20µm sections of frozen spleens stained with hematoxylin and eosin (H&E) and visualized using a Nikon Eclipse E600 fluorescence microscope. (b) Splenic sections were stained with anti-mouse IgD to identify naïve B cells (APC-labeled, purple), anti-mouse CD4 for T cells (PE-labeled, red), and anti-mouse GL7 for GC B cells (Alexa488, green). (c and d) Spleens were isolated from SRBC immunized mice (as above) and GCs identified using Olympus Studio 2 software. The number of GCs per image frame calculated and the area of each individual GC quantified and compared between WT and CD40L∆5 mice. (e) Representative flow analysis (middle) and compiled percentages and total cell number (right graphs) of CD19-gated splenocytes stained with antibodies against GL7 and Fas protein 8 days post SRBC immunization. Values are averages of WT and CD40L∆5 mice (n=7) where bars denote the geometric mean and s.e.m. (f) Representative flow cytometry data and compiled percentages and total cell number (right graphs) of TFH cells (CD4+CXCR4+PD-1+) isolated from WT and CD40L∆5 spleens 8 days post SRBC immunization using CD4-BV510, CXCR5-BV421 and PD-1-FITC antibodies. Bars represent the geometric means of WT and CD40L∆5 mice (n=5) with the error bars determined by the s.e.m. (g) Representative histogram of CD40L expression on TFH cells and quantification using medium fluorescence intensity (MFI) at 8 days post SRBC immunization (n=5). Bars represent the geometric mean and error bars the s.e.m. Significance was calculated in all graphs by unpaired, two-tailed t-test where *P ≤0.05, **P≤0.01, ***P≤0.001 and NS = not significant.
Importantly, the frequency of CD4+CXCR5+PD-1+ (TFH) cells was highly similar between mutant and WT mice thus eliminating the possibility that the decreased frequency of GC B cells was linked to an overall loss of TFH cells (Fig. 2f). Although there was no significant difference in the absolute number of TFH cells, the expression of CD40L at day 8 following SRBC injection on this population was decreased by approximately 40% (Fig. 2g). Together, these findings are consistent with the significant drop in GC B cells from immunized CD40L∆5 mice being a result of the lowered threshold of CD40L expression on TFH cells that depends on the mRNA stability pathway.
GL7+ GC B cells from CD40L∆5 mice are located predominantly within the LZ
We next asked whether the disruption of the GC structure was solely caused by a decrease in the frequency of cells or if there were associated changes in the location and distribution of B cell populations within the GC. This was addressed by analyzing the distribution of DZ (CD19+ GL7+CD86loCXCR4hi) and LZ (CD19+GL7+CD86hiCXCR4lo) B cells eight days after SRBC injection. The DZ/LZ ratio for antigen-specific B cells has previously been shown to be approximately 2:1 (18). Unexpectedly, we found that the GC B cells from CD40L∆5 mice were predominantly distributed in the LZ presenting a sharply skewed DZ/LZ ratio of approximately 0.5:1 (Figs. 3a). This unexpected finding was confirmed using IHC and antibodies against CXCR4, CD21/CD35 and CD23 to visualize the GC architecture. DZ and LZ regions are defined by expression of CD21/35 and CD23 on the surface of follicular dendritic cells (FDCs) where LZ FDCs are CD21/35hi and CD23hi and DZ FDCs are CD21/35med and CD23neg (45). Additionally, areas of CXCR4hi and CXCR4lo can be used to identify areas of DZ and LZ B cells, respectively (46). In WT samples we found a clear demarcation of the LZ FDCs (CD21/35hi CD23hi) whereas this same region was visibly less demarcated in mice harboring the CD40L∆5 mutation. Additionally, the CXCR4hi cells were primarily in the DZ from WT spleens but the few GC B cells were dispersed throughout LZ and DZ regions in spleens from the CD40L∆5 mice (Figs. 3b). Thus, in addition to a marked loss of GC B cells, mice expressing the CD40L∆5 mutation had a major redistribution and positioning of GL7+ cells within the DZ and LZ sectors confirming the need for a threshold of CD40 signaling to properly distribute antigen-selected B cells within the GC.
Figure 3: Reduced DZ and increased LZ distribution of GC B cells from CD40L∆5 mice.
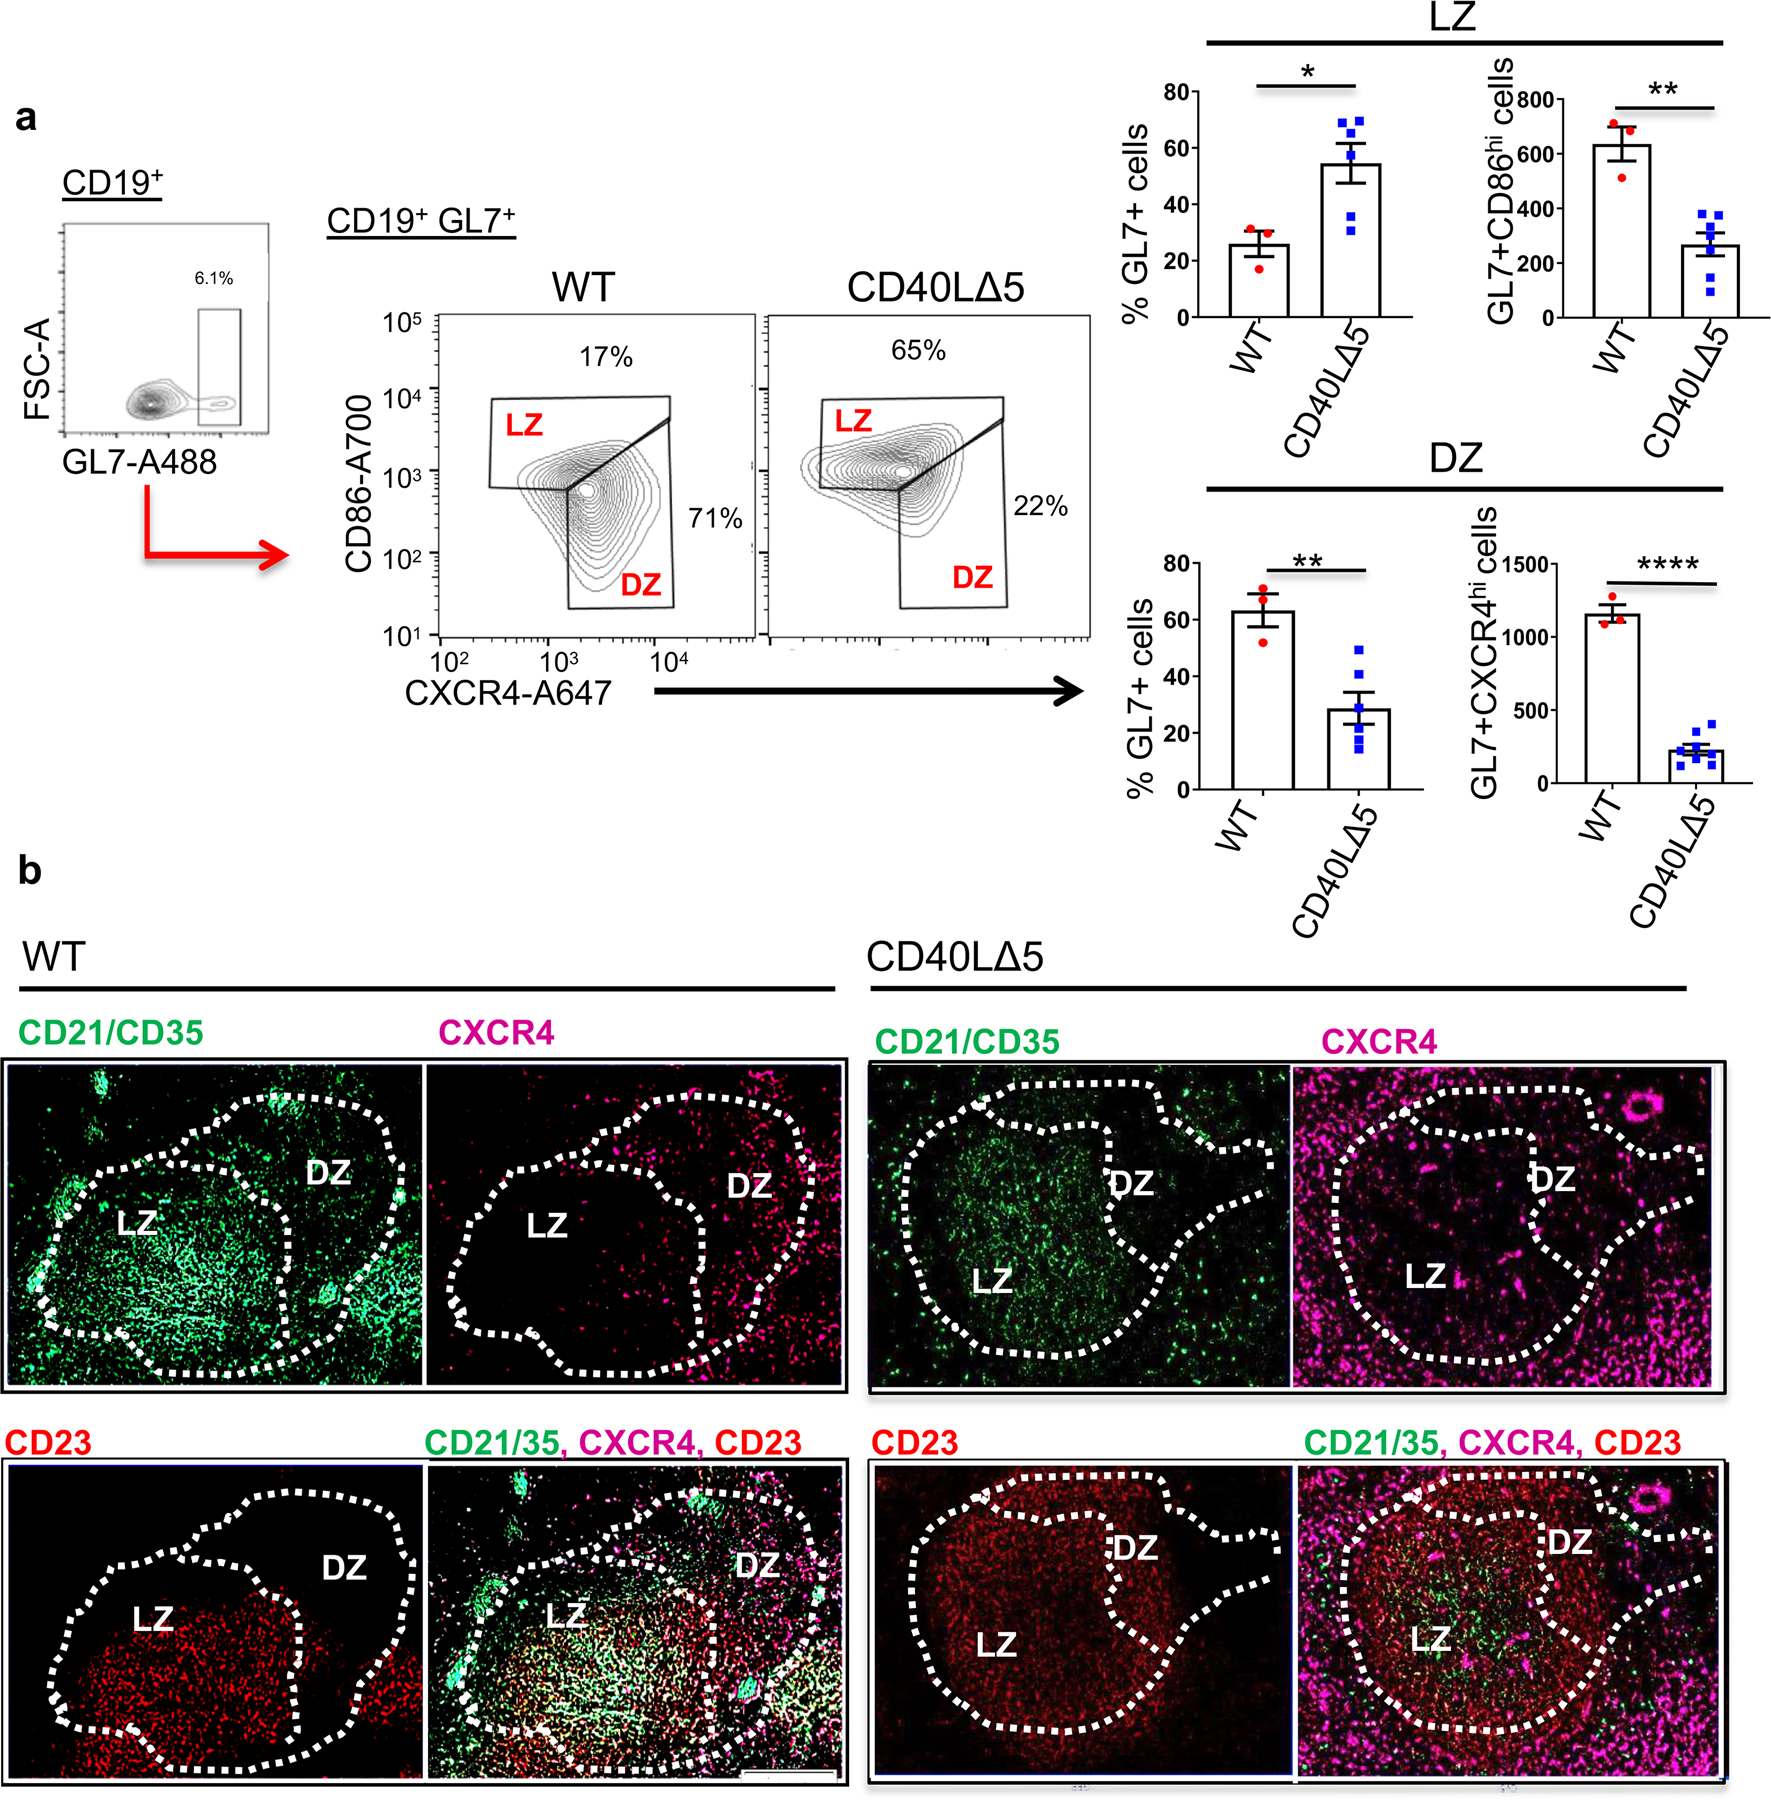
(a) Spleens from WT and CD40L∆5 mice were isolated 8 days post SRBC immunization and gated on CD19+GL7+ cells to identify GC B cells. Sample gating (left panel), representative histogram (middle) and compiled data (right graphs) depicting GC B cells from WT and CD40L∆5 mice stained with antibodies against CD86 (y-axis) and CXCR4 (x-axis). Values reflect the percentage and total cell number of CD19+GL7+ cells that are CXCR4loCD86hi cells (LZ B cells) versus those that are CXCR4hiCD86lo (DZ B cells). Statistical significance was determined by unpaired, two-tailed t-test where *P ≤ 0.05, and **P ≤ 0.01. Each symbol represents an individual mouse (n=3–6) and the mean and s.e.m. indicated by horizontal bars. (b) 20µm sections were collected from frozen spleens, fixed and stained for demarcation of LZ (CD21/35+ (FITC, green) or CD23+ (PE, red)) and DZ (CXCR4hi (Alexa 647, magenta)) areas.
The posttranscriptional pathway of CD40L∆5 is critical for B cell proliferation
To gain a mechanistic understanding of the relationship between altered CD40L expression and the loss and redistribution of GL7+ B cells within the GC we carried out RNAseq with bead sorted CD19+ B cells at day 8 following SRBC injection. We chose to look at this broad B cell population based on the assumption that this approach had the highest likelihood of capturing critical CD40L∆5-dependent transcriptional changes. In contrast, using GL7+ cells exclusively as the starting material had the potential of masking early differentiation events that were dependent on CD40L levels prior to GL7 expression. Accordingly, a pattern of 95 downregulated and 99 upregulated genes were identified being associated with CD19+ cells B cells from mice expressing the CD40L∆5 mutation. Many of the genes that were downregulated mapped to pathways involved in cell cycle, DNA replication and mismatch repair. We also independently identified a number of genes associated with apoptosis that were upregulated in the B cells expressing the CD40L∆5 mutation (Figs. 4a and b). Because antigen-selected GC B cells represent a small percentage of the total splenic B cells, we wish to establish whether gene expression changes associated with proliferation also extended to the GL7+ B cells. To this end cells from mutant and WT spleens were gated on CD19 and GL7 and analyzed for expression of proliferation markers Ki-67 and phospho-histone H3 (PHH3) (47). Importantly, we observed highly reduced levels of both markers indicating that proliferation was significantly inhibited both in CD19 and GL7+ B cells from CD40L∆5 mice (Figs. 4c-d). To determine whether apoptosis was also increased in the GC B cell population we measured the expression of caspase 3 and poly (ADP-ribose) polymerase or c-Parp, two proteins upregulated in apoptotic cells. GC B cells from CD40L∆5 mice showed significant increases in both proteins suggesting a higher level of ongoing apoptosis in these cells (Fig. 4e). Together, these results reveal that the elevated expression level of CD40L resulting from increased mRNA stability is required for optimal proliferation and cell survival of both CD19+ B cells and GC B cells following immunization. Therefore, changes in both proliferation and apoptosis likely underlie the loss of GC B cells in CD40L∆5 mice.
Figure 4: Gene Expression Profiling of CD19+ B cells from CD40LΔ5 mice.
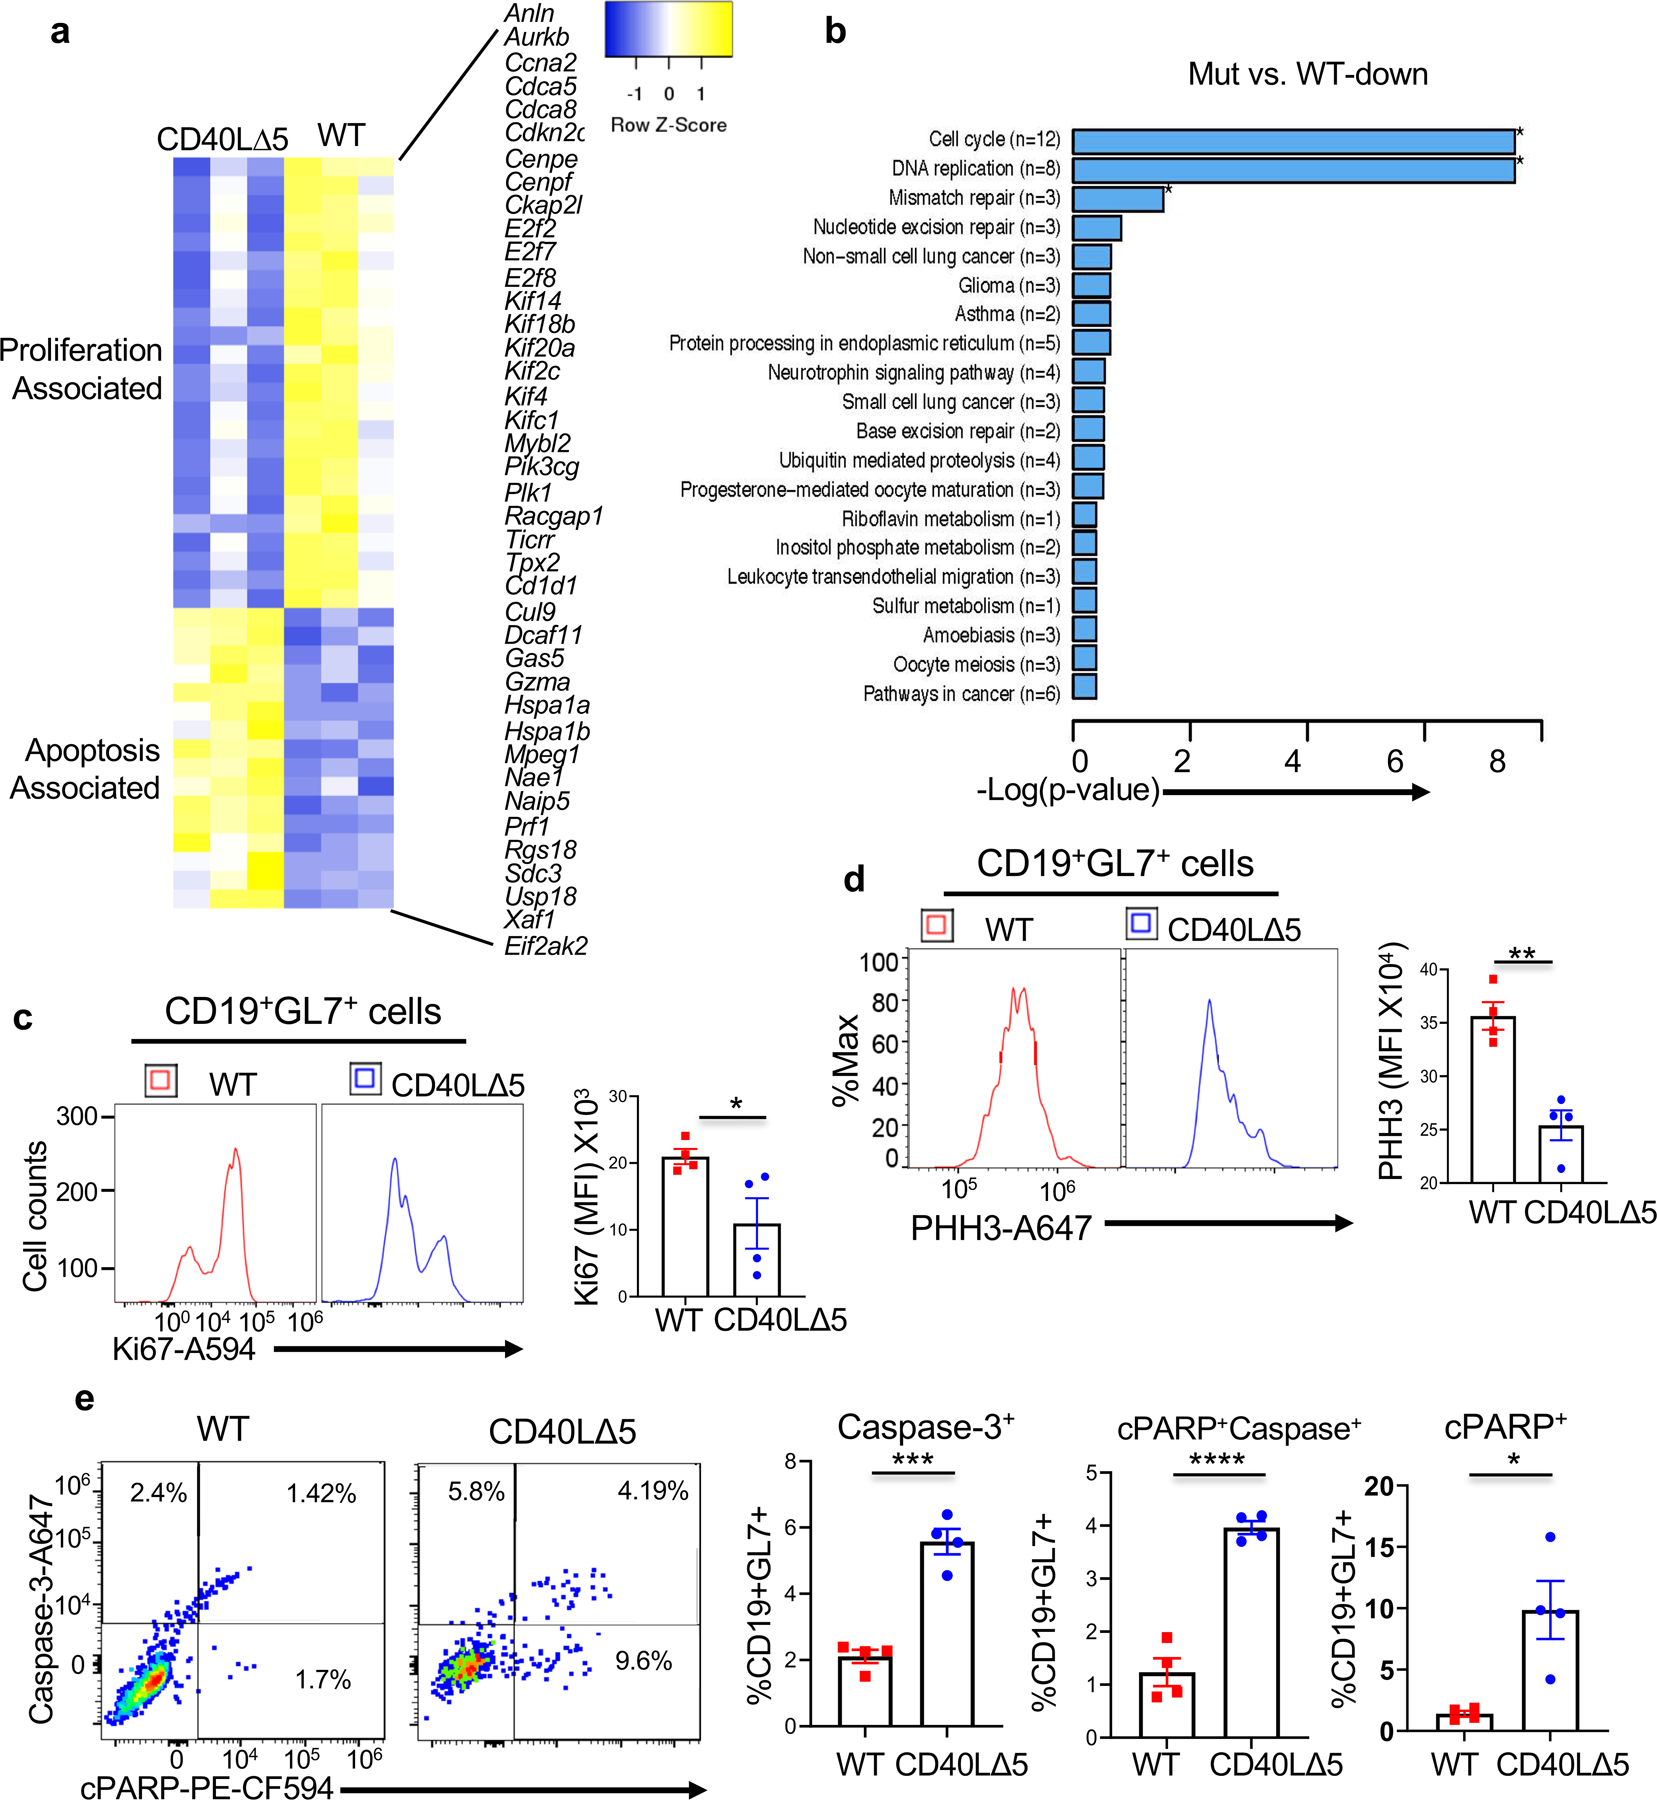
(a) CD19+ B cells were isolated from WT and CD40L∆5 mice 8 days after immunization with SRBC. Hierarchical clustering of gene expression profiles using differentially expressed genes (more than 1.5-fold) between groups (normalized log2 values based on RNA-seq analysis). Genes with a statistically significant (false-discovery rate q < 0.05) are displayed and grouped by function; n = 3 biological replicates. (b) GO pathways showing statistically significant changes in B cells from CD40L∆5 mice. (c) Analysis of intracellular expression of Ki67 (left panel) and quantification of results (right panel) of splenic GL7+ B cells 8 days following SRBC injection. (d) Graphical representation of intracellular expression of phospho-histone H3 (PHH3) in GL7+ B cells 8 days following injection with SRBCs (left panel) and quantification of n=4 independent experiments (right panel). (e) Flow cytometric image of intracellular expression of activated Caspase-3 (y-axis) and cleaved PARP (x-axis) in GL7+ cells from WT and CD40L∆5 mice (left panels) and compiled results for 4 independent experiments (right graphs). Each symbol represents an individual mouse and the mean and s.e.m. are indicated by horizontal bars. Significance was determined by unpaired, two-tailed t-test with *P ≤ 0.05, **P ≤ 0.01, ***P ≤ 0.001 and ****P ≤ 0.0001.
Loss of the CD40L mRNA stability pathway leads to a reduction in splenic antibody-secreting B cells
Because CD40L is critical for both early and late antibody responses to TD antigens, we examined whether the CD40L mRNA stability pathway was critical for early antibody responses that may occur in part, outside the GC (1, 4, 20, 48, 49). To this end, CD40L∆5 and WT mice were immunized with NP-KLH and blood collected at 1, 2 and 3 weeks. Anti-NP antibodies were evaluated for IgM as well as for the presence of switched antibodies of the IgG1, IgG2b and IgG2c subclasses. Whereas we observed no obvious decrease in levels of IgM antibodies, the levels of IgG1, IgG2b, and IgG2c as early as 7 days in CD40L∆5 mice were significantly lower compared to WT mice (Fig. 5a). Analysis of the secondary response in animals at 28 days post immunization and 7 days after boosting revealed a significant decline in humoral output in CD40L∆5 mice including a significant decrease in IgM, IgG1, IgG2b and IgG2c antibodies. In contrast, there was no observable difference in IgG3 and IgA although the overall level of IgA was very low in the serum (Fig. 5b).
Figure 5: The CD40L∆5 mutation leads to altered TD antibody responses.
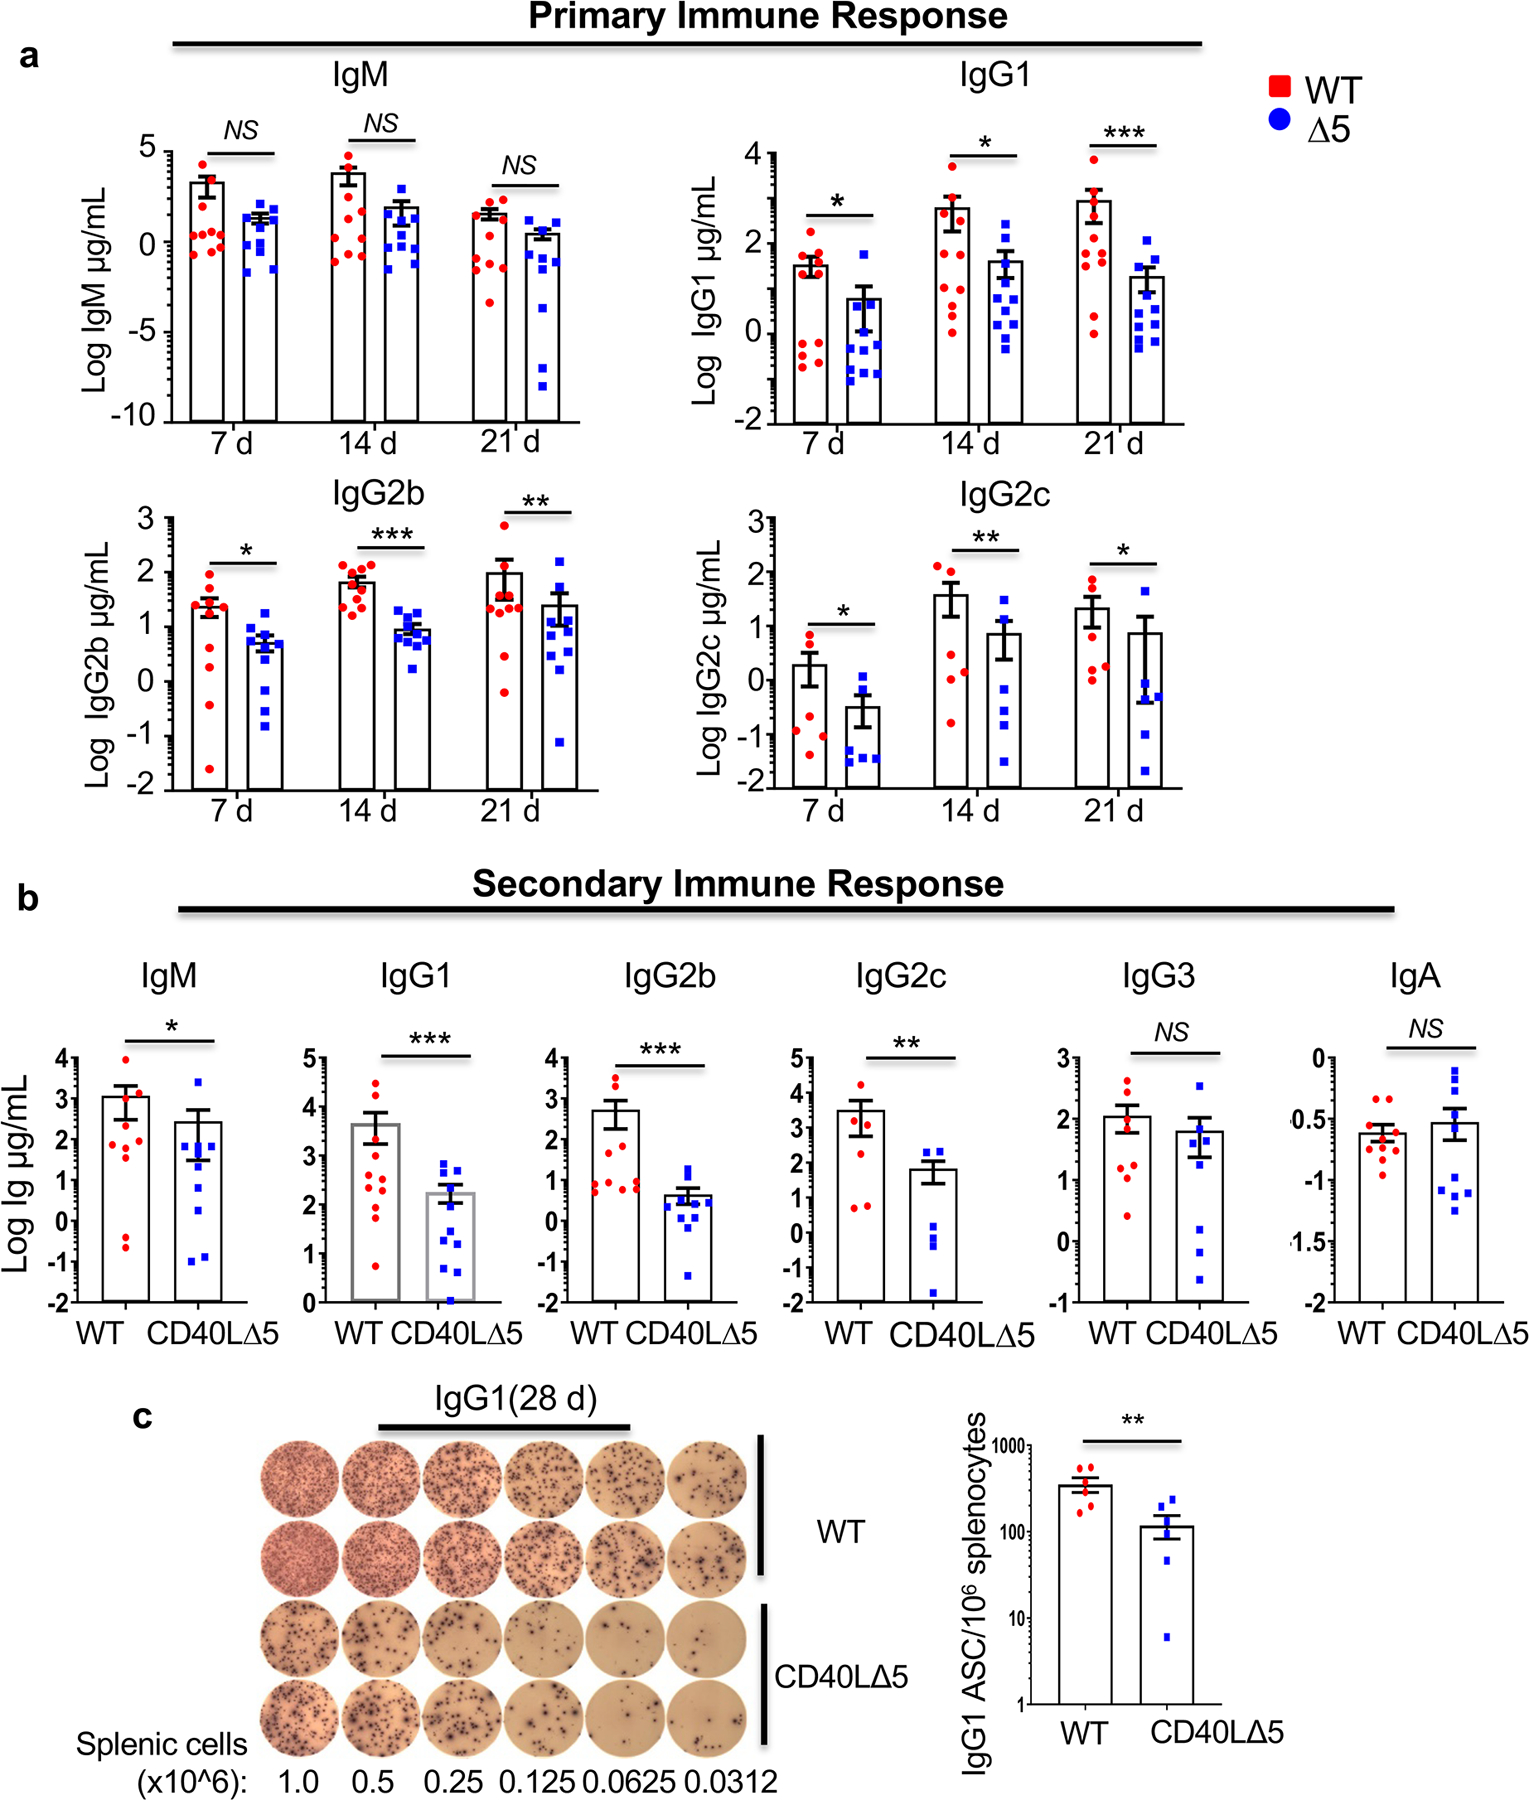
WT and CD40LΔ5 mice (n=6–8 for each group) were injected i.p. with NP-KLH, boosted at day 21. Serum was collected at day and ELISA analyses were performed on sera collected from mice (n=6–10) 7, 14, 21 and 28 days following the initial immunization. (a) Changes in levels of IgM, IgG1, IgG2b, IgG2c antibodies in serum collected on days 7, 14 and 21 post initial immunization and denoted as the primary response. (b) Levels of IgM, IgG1, IgG2b, IgG2c, IgG3 and IgA in serum collected 28 days after initial immunization and 7 days post boost (secondary response). (c) Splenic cells were collected at day 28 after immunization and boost and plated onto an ELISpot plate coated with NP20–25-BSA. Shown are results from two mice each and compiled data from four independent experiments. The number of IgG1 ASCs per 106 cells were measured after overnight incubation. In all graphs each symbol represents an individual mouse and the small horizontal lines indicate the mean and the s.e.m. Significance was determined at the 95% confidence level by unpaired two tailed t-test with significance defined as *P ≤ 0.05, **P ≤ 0.01, ***P ≤ 0.001; NS = not significant.
We next used ELISpot to determine if the basis for the loss of TD antibodies in CD40L∆5 mice was due to decreased numbers of responding B cells or alternatively to lowered antibody expression per responding cell. IgG1-specific antibody-secreting cells (ASCs) were harvested from spleen at day 28 following injection of NP-KLH at days 0 and 21. Notably, over a wide range of dilutions there was a clear decrease in the number of ASCs in CD40L∆5 mice indicating that the CD40L stability pathway resulted in the reduction of ASCs and not in a lowered amount of antibody produced per cell (Fig. 5c).
The CD40L mRNA stability pathway is required for optimal affinity maturation but not SHM
To determine whether somatic hypermutation and affinity maturation were linked to the higher threshold of CD40L expression that resulted from mRNA stability experiments were carried out to identify nucleotide changes in the VH regions that are known to be associated with increased antibody affinity. In the NP system, early replacement of a tryptophan (W) with a leucine (L) at codon 33 in the VH186.2 gene has been shown to be associated with a >10-fold increase in affinity of anti-NP antibodies (50, 51). Therefore, RNA was isolated from PNA+ splenocytes, 14 days post immunization with NP-KLH and corresponding cDNAs sequenced across the VH region. We observed that 40% of the CD40L∆5 sequences had the G→T transversion leading to the W33L substitution compared to 60% of the WT sequences (Fig. 6a). Although this difference did not reach statistical significance, the downward trend prompted us to ask whether there was a corresponding decrease in the number of mutations across the CD40L∆5 V186.2 gene which would indicate a potential AID deficiency. Surprisingly, we found no consistent difference in the total number of mutations in B cells from CD40L∆5 and WT mice suggesting that the lower level of CD40L does not appreciably impact SHM (Fig. 6b). To further confirm these findings, GC B cells were analyzed for expression of AICDA and c-myc, which have both been shown to be controlled, in part, by CD40 signals (52, 53). Notably, we observed a highly significant decrease in c-myc expression and no difference in AICDA expression in PNA+ B cells from CD40L∆5 mice (Fig. 6c).
Figure 6: The effect of the CD40L∆5 mutation on somatic hypermutation and affinity maturation.
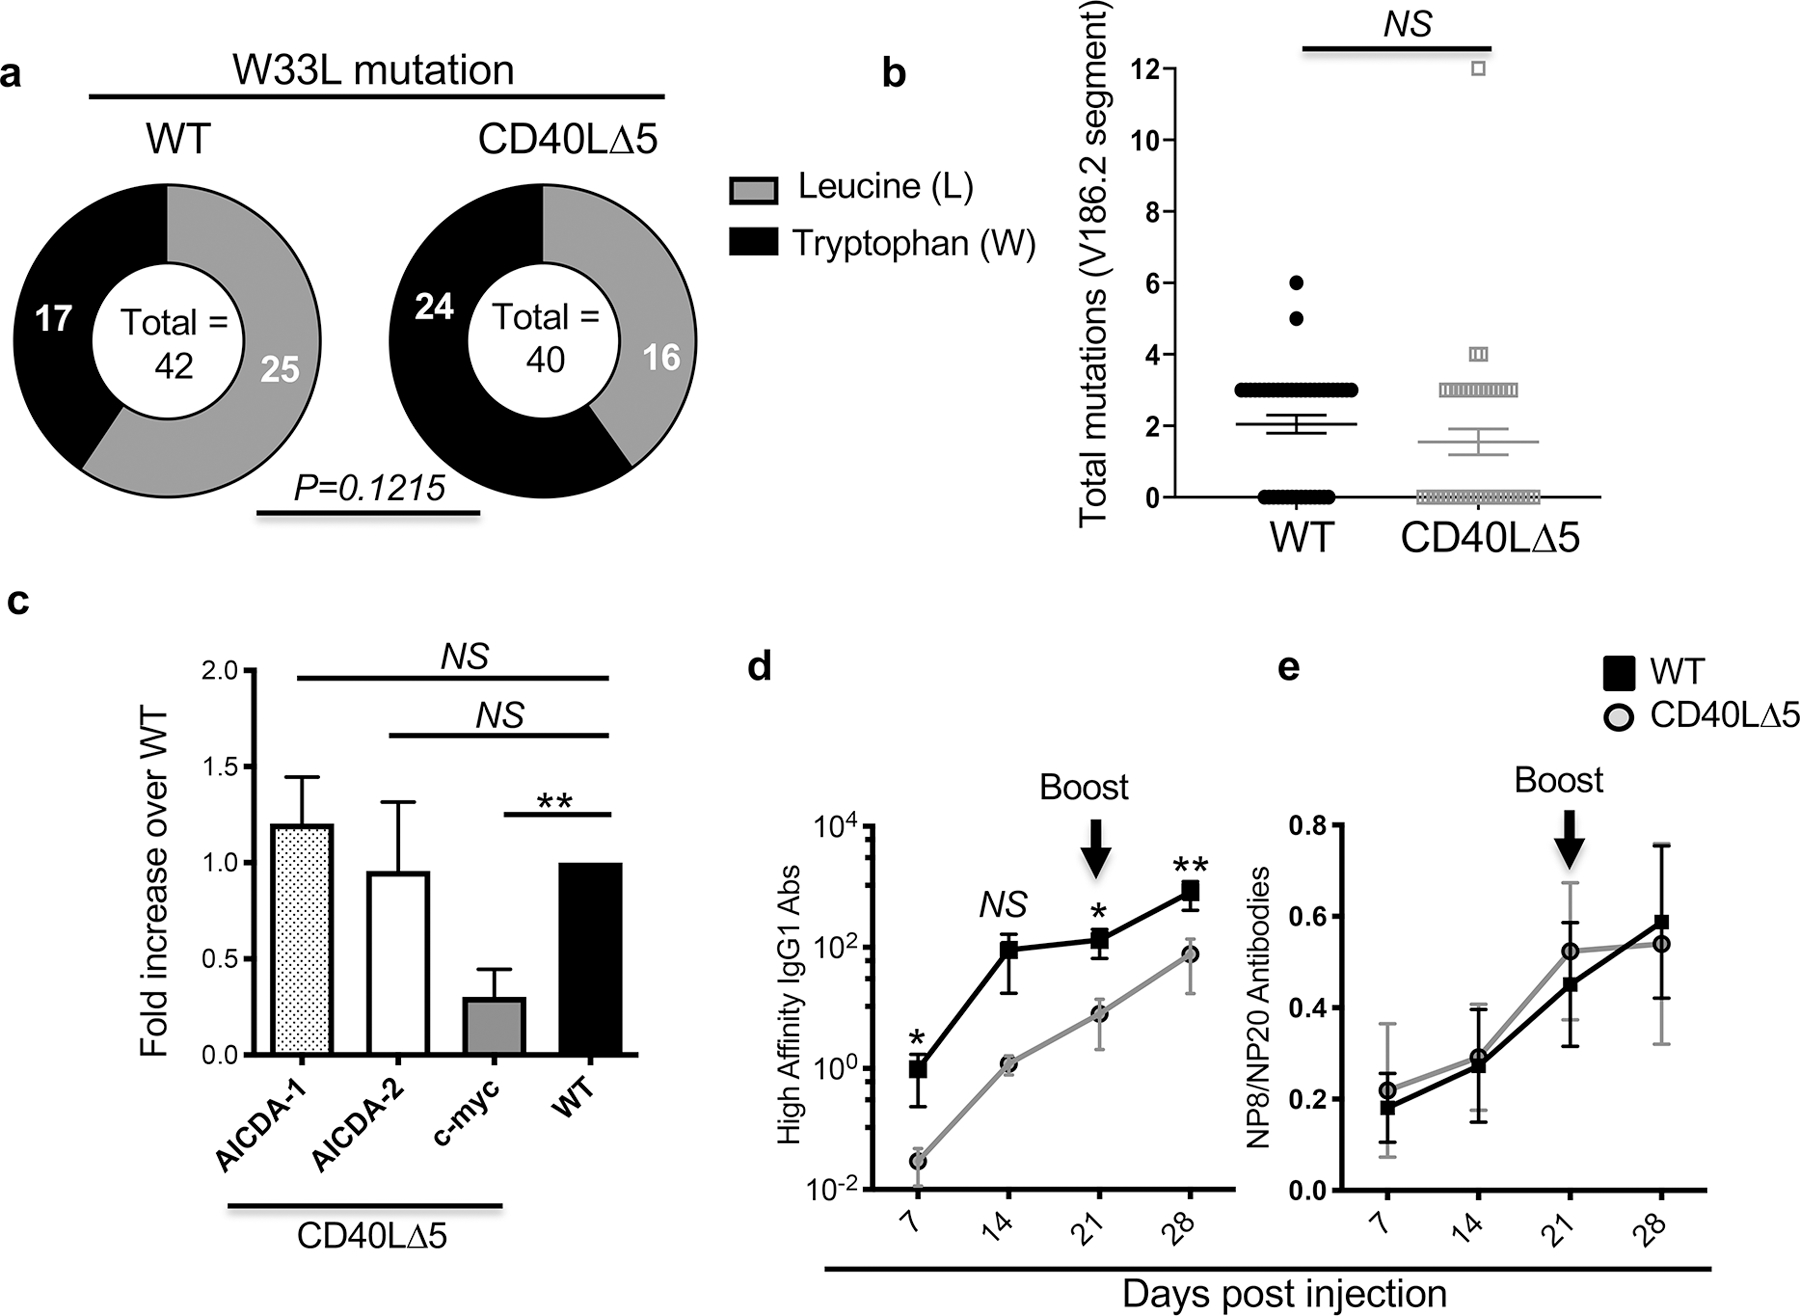
(a) V186.2/Cγ1 specific cDNA was generated using PNA+ B cells from WT and CD40L∆5 mice 14 days after immunization with NP-KLH. Sequences in V186.2 encoding TTG (leucine (L), light gray bar) at codon 33 represent high affinity VH regions whereas sequences with TGG (tryptophan (W), dark bars) represent unmutated sequences. (b) Graphical representation of total nucleotide changes in the VH186.2 gene (293bp) 14 days after immunization. The geometric mean and s.e.m. are indicated. (c) Levels of Aicda RNA and c-myc in PNA+ B cells from WT and CD40L∆5 mice were determined by RT-qPCR (n=3–5 independent experiments). Numerical results were normalized to expression of GAPDH and values from CD40L∆5 samples were compared to those of WT (which were set to 1). (d) Sera was collected from mice (n=10) at days 7, 14, 21, and 28 post immunization/boost and analyzed by ELISA using NP8-BSA to identify high affinity antibodies IgG1. The right graph shows the serum titer of antibodies and the left graph shows the percentage of high affinity antibodies for WT and CD40L∆5 mice. For statistical analysis of codon 33 mutations in the VH186.2 gene, a two-tailed Fisher’s Exact Test was used with a significance level of *P≤0.05. Statistical significance of total mutations identified in the VH186.2 gene was determined using an unpaired, two-tailed t-test with significance determined at *P ≤ 0.05 and **P≤ 0.01. NS = not significant. Significance of c and d was determined using an unpaired, students two-tailed t-test with significance determined at *P ≤ 0.05 and **P< 0.01. NS = not significant.
Since there was no apparent effect of a lowered threshold of CD40L expression on SHM we next asked whether there was a general loss of affinity matured antibodies relative to total antibodies. CD40L∆5 and WT mice were again immunized with NP-KLH and analyzed by ELISA at four time points for the production of anti-NP antibodies. NP-BSA conjugates with a low or high number of haptens per BSA molecule were used as antigens to establish the degree of ongoing affinity maturation (54, 55). Similar to our findings that examined the total spectrum of antibody responses (Figs. 5a and b) the overall high affinity IgG1 antibody response was significantly reduced in the CD40L∆5 mice. However, the ratio of high affinity to total Ab was not significantly different (Figs. 6d and e). Therefore, the higher threshold of CD40L expression is critical for the expansion of the high affinity B cells in the GC but is not absolutely required for SHM or for affinity maturation.
The CD40L stability pathway is required for the optimal development of plasma cells
We next asked whether the CD40L stability pathway also impacted downstream fate decisions that resulted in the differentiation of functional B cell sub-populations. We first analyzed the B220+ antibody-secreting cells (ASCs) that re-express CD138 upon differentiation into plasmablasts in splenocytes at day 8 after SRBC injection. As predicted by the loss of GC B cells in CD40L∆5 mice, we observed a significant decline in the absolute number of B220+CD138+ cells (plasmablasts) as well as a decrease in the frequency of plasmablasts within the B220+ population (Fig. 7a). We extended this analysis to compare numbers and percentages of both IgM and IgG1 plasmablasts that expressed CD138 and were positive for intracellular Ig. As shown in Figs. 7b and 7c, an approximate 3-fold reduction in both the total number and percentage of IgM plasmablasts was observed in CD40L∆5 mice. Further analysis of the B220+IgMneg cells for expression of intracellular IgG1 and surface CD138 identified a significant decline in the IgG1-expressing plasmablasts in both total number and percentage (Fig. 7d). Finally, to determine whether observed differences in splenic populations between WT and CD40L∆5 mice were maintained in the long-lived plasma cells (LLPCs) resident in the bone marrow and defined as B220+CD93+CD138+, mice were immunized with SRBC and bone marrow cells harvested. Similar to our findings with splenic plasma cell subsets, both the number (1.0x10^3 vs. 2.5x10^3) and percentage (~0.8% vs. 3.3%) of LLPCs relative to total bone marrow B220+ cells were decreased in CD40L∆5 mice relative to WT controls, respectively (Fig. 7e).
Figure 7: Decreased number and percentage of plasma cell subsets in the CD40L∆5 mice.
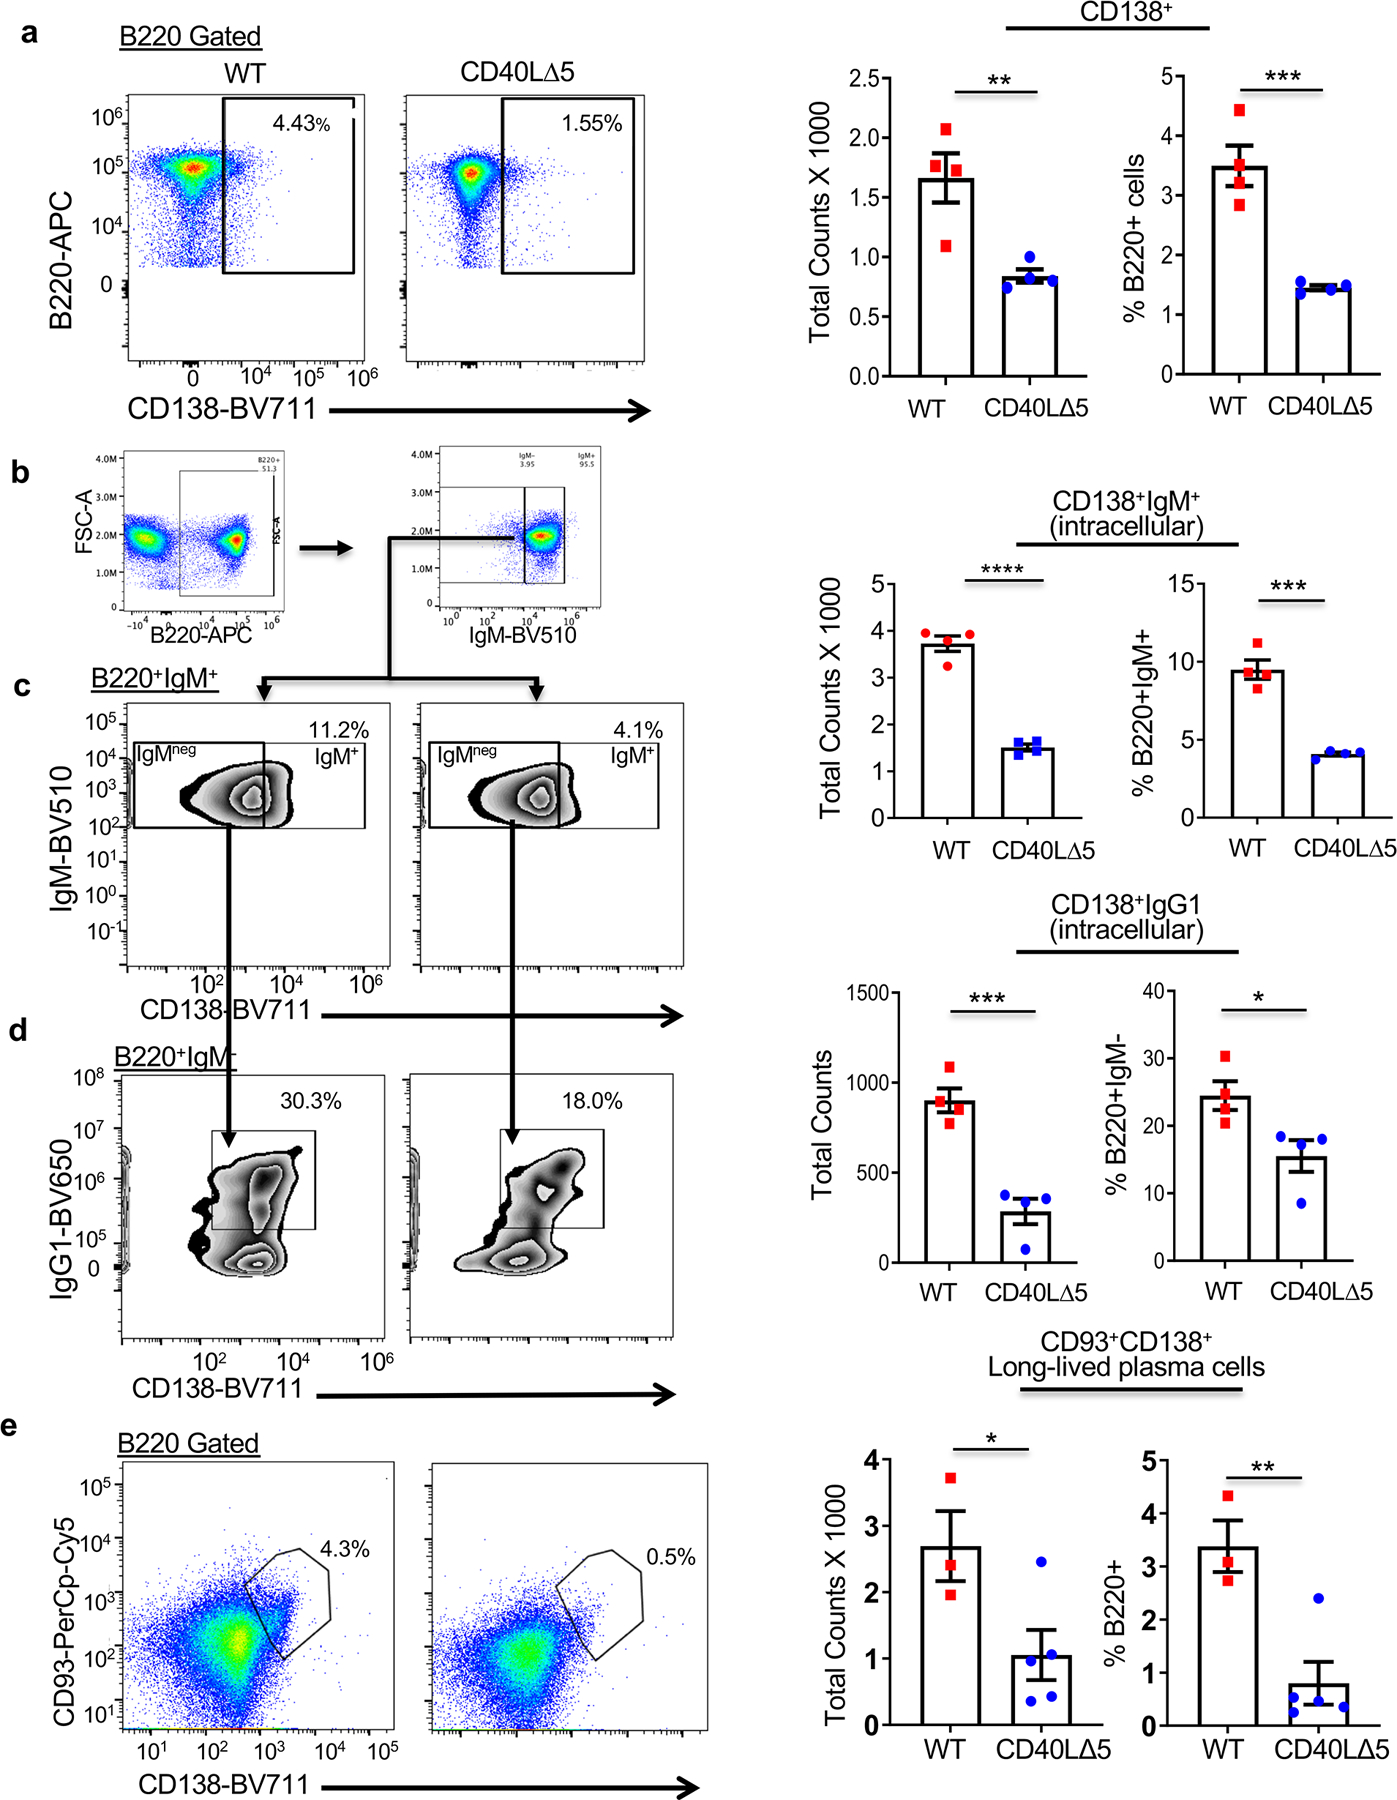
(a) Representative flow cytometric analysis of B220+CD138+ plasma cells from WT and CD40L∆5 spleens, 8 days post SRBC immunization and graphical representation of compiled data from individual mice showing the total number and percentage of plasma cells (right graphs). (b) Gating scheme for splenic subsets shown in (c) and (d). (c) Representative flow cytometry (left panels) and compiled data (right graphs) of the total number and frequency of B220+CD138+IgM+ cells from WT and CD40L∆5 spleens, eight days post SRBC immunization (N=4). (d) A representative analysis of B220+IgMneg cells showing expression of CD138+ (x-axis) and IgG1+ (y-axis) (left panels) and compiled data indicating number and frequency of IgG1+ plasma cells from WT and mutant spleens 8 days post SRBC injection (right graphs). (e) Representative flow analysis of B220+CD138+CD93+ LLPCs from WT and CD40L∆5 spleens, 8 days post SRBC immunization (left histograms). Compiled data of individual mice (right graphs, WT, N = 3, and CD40LΔ5, N=5) showing the total counts and the percentage of CD138+CD93+ cells within the B220+ bone marrow population. In all graphs the center value denotes the mean and error bars denote s.e.m. (right panel). Significance determined by unpaired, two-tailed t-test with *P ≤ 0.05, **P ≤ 0.01, ***P ≤ 0.001, and ****P≤ 0.0001.
Altered CD40L expression has a disproportionate impact on memory B cells
To investigate the role of the CD40L stability pathway on the development of (CD19+CD38+IgG1+) precursor memory B cells, mice were analyzed after SRBC injection and analyzed for both the number and percentage of switched IgG1+ B cells. Similar to our finding with plasma cells there was a significant decrease overall in precursor memory B cells from CD40L∆5 mice (Figs. 8a and b). Given that memory B cells can include different isotypes including IgM+ cells (56–59), we sought to determine whether differences were observed in switched and unswitched subpopulations from CD40L∆5 and WT mice. Additionally, we wanted to assess expression of PD-L2, CD80 and CD73, three surface markers, which define developmental and functional heterogeneous populations within the memory B cell compartment (59, 60). In all PD-L2, CD80 and CD73 precursor subsets defined by either IgG1 or IgM, we found a decrease in the total number of cells from mice expressing the CD40L∆5 mutation (Figs. 8d and 8f (upper graphs). The overall decrease in numbers of all precursor subsets were consistent with the loss of GC B cells in the CD40L∆5 mice. However, the percentage loss of IgG1+ and IgM+ B cells was not anticipated and this loss was only seen in the precursor subsets defined by markers CD80 or CD73, and not PD-L2 (Figs. 8c and 8c, 8d and f, lower graphs). The striking decline of precursor memory B cells of both IgM and IgG1 subsets, strongly suggests that a threshold of CD40L expression on CD4 T cells is critical for the development of memory B cells regardless of whether the cell has undergone class switching. These results also indicate that cells that fail to enter a plasma cell developmental pathway are not necessarily shunted into a memory pathway and thus, the differentiation of both B cell effector subpopulations appears to be exquisitely sensitive to a higher threshold of CD40L that depends on mRNA stability.
Figure 8: CD40L∆5 mice have a significantly lower percentage of splenic pre-memory cells.
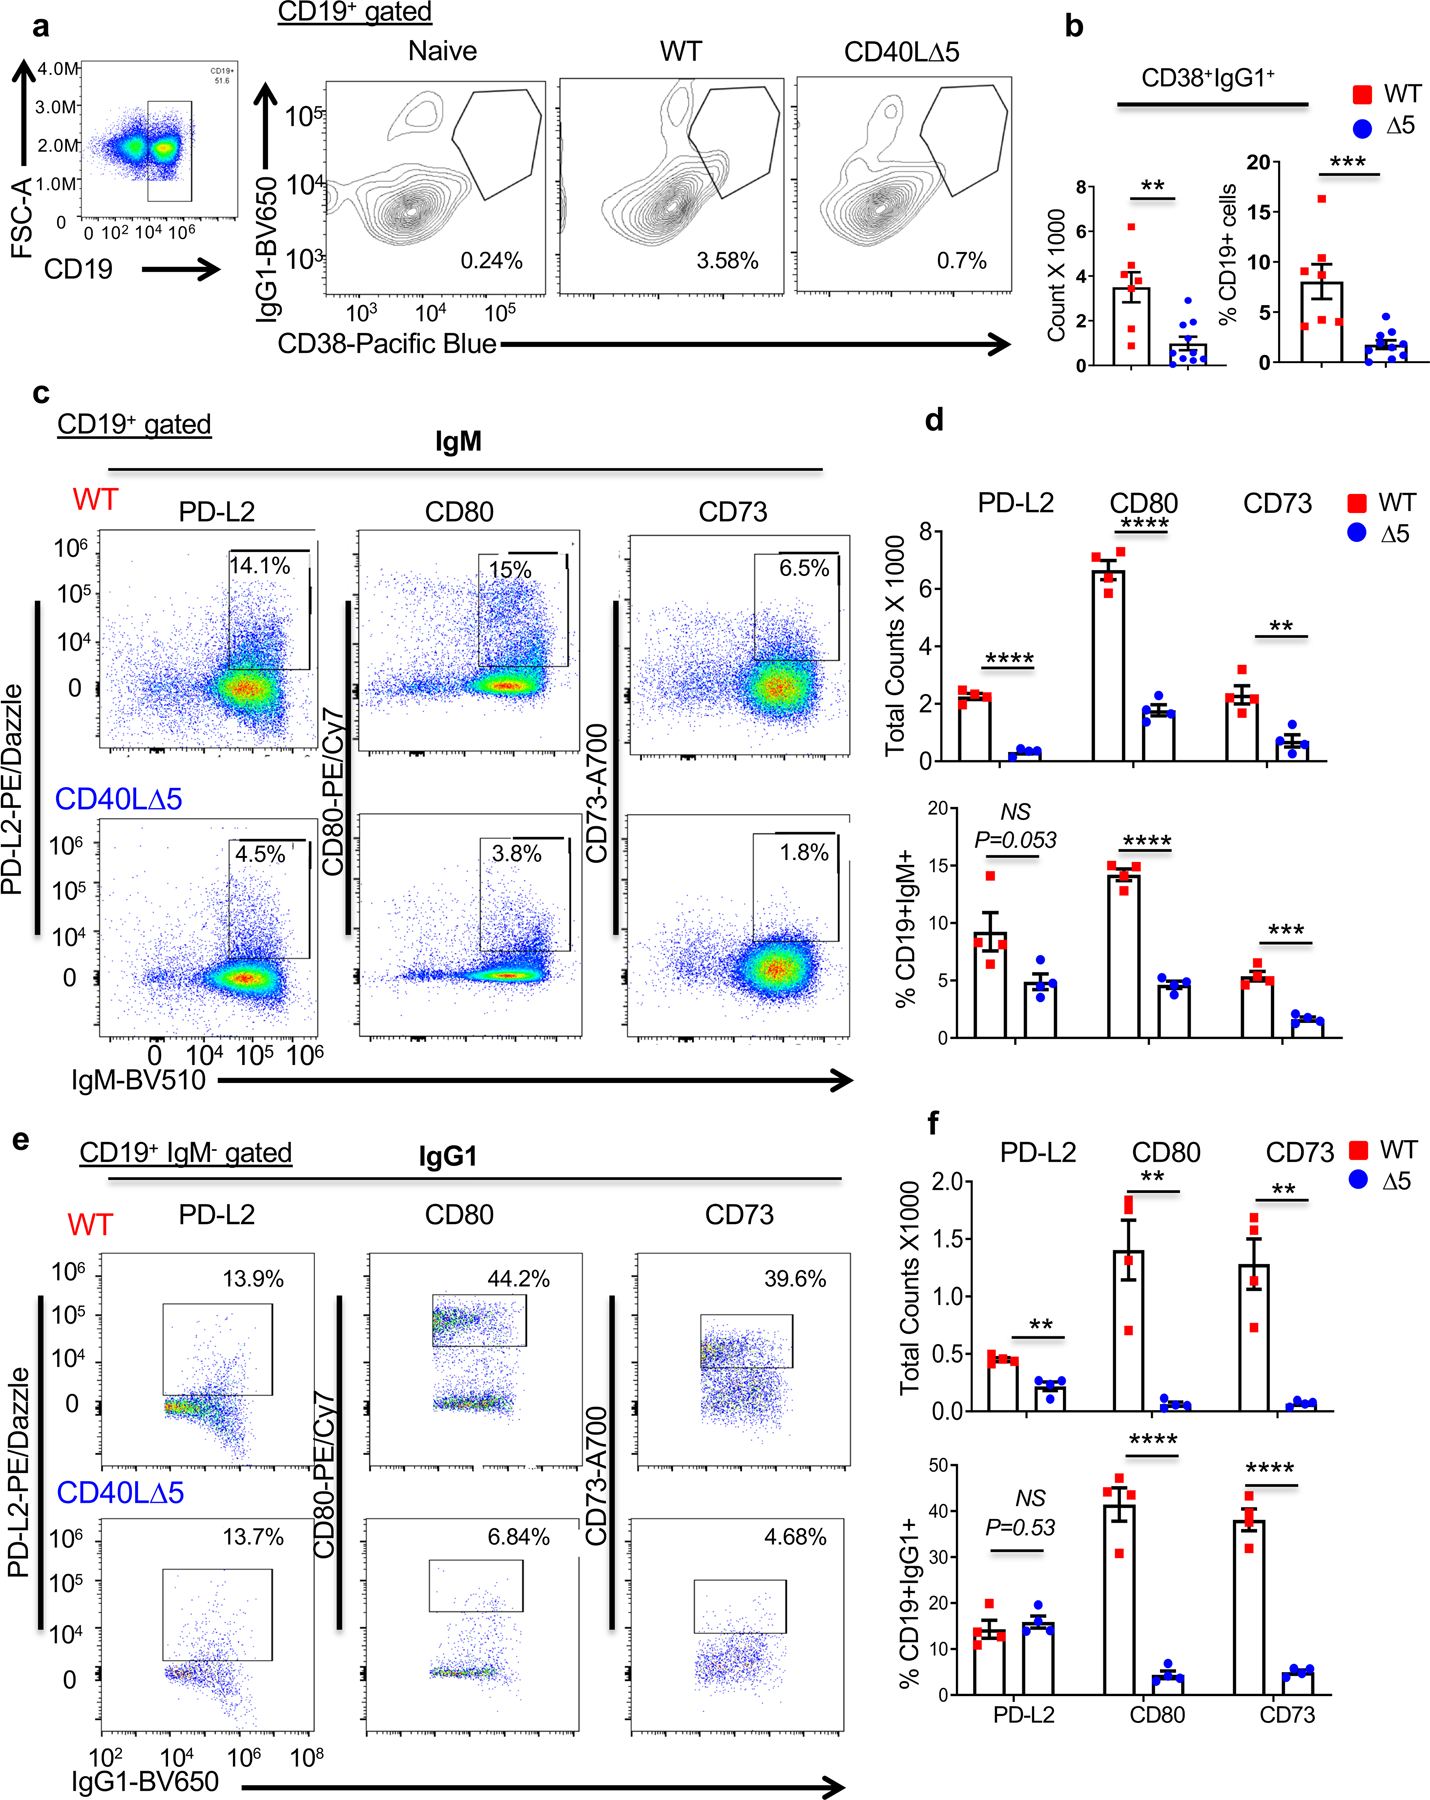
(a) Representative flow cytometric analysis of IgG1+CD38+CD19+ precursor memory cells from WT and CD40L∆5 spleens, 8 days post SRBC immunization and (b) graphical representation of individual mice showing the total cell counts and the percentage of CD19+ B cells. (c) Representative flow cytometry analysis of WT (top row) and CD40L∆5 (bottom row) splenic IgM B cell precursor memory subsets expressing markers PD-L2, CD80 and CD73. (d) Graphical representation of total cell counts (top graph) and the frequency of each subgroup (bottom graph). (e) CD19+IgMnegIgG1+ cells evaluated for expression of PD-L2, CD80 and CD73 (N = 4) and (f) data presented as total counts and frequency. In all graphs center values denote the mean and error bars denote s.e.m. Determination of significance was carried out by unpaired, two-tailed t-test where *P ≤ 0.05, **P ≤ 0.01, ***P ≤ 0.001, ****P ≤ 0.0001 and NS = not significant.
Discussion
It has long been known that CD40 signaling is central to the development of a GC response and the multiple studies that analyzed deficiencies in either CD40 or CD40L established the groundwork for understanding the mechanistic basis for the development of humoral immunity (61). In this study we sought to extend the binary understanding of CD40 signaling by using a mouse model that provides reduced levels of CD40L through a change in mRNA stabilization. The model was predicated on previous work showing that the CD40L mRNA is stabilized through the binding of PTBP1-containing complexes to a region of the 3’UTR (27, 36, 37). These complexes include other RNA-binding proteins including, nucleolin, as well as potentially other as yet identified proteins. Notably, we found that the optimization of many primary and secondary TD B cell responses relies on a threshold level of surface CD40L that is directly linked to enhanced mRNA stability. Whereas the elimination of the stability pathway results in a reduction of CD40L expression on TFH cells by approximately 40%, the overall impact of this decrease on antibody output and the development of effector B cell subsets is considerably more pronounced. Our data strongly suggests that this disproportionate response corresponds to the combined effects of limited cellular expansion linked to proliferation defects in antigen-selected B cells, increased apoptosis in GC B cells as well as reduced differentiation of GL7+ B cells into plasmablasts and memory precursor cells.
Although many of the cell populations and effector molecules in CD40L∆5 mice were greatly affected by the decrease in CD40L expression, we also found little to no effect on other functional processes. For example, primary IgM and secondary IgG3 antibody levels were similar between CD40L∆5 and WT mice, which is consistent with results showing that patients with hyper-IgM syndrome mount IgM responses to TD antigens and mice lacking CD40L express both IgM and IgG3 within a range of normal (61, 62). Also, CSR to all IgG and IgA heavy chain genes was intact in B cells from CD40L∆5 mice although the serum titer of primary and secondary IgG1, IgG2a, -2b and 2c and the secondary IgM antibodies was significantly lower due to fewer numbers of ASC in the B cell pool. The fact that CD40L∆5 mice were capable of undergoing CSR is consistent with reports showing that CSR occurs primarily as extrafollicular events prior to B cell seeding of the GC (63). Thus, the disruption in the GC architecture observed in CD40L∆5 B cells appears to have little impact on class switching, per se and the decline in the number of switched cells is likely associated with a loss of proliferative capacity via interactions with CD4 T cells expressing lower levels of CD40L in the extrafollicular space. It has yet to be determined whether the severe loss of ASCs is a byproduct of decreased CD40 signaling needed to drive a specific number of cell divisions linked to class switching and/or the requirement for these signals in the subsequent clonal expansion of the isotype switched B cells (64, 65).
We also found that both SHM and affinity maturation were relatively normal in B cells from CD40L∆5 mice although the absolute number of cells expressing high affinity mutations in their BCRs was reduced. This is consistent with SHM occurring in association with proliferation in the DZ and reflects the severe loss of resident GL7+ B cells in this compartment. The finding of WT levels of somatically mutated sequences in GC B cells from CD40L∆5 mice is further supported by our observation that the level of Aicda RNA in these cells was similar to WT cells (66, 67). It may be that SHM can occur in DZ B cells in response to the lower threshold of CD40-CD40L signals received by the LZ B cells or alternatively SHM is able to function in the absence of CD40 signaling altogether. Support for this second possibility comes from studies demonstrating that B cells from patients with Hyper-IgM syndrome undergo SHM via a CD40-CD40L independent pathway (68, 69).
T cell help is considered to be the limiting factor in GC B cell selection and TFH cells have been shown to express a comparatively low level of CD40L (18, 19, 70). Furthermore, enhanced TFH interactions with LZ B cells accelerates S phase and directly corresponds to the number of cell divisions and mutations that will occur during a single selection cycle (19). The proto-oncogene c-myc is essential for GC B cells to efficiently integrate CD40 signals leading to functional outcomes including positive selection and cyclic re-entry of LZ B cells, (52, 53, 71). Importantly, c-myc expression in GC B cells is tightly controlled by CD40L expression on TFH cells and the absolute amount of MYC expressed in GC LZ B cells determines the subsequent number of cell divisions in the DZ (72). Our data showing that the diminished population of GC B cells from CD40L∆5 mice express only 25% of the c-myc RNA levels found in WT cells agrees with these findings. Finally, the loss of GL7+ B cells in the DZ may also be explained, in part, by enhanced apoptosis in both regions of the GC given that apoptosis has been shown to be the “default” pathway for GC B cells (73, 74).
The impact of decreased CD40L expression was observed on cell fate decisions within the GC affecting both the plasmablast and precursor memory B cell subsets. Our results showing that the percentage of B cells expressing memory markers was significantly reduced in CD40L∆5 mice was highly unexpected given published findings reported that B memory cells have lower numbers of mutations in their BCRs. Additionally, B memory cells were found to exit the GC response at earlier iterations compared to their plasma cell counterparts (75). We anticipated, given the decreased cycling rate and higher representation in the LZ, that B cells from CD40L∆5 mice would potentially enter the memory pool at a higher frequency than WT cells. Surprisingly, the exact opposite was observed suggesting that the loss of differentiation into precursor memory B cells could be a result of an overall breakdown in the GC architecture that may be needed for driving the development of effector subsets. Alternatively, reducing the level of CD40 signaling may impact other critical factors such as IL-4 and IL-21, which are known to be required for driving the differentiation of GC B cells (76). Also, reduced c-myc expression would have a highly detrimental impact on B cell positive selection in the GC (52, 53, 71). Our results showing a significant decline in the percentage of both CD80+ and CD73+ IgM and IgG1 precursor memory cells are consistent with those of Koike, et. al who described the need for strong CD40 signaling in the primary immune response to establish a CD80hi B memory subset (77). It is unclear why the PD-L2+ subset was less sensitive to changes in CD40L expression but may reflect the ability of precursors to partially differentiate down a memory pathway in the absence of strong CD40 signals. That the CD80hi memory cells have been identified as being part of the larger PD-L2 population may suggest that further differentiation into this population requires higher or extended levels of CD40 signaling provided by message stability (60). In future experiments we will test our findings using a system that can directly identify and follow antigen-selected B cells over a longer time course to understand whether the CD40L∆5 defect results in a long-term suppression of B cell memory.
In conclusion, our findings provide novel, mechanistic insights into how CD40L expression is regulated to sustain its role as a critical checkpoint modulator within the GC environment. The regulated pathway of CD40L mRNA stability is clearly necessary for multiple steps required for expanding and diversifying the TD humoral response including the generation of ASCs, precursor memory B cells and plasma cells. Questions related to sustained differences in antibody output in long-lived GCs from mutant and WT mice as well as the impact on antigen-specific memory B cell formation will be addressed in future work. Additionally, this model will be used to understand how limiting CD40L through mRNA regulation may impact disease pathogenesis in autoimmune conditions where T cells frequently express CD40L at a consistently unregulated level.
Supplementary Material
mRNA stability is critical for optimal CD40L expression and TFH cell function
Decreased CD40L results in a loss of GL7+ GC B cells and a disorganized GC
GC B cell differentiation is particularly sensitive to CD40L signaling thresholds
Acknowledgements
We thank D. Sant’Angelo for critically reading this manuscript and for his many helpful discussions and insight. We acknowledge M. Kiledjian as well as past and present lab members of the Covey lab for valuable contributions to this project. pEasy Flox was a gift from Klaus Rajewsky.
References
- 1.Garside P, Ingulli E, Merica RR, Johnson JG, Noelle RJ, and Jenkins MK. 1998. Visualization of specific B and T lymphocyte interactions in the lymph node. Science 281: 96–99. [DOI] [PubMed] [Google Scholar]
- 2.Okada T, Miller MJ, Parker I, Krummel MF, Neighbors M, Hartley SB, O’Garra A, Cahalan MD, and Cyster JG. 2005. Antigen-engaged B cells undergo chemotaxis toward the T zone and form motile conjugates with helper T cells. PLoS Biol 3: e150. [DOI] [PMC free article] [PubMed] [Google Scholar]
- 3.Foy TM, Shepherd DM, Durie FH, Aruffo A, Ledbetter JA, and Noelle RJ. 1993. In vivo CD40-gp39 interactions are essential for thymus-dependent humoral immunity. II. Prolonged suppression of the humoral immune response by an antibody to the ligand for CD40, gp39. J Exp Med 178: 1567–1575. [DOI] [PMC free article] [PubMed] [Google Scholar]
- 4.Van den Eertwegh AJ, Noelle RJ, Roy M, Shepherd DM, Aruffo A, Ledbetter JA, Boersma WJ, and Claassen E. 1993. In vivo CD40-gp39 interactions are essential for thymus-dependent humoral immunity. I. In vivo expression of CD40 ligand, cytokines, and antibody production delineates sites of cognate T-B cell interactions. Journal of Experimental Medicine 178: 1555–1565. [DOI] [PMC free article] [PubMed] [Google Scholar]
- 5.Erickson LD, Durell BG, Vogel LA, O’Connor BP, Cascalho M, Yasui T, Kikutani H, and Noelle RJ. 2002. Short-circuiting long-lived humoral immunity by the heightened engagement of CD40. J Clin Invest 109: 613–620. [DOI] [PMC free article] [PubMed] [Google Scholar]
- 6.Elgueta R, Benson MJ, de Vries VC, Wasiuk A, Guo Y, and Noelle RJ. 2009. Molecular mechanism and function of CD40/CD40L engagement in the immune system. Immunol Rev 229: 152–172. [DOI] [PMC free article] [PubMed] [Google Scholar]
- 7.Bolduc A, Long E, Stapler D, Cascalho M, Tsubata T, Koni PA, and Shimoda M. 2010. Constitutive CD40L expression on B cells prematurely terminates germinal center response and leads to augmented plasma cell production in T cell areas. J Immunol 185: 220–230. [DOI] [PMC free article] [PubMed] [Google Scholar]
- 8.Zhang TT, Gonzalez DG, Cote CM, Kerfoot SM, Deng S, Cheng Y, Magari M, and Haberman AM. 2017. Germinal center B cell development has distinctly regulated stages completed by disengagement from T cell help. Elife 6. [DOI] [PMC free article] [PubMed] [Google Scholar]
- 9.Breitfeld D, Ohl L, Kremmer E, Ellwart J, Sallusto F, Lipp M, and Forster R. 2000. Follicular B helper T cells express CXC chemokine receptor 5, localize to B cell follicles, and support immunoglobulin production. J Exp Med 192: 1545–1552. [DOI] [PMC free article] [PubMed] [Google Scholar]
- 10.Schaerli P, Willimann K, Lang AB, Lipp M, Loetscher P, and Moser B. 2000. CXC chemokine receptor 5 expression defines follicular homing T cells with B cell helper function. J Exp Med 192: 1553–1562. [DOI] [PMC free article] [PubMed] [Google Scholar]
- 11.Kim CH, Rott LS, Clark-Lewis I, Campbell DJ, Wu L, and Butcher EC. 2001. Subspecialization of CXCR5+ T cells: B helper activity is focused in a germinal center-localized subset of CXCR5+ T cells. J Exp Med 193: 1373–1381. [DOI] [PMC free article] [PubMed] [Google Scholar]
- 12.Choi YS, Kageyama R, Eto D, Escobar TC, Johnston RJ, Monticelli L, Lao C, and Crotty S. 2011. ICOS receptor instructs T follicular helper cell versus effector cell differentiation via induction of the transcriptional repressor Bcl6. Immunity 34: 932–946. [DOI] [PMC free article] [PubMed] [Google Scholar]
- 13.Crotty S 2014. T follicular helper cell differentiation, function, and roles in disease. Immunity 41: 529–542. [DOI] [PMC free article] [PubMed] [Google Scholar]
- 14.Allen CD, Okada T, Tang HL, and Cyster JG. 2007. Imaging of germinal center selection events during affinity maturation. Science 315: 528–531. [DOI] [PubMed] [Google Scholar]
- 15.Liu D, Xu H, Shih C, Wan Z, Ma X, Ma W, Luo D, and Qi H. 2015. T-B-cell entanglement and ICOSL-driven feed-forward regulation of germinal centre reaction. Nature 517: 214–218. [DOI] [PubMed] [Google Scholar]
- 16.Dufaud CR, McHeyzer-Williams LJ, and McHeyzer-Williams MG. 2017. Deconstructing the germinal center, one cell at a time. Curr Opin Immunol 45: 112–118. [DOI] [PMC free article] [PubMed] [Google Scholar]
- 17.McHeyzer-Williams LJ, Pelletier N, Mark L, Fazilleau N, and McHeyzer-Williams MG. 2009. Follicular helper T cells as cognate regulators of B cell immunity. Curr Opin Immunol 21: 266–273. [DOI] [PMC free article] [PubMed] [Google Scholar]
- 18.Victora GD, Schwickert TA, Fooksman DR, Kamphorst AO, Meyer-Hermann M, Dustin ML, and Nussenzweig MC. 2010. Germinal center dynamics revealed by multiphoton microscopy with a photoactivatable fluorescent reporter. Cell 143: 592–605. [DOI] [PMC free article] [PubMed] [Google Scholar]
- 19.Gitlin AD, Shulman Z, and Nussenzweig MC. 2014. Clonal selection in the germinal centre by regulated proliferation and hypermutation. Nature 509: 637–640. [DOI] [PMC free article] [PubMed] [Google Scholar]
- 20.Mesin L, Ersching J, and Victora GD. 2016. Germinal Center B Cell Dynamics. Immunity 45: 471–482. [DOI] [PMC free article] [PubMed] [Google Scholar]
- 21.Shlomchik MJ, and Weisel F. 2012. Germinal center selection and the development of memory B and plasma cells. Immunol Rev 247: 52–63. [DOI] [PubMed] [Google Scholar]
- 22.Allen CD, Okada T, and Cyster JG. 2007. Germinal-center organization and cellular dynamics. Immunity 27: 190–202. [DOI] [PMC free article] [PubMed] [Google Scholar]
- 23.Schwickert TA, Victora GD, Fooksman DR, Kamphorst AO, Mugnier MR, Gitlin AD, Dustin ML, and Nussenzweig MC. 2011. A dynamic T cell-limited checkpoint regulates affinity-dependent B cell entry into the germinal center. J Exp Med 208: 1243–1252. [DOI] [PMC free article] [PubMed] [Google Scholar]
- 24.Ramesh N, Morio T, Fuleihan R, Worm M, Horner A, Tsitsikov E, Castigli E, and Geha RS. 1995. CD40-CD40 ligand (CD40L) interactions and X-linked hyperIgM syndrome (HIGMX-1). Clin Immunol Immunopathol 76: S208–213. [DOI] [PubMed] [Google Scholar]
- 25.Ford GS, Barnhart B, Shone S, and Covey LR. 1999. Regulation of CD154 (CD40 ligand) mRNA stability during T cell activation. J Immunol 162: 4037–4044. [PubMed] [Google Scholar]
- 26.Hamilton BJ, Genin A, Cron RQ, and Rigby WF. 2003. Delineation of a novel pathway that regulates CD154 (CD40 ligand) expression. Mol Cell Biol 23: 510–525. [DOI] [PMC free article] [PubMed] [Google Scholar]
- 27.Vavassori S, Shi Y, Chen CC, Ron Y, and Covey LR. 2009. In vivo post-transcriptional regulation of CD154 in mouse CD4+ T cells. Eur J Immunol 39: 2224–2232. [DOI] [PMC free article] [PubMed] [Google Scholar]
- 28.Matus-Nicodemos R, Vavassori S, Castro-Faix M, Valentin-Acevedo A, Singh K, Marcelli V, and Covey LR. 2011. Polypyrimidine tract-binding protein is critical for the turnover and subcellular distribution of CD40 ligand mRNA in CD4+ T cells. J Immunol 186: 2164–2171. [DOI] [PMC free article] [PubMed] [Google Scholar]
- 29.Kafasla P, Mickleburgh I, Llorian M, Coelho M, Gooding C, Cherny D, Joshi A, Kotik-Kogan O, Curry S, Eperon IC, Jackson RJ, and Smith CW. 2012. Defining the roles and interactions of PTB. Biochem Soc Trans 40: 815–820. [DOI] [PubMed] [Google Scholar]
- 30.Romanelli MG, Diani E, and Lievens PM. 2013. New insights into functional roles of the polypyrimidine tract-binding protein. Int J Mol Sci 14: 22906–22932. [DOI] [PMC free article] [PubMed] [Google Scholar]
- 31.Mitchell SA, Spriggs KA, Coldwell MJ, Jackson RJ, and Willis AE. 2003. The Apaf-1 internal ribosome entry segment attains the correct structural conformation for function via interactions with PTB and unr. Mol Cell 11: 757–771. [DOI] [PubMed] [Google Scholar]
- 32.Petoukhov MV, Monie TP, Allain FH, Matthews S, Curry S, and Svergun DI. 2006. Conformation of polypyrimidine tract binding protein in solution. Structure 14: 1021–1027. [DOI] [PubMed] [Google Scholar]
- 33.Polydorides AD, Okano HJ, Yang YY, Stefani G, and Darnell RB. 2000. A brain-enriched polypyrimidine tract-binding protein antagonizes the ability of Nova to regulate neuron-specific alternative splicing. Proc Natl Acad Sci U S A 97: 6350–6355. [DOI] [PMC free article] [PubMed] [Google Scholar]
- 34.Coutinho-Mansfield GC, Xue Y, Zhang Y, and Fu XD. 2007. PTB/nPTB switch: a post-transcriptional mechanism for programming neuronal differentiation. Genes Dev 21: 1573–1577. [DOI] [PubMed] [Google Scholar]
- 35.Monzon-Casanova E, Matheson LS, Tabbada K, Zarnack K, Smith CW, and Turner M. 2020. Polypyrimidine tract-binding proteins are essential for B cell development. Elife 9. [DOI] [PMC free article] [PubMed] [Google Scholar]
- 36.Kosinski PA, Laughlin J, Singh K, and Covey LR. 2003. A Complex Containing Polypyrimidine Tract-Binding Protein Is Involved in Regulating the Stability of CD40 Ligand (CD154) mRNA. J Immunol 170: 979–988. [DOI] [PubMed] [Google Scholar]
- 37.Laughlin J, Oghlidos S, Porter JF, Matus-Nicodemos R, Sinquett FL, Marcelli V, and Covey LR. 2008. Functional analysis of a tripartite stability element within the CD40 ligand 3’ untranslated region. Immunology 124: 368–379. [DOI] [PMC free article] [PubMed] [Google Scholar]
- 38.Hamilton BJ, Wang XW, Collins J, Bloch D, Bergeron A, Henry B, Terry BM, Zan M, Mouland AJ, and Rigby WF. 2008. Separate cis-trans pathways post-transcriptionally regulate murine CD154 (CD40 ligand) expression: a novel function for CA repeats in the 3’-untranslated region. J Biol Chem 283: 25606–25616. [DOI] [PMC free article] [PubMed] [Google Scholar]
- 39.La Porta J, Matus-Nicodemos R, Valentin-Acevedo A, and Covey LR. 2016. The RNA-Binding Protein, Polypyrimidine Tract-Binding Protein 1 (PTBP1) Is a Key Regulator of CD4 T Cell Activation. PLoS One 11: e0158708. [DOI] [PMC free article] [PubMed] [Google Scholar]
- 40.Schenten D, Gerlach VL, Guo C, Velasco-Miguel S, Hladik CL, White CL, Friedberg EC, Rajewsky K, and Esposito G. 2002. DNA polymerase kappa deficiency does not affect somatic hypermutation in mice. Eur J Immunol 32: 3152–3160. [DOI] [PubMed] [Google Scholar]
- 41.Koguchi Y, Thauland TJ, Slifka MK, and Parker DC. 2007. Preformed CD40 ligand exists in secretory lysosomes in effector and memory CD4+ T cells and is quickly expressed on the cell surface in an antigen-specific manner. Blood 110: 2520–2527. [DOI] [PMC free article] [PubMed] [Google Scholar]
- 42.Vavassori S, and Covey LR. 2009. Post-transcriptional regulation in lymphocytes: the case of CD154. RNA Biol 6: 259–265. [DOI] [PMC free article] [PubMed] [Google Scholar]
- 43.Foy TM, Laman JD, Ledbetter JA, Aruffo A, Claassen E, and Noelle RJ. 1994. gp39-CD40 interactions are essential for Germinal center formation and the development of B cell memory. Journal of Experimental Medicine 180: 157–163. [DOI] [PMC free article] [PubMed] [Google Scholar]
- 44.Laszlo G, Hathcock KS, Dickler HB, and Hodes RJ. 1993. Characterization of a novel cell-surface molecule expressed on subpopulations of activated T and B cells. J Immunol 150: 5252–5262. [PubMed] [Google Scholar]
- 45.Allen CD, and Cyster JG. 2008. Follicular dendritic cell networks of primary follicles and germinal centers: phenotype and function. Semin Immunol 20: 14–25. [DOI] [PMC free article] [PubMed] [Google Scholar]
- 46.Allen CD, Ansel KM, Low C, Lesley R, Tamamura H, Fujii N, and Cyster JG. 2004. Germinal center dark and light zone organization is mediated by CXCR4 and CXCR5. Nat Immunol 5: 943–952. [DOI] [PubMed] [Google Scholar]
- 47.Hans F, and Dimitrov S. 2001. Histone H3 phosphorylation and cell division. Oncogene 20: 3021–3027. [DOI] [PubMed] [Google Scholar]
- 48.Jacob J, Kassir R, and Kelsoe G. 1991. In situ studies of the primary immune response to (4-hydroxy-3-nitrophenyl)acetyl. I. The architecture and dynamics of responding cell populations. J Exp Med 173: 1165–1175. [DOI] [PMC free article] [PubMed] [Google Scholar]
- 49.Jacob J, and Kelsoe G. 1992. In situ studies of the primary immune response to (4-hydroxy-3-nitrophenyl)acetyl. II. A common clonal origin for periarteriolar lymphoid sheath-associated foci and germinal centers. J Exp Med 176: 679–687. [DOI] [PMC free article] [PubMed] [Google Scholar]
- 50.Allen D, Simon T, Sablitzky F, Rajewsky K, and Cumano A. 1988. Antibody engineering for the analysis of affinity maturation of an anti-hapten response. EMBO J 7: 1995–2001. [DOI] [PMC free article] [PubMed] [Google Scholar]
- 51.Furukawa K, Akasako-Furukawa A, Shirai H, Nakamura H, and Azuma T. 1999. Junctional amino acids determine the maturation pathway of an antibody. Immunity 11: 329–338. [DOI] [PubMed] [Google Scholar]
- 52.Calado DP, Sasaki Y, Godinho SA, Pellerin A, Kochert K, Sleckman BP, de Alboran IM, Janz M, Rodig S, and Rajewsky K. 2012. The cell-cycle regulator c-Myc is essential for the formation and maintenance of germinal centers. Nat Immunol 13: 1092–1100. [DOI] [PMC free article] [PubMed] [Google Scholar]
- 53.Dominguez-Sola D, Victora GD, Ying CY, Phan RT, Saito M, Nussenzweig MC, and Dalla-Favera R. 2012. The proto-oncogene MYC is required for selection in the germinal center and cyclic reentry. Nat Immunol 13: 1083–1091. [DOI] [PMC free article] [PubMed] [Google Scholar]
- 54.Herzenberg LA, Tokuhisa T, and Herzenberg LA. 1980. Carrier-priming leads to hapten-specific suppression. Nature 285: 664–667. [DOI] [PubMed] [Google Scholar]
- 55.Shimizu T, Oda M, and Azuma T. 2003. Estimation of the relative affinity of B cell receptor by flow cytometry. J Immunol Methods 276: 33–44. [DOI] [PubMed] [Google Scholar]
- 56.Shlomchik MJ, and Weisel F. 2012. Germinal centers. Immunol Rev 247: 5–10. [DOI] [PubMed] [Google Scholar]
- 57.Klein U, Kuppers R, and Rajewsky K. 1997. Evidence for a large compartment of IgM-expressing memory B cells in humans. Blood 89: 1288–1298. [PubMed] [Google Scholar]
- 58.Zuccarino-Catania G, and Shlomchik M. 2015. Adoptive Transfer of Memory B Cells. Bio Protoc 5. [DOI] [PMC free article] [PubMed] [Google Scholar]
- 59.Zuccarino-Catania GV, Sadanand S, Weisel FJ, Tomayko MM, Meng H, Kleinstein SH, Good-Jacobson KL, and Shlomchik MJ. 2014. CD80 and PD-L2 define functionally distinct memory B cell subsets that are independent of antibody isotype. Nat Immunol 15: 631–637. [DOI] [PMC free article] [PubMed] [Google Scholar]
- 60.Tomayko MM, Steinel NC, Anderson SM, and Shlomchik MJ. 2010. Cutting edge: Hierarchy of maturity of murine memory B cell subsets. J Immunol 185: 7146–7150. [DOI] [PMC free article] [PubMed] [Google Scholar]
- 61.van Kooten C 2000. Immune regulation by CD40-CD40-l interactions - 2; Y2K update. Front Biosci 5: D880–693. [DOI] [PubMed] [Google Scholar]
- 62.Xu J, Foy TM, Laman JD, Elliott EA, Dunn JJ, Waldschmidt TJ, Elsemore J, Noelle RJ, and Flavell RA. 1994. Mice deficient for the CD40 Ligand. Immunity 1: 423–431. [DOI] [PubMed] [Google Scholar]
- 63.Roco JA, Mesin L, Binder SC, Nefzger C, Gonzalez-Figueroa P, Canete PF, Ellyard J, Shen Q, Robert PA, Cappello J, Vohra H, Zhang Y, Nowosad CR, Schiepers A, Corcoran LM, Toellner KM, Polo JM, Meyer-Hermann M, Victora GD, and Vinuesa CG. 2019. Class-Switch Recombination Occurs Infrequently in Germinal Centers. Immunity 51: 337–350 e337. [DOI] [PMC free article] [PubMed] [Google Scholar]
- 64.Tangye SG, Ferguson A, Avery DT, Ma CS, and Hodgkin PD. 2002. Isotype switching by human B cells is division-associated and regulated by cytokines. J Immunol 169: 4298–4306. [DOI] [PubMed] [Google Scholar]
- 65.Tangye SG, and Hodgkin PD. 2004. Divide and conquer: the importance of cell division in regulating B-cell responses. Immunology 112: 509–520. [DOI] [PMC free article] [PubMed] [Google Scholar]
- 66.Sheppard EC, Morrish RB, Dillon MJ, Leyland R, and Chahwan R. 2018. Epigenomic Modifications Mediating Antibody Maturation. Front Immunol 9: 355. [DOI] [PMC free article] [PubMed] [Google Scholar]
- 67.Zan H, and Casali P. 2015. Epigenetics of Peripheral B-Cell Differentiation and the Antibody Response. Front Immunol 6: 631. [DOI] [PMC free article] [PubMed] [Google Scholar]
- 68.Chu YW, Marin E, Fuleihan R, Ramesh N, Rosen FS, Geha RS, and Insel RA. 1995. Somatic mutation of human immunoglobulin V genes in the X-linked HyperIgM syndrome. J Clin Invest 95: 1389–1393. [DOI] [PMC free article] [PubMed] [Google Scholar]
- 69.Weller S, Faili A, Garcia C, Braun MC, Le Deist FF, de Saint Basile GG, Hermine O, Fischer A, Reynaud CA, and Weill JC. 2001. CD40-CD40L independent Ig gene hypermutation suggests a second B cell diversification pathway in humans. Proc Natl Acad Sci U S A 98: 1166–1170. [DOI] [PMC free article] [PubMed] [Google Scholar]
- 70.Casamayor-Palleja M, Khan M, and MacLennan IC. 1995. A subset of CD4+ memory T cells contains preformed CD40 ligand that is rapidly but transiently expressed on their surface after activation through the T cell receptor complex. J Exp Med 181: 1293–1301. [DOI] [PMC free article] [PubMed] [Google Scholar]
- 71.Luo W, Weisel F, and Shlomchik MJ. 2018. B Cell Receptor and CD40 Signaling Are Rewired for Synergistic Induction of the c-Myc Transcription Factor in Germinal Center B Cells. Immunity 48: 313–326 e315. [DOI] [PMC free article] [PubMed] [Google Scholar]
- 72.Finkin S, Hartweger H, Oliveira TY, Kara EE, and Nussenzweig MC. 2019. Protein Amounts of the MYC Transcription Factor Determine Germinal Center B Cell Division Capacity. Immunity 51: 324–336 e325. [DOI] [PMC free article] [PubMed] [Google Scholar]
- 73.Victora GD, and Nussenzweig MC. 2012. Germinal centers. Annu Rev Immunol 30: 429–457. [DOI] [PubMed] [Google Scholar]
- 74.Mayer CT, Gazumyan A, Kara EE, Gitlin AD, Golijanin J, Viant C, Pai J, Oliveira TY, Wang Q, Escolano A, Medina-Ramirez M, Sanders RW, and Nussenzweig MC. 2017. The microanatomic segregation of selection by apoptosis in the germinal center. Science 358. [DOI] [PMC free article] [PubMed] [Google Scholar]
- 75.Kaji T, Ishige A, Hikida M, Taka J, Hijikata A, Kubo M, Nagashima T, Takahashi Y, Kurosaki T, Okada M, Ohara O, Rajewsky K, and Takemori T. 2012. Distinct cellular pathways select germline-encoded and somatically mutated antibodies into immunological memory. J Exp Med 209: 2079–2097. [DOI] [PMC free article] [PubMed] [Google Scholar]
- 76.Weinstein JS, Herman EI, Lainez B, Licona-Limon P, Esplugues E, Flavell R, and Craft J. 2016. TFH cells progressively differentiate to regulate the germinal center response. Nat Immunol 17: 1197–1205. [DOI] [PMC free article] [PubMed] [Google Scholar]
- 77.Koike T, Harada K, Horiuchi S, and Kitamura D. 2019. The quantity of CD40 signaling determines the differentiation of B cells into functionally distinct memory cell subsets. Elife 8. [DOI] [PMC free article] [PubMed] [Google Scholar]
Associated Data
This section collects any data citations, data availability statements, or supplementary materials included in this article.