Abstract
Background and Objectives:
Liver metastases might not be detected by computed tomography (CT) and magnetic resonance imaging (MRI) due to their small size, but they can be detected by EUS. Furthermore, EUS-FNA has a significant impact on improving the diagnostic accuracy of EUS. The purpose of this study was to assess the feasibility of EUS in detection of occult small hepatic focal lesions at the time of primary tumor staging, not seen by CT or MRI.
Methods:
This prospective study included 730 patients who underwent EUS for staging or sampling of gastrointestinal, pancreatic, or thoracic malignancy. The liver was examined thoroughly for detection of occult lesions. CT or MRI was done within 1 week of EUS examination.
Results:
EUS examination of the liver detected focal lesions in 150 patients (20.5%) and metastases in 118 patients (16.2%); meanwhile, CT and MRI detected focal lesions in 99 patients (13.6%) and metastases in 82 patients (11.2%). EUS missed focal lesions in 7 patients, 6 of which were liver metastases (1.0% and 0.8%, respectively), while CT and MRI missed focal lesions in 58 patients, 42 of which were metastases (7.9% and 5.8%, respectively), which were detected by EUS.
Conclusion:
Thorough dedicated EUS examination of the liver is a feasible useful tool for detection of small hepatic lesions missed by CT and MRI. It is not considered an extra financial burden to the patient or health-care system because those patients are indicated for EUS examination for evaluation of their original lesion in the first place. Furthermore, EUS-FNA can add another advantage in diagnosing the etiology of such lesions.
Keywords: computed tomography, EUS, EUS-FNA, liver metastasis, magnetic resonance imaging, occult liver lesions
INTRODUCTION
As the most common site of metastases for pancreatic, gastrointestinal (GI), and thoracic malignancies, the liver must be properly evaluated for the presence of such lesions.[1] The accurate identification of hepatic metastases at the time of diagnosis is crucial to the patient management plan, which hopefully provides the opportunity for a radical resection and subsequently prolongs survival; therefore, the radiologic evaluation of the liver is usually considered an essential issue for the complete staging, management, and prognosis of primary tumors.[2]
Noninvasive imaging techniques, such as abdominal ultrasound (US), dynamic computed tomography (CT), and magnetic resonance imaging (MRI), have been considered the optimum noninvasive methods to scan the liver for any structural abnormalities, either primary or secondary neoplastic lesions. However, they have a limited ability to detect hepatic lesions smaller than 1 cm. Nowadays, it is an EUS evolution from a merely diagnostic to an interventional technique.[3] With the ongoing improvements of imaging modalities, EUS imaging of the liver is considered a better modality than ordinary noninvasive imaging methods with the superadded benefit of the possibility to obtain tissue for cytopathological evaluation via EUS-FNA.[4,5]
The discovery of a previously undetected liver metastasis could have a major impact on staging of malignancy and changing the management plan.[6] Therefore, it is of utmost importance to select an imaging modality with the highest sensitivity for detection of such occult metastases.
Overall, especially in the setting of EUS-FNA, EUS has a good safety profile with limited complications, such as infection, hemorrhage, bile peritonitis, perforation, and seeding of malignant cells, which should be assessed prior to the intervention on an individual basis weighing procedural risk versus clinical impact; the absolute contraindications of EUS are similar with those of conventional advanced endoscopy procedures.[7] A systematic review analysis reported only 0.02% and 0.98% for EUS-related mortality and EUS-FNA-related morbidity, respectively.[8,9] Accordingly, EUS-FNA is considered a safe procedure, especially in cases where the percutaneous approach is difficult or inaccessible.[10]
EUS-FNA of hepatic focal lesions is considered a practical and safe approach with high diagnostic accuracy, especially if combined with Doppler, elastography,[11] harmonic imaging, and contrast enhancement.[12] Indeed, the contrast-enhanced EUS (CE-EUS) allows better evaluation of the vascularity of the lesion, through real-time depiction of microvessels and parenchymal perfusion without Doppler-related artifacts that could help to improve the characterization of the lesion and increase the diagnostic yield of EUS-FNA.[13,14]
EUS elastography has a potential role in differentiating benign from malignant liver lesions and could be used to determine which lesion requires FNA as a guide to target EUS-guided sampling.[15] It also has the advantage of better evaluation regardless of the presence of ascites or thickened abdominal wall.[16]
PATIENTS AND METHODS
Study design and aims
This single tertiary referral center prospective observational study aimed primarily to assess the feasibility of EUS in detection of occult hepatic focal lesions at the time of local tumor staging not seen by CT or MRI. The secondary aim was to assess the accuracy of EUS detection of hepatic focal lesions compared to CT or MRI.
Patients and recruitment
Candidates were recruited from the Gastroenterology, Endoscopy and Hepatology Unit in Kasr Al-Ainy, which is considered a tertiary referral center for hepatogastroenterology in the Internal Medicine Department of the Faculty of Medicine, Cairo University, over a 3-year period. All patients underwent EUS examination for staging or sampling of suspected or known pancreatic, GI, or thoracic malignancy. Patients were statistically included only after histopathologic confirmation of malignancy. All included patients were above 18 years of age. Those who refused to participate, had a bleeding tendency, or were contraindicated for anesthesia were excluded from the study. The study was approved by our institution’s Research Ethical Committee, and all patients gave their informed written consent before inclusion in the study, according to the ethical guidelines of the 1975 Declaration of Helsinki.
Examination procedure
All included patients had a liver imaging modality performed within a week of EUS, including abdominal US, CT, MRI, or positron emission tomography. EUS was done for all patients with detailed and thorough examination of the primary tumor and the liver segments for detection of liver metastases [Figure 1].
Figure 1.
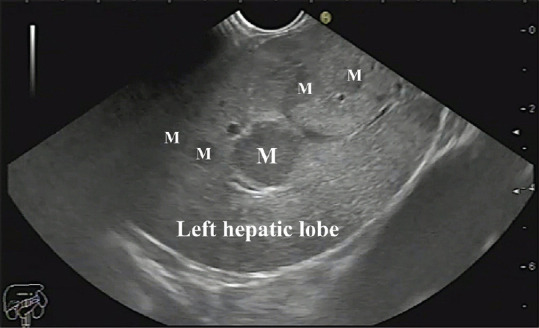
Multiple metastatic lesions in segments II and III of the left lobe of the liver. M: Metastasis
EUS examination was performed using a linear Echoendoscope Pentax EG3870UTK (HOYA Corporation, PENTAX Life Care Division, Showanomori Technology Center) connected to an US unit Hitachi AVIUS machine (Hitachi Medical Systems). All examinations were done under deep sedation with intravenous (IV) propofol. For EUS-FNA [Figure 2], we used Cook 22G needles (Echotip, Wilson-Cook).
Figure 2.
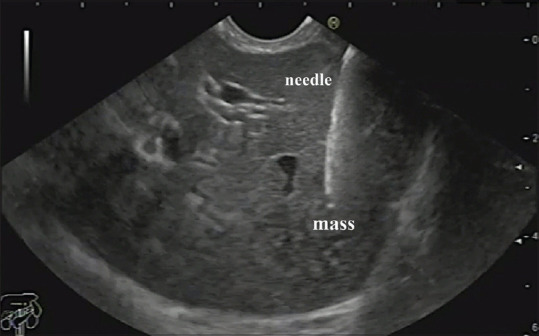
EUS-FNA of a liver mass
Detailed examination of liver segments was done from the stomach and the duodenum.
Scanning from the stomach
The linear echoendoscope is located just below the cardia; then, the scope is gently manipulated until our landmark is visualized which is the inferior vena cava (IVC) and the right hepatic vein which can be recognized by having the widest diameter at its joining part with the IVC with gradual tapering as it goes inside the liver parenchyma [Figure 3].
Figure 3.
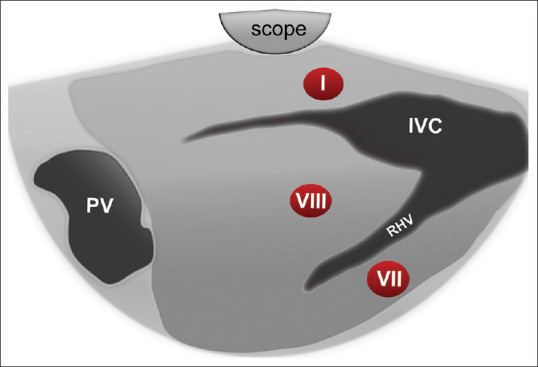
Diagram of EUS segmental anatomy at the level of inferior vena cava and right hepatic vein. IVC: Inferior Vena Cava; RHV: Right Hepatic Vein; PV: Portal Vein
At this sonographic plane, segment I (caudate lobe) is localized between the tip of the echoendoscope and IVC, segment VIII is localized between the IVC and the adjoining part of the right hepatic vein, while part of segment VII is located below the right hepatic vein [Figure 3].
On counterclockwise rotation, two structures will be identified; the first one is the ligamentum venosum that extends from the umbilical portion (UP) of the left photovoltaic (PV) to the IVC. The second structure is the middle hepatic vein (MHV) with a uniform diameter throughout its whole length and finally joins the IVC. Three hepatic segments are visualized in this view: segment I (caudate lobe), which is located between the scope and ligamentum venosum, segment IVa between the ligamentum venosum and MHV, and segment VIII lying below MHV [Figure 4].
Figure 4.
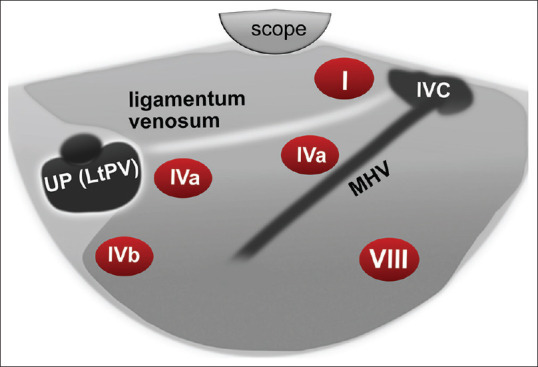
Diagram of EUS segmental anatomy at the level of inferior vena cava and middle hepatic vein. IVC: Inferior Vena Cava; MHV: Middle Hepatic Vein; UP: Umbilical Portion; LtPV: Left Portal vein
With more counterclockwise rotation, the left hepatic vein is visualized traversing the left lateral part of the left lobe separating segment II (closer to the probe) from III [Figure 5].
Figure 5.
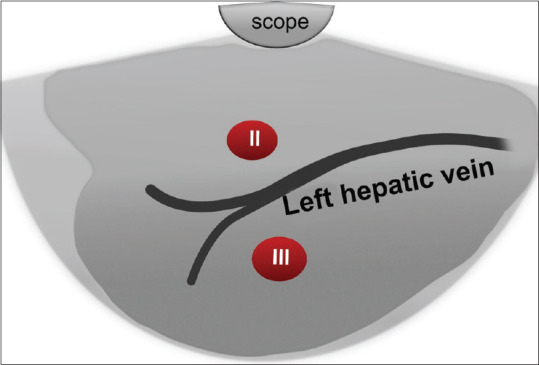
Diagram of EUS segmental anatomy at the level of inferior vena cava and left hepatic vein
The UP of the left PV represents a significant landmark (fish eye appearance) that can be located by tracing the ligamentum venosum from the IVC to the UP of the left PV by pushing the scope downward with slight counterclockwise rotation. At this point, segment IVa is located above, and IVb is located below the junction of the ligamentum venosum and UP of left PV [Figure 4]. Further pushing the echoendoscope forward will lead to the visualization of the ligamentum teres. Segment IVb is visible below this structure, while segment III is located between it and the echoendoscope [Figure 6].
Figure 6.
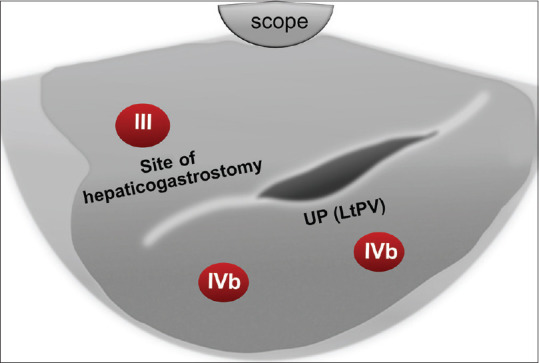
Diagram of EUS segmental anatomy at the level of the left portal vein (fish eye appearance) and ligamentum teres. UP: Umbilical Portion; LtPV: Left Portal vein
Scanning from the duodenal bulb
The landmark in the duodenal bulb is the portal venous confluence formed by the superior mesenteric vein coming from the right side of the screen to join the splenic vein coming from below to form the main PV going up and to the left of the screen. Then, the echoendoscope is slow and gentle pushing forward against the superior duodenal angle will form a J-shaped configuration. By gradual and gentle counterclockwise rotation with slight upward deflection, the main PV can be traced till its bifurcation into the right branch going up and left one going down away from the scope, with segment IV located in between the two branches. Further counterclockwise rotation allows tracing the right branch of PV on the upper part of the screen to its anterior branch observed on the left part of the screen (with segments V up and VIII down) while the posterior branch will be observed on the right part of the screen (with parts of segment VI up and VII down) [Figure 7]. By more gentle counterclockwise rotation in the bulb, the gallbladder can be displayed, and the liver parenchyma located directly below it belongs to segment IV [Figure 8].
Figure 7.
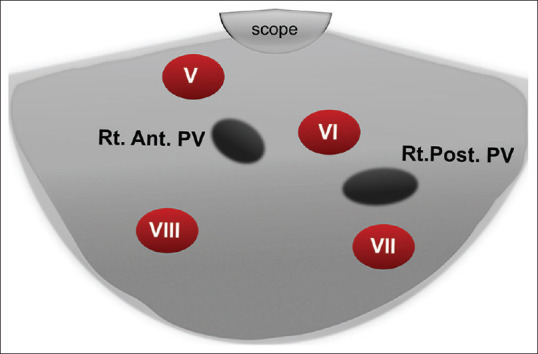
Diagram of the right anterior and right posterior portal vein and segments V, VI, VII, and VIII of the liver as seen from the duodenal bulb. Rt. Ant. PV: Right Anterior Portal vein; Rt. Post. PV: Right Posterior Portal vein
Figure 8.
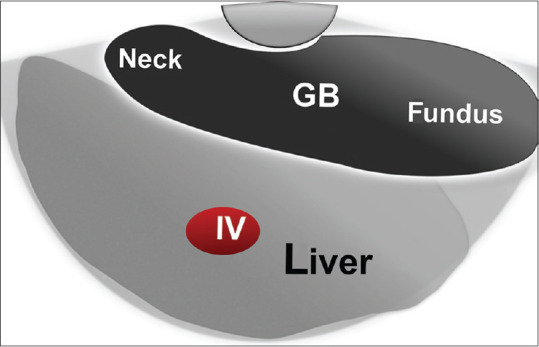
Diagram of linear EUS anatomy of the gallbladder and segment IV of the liver as seen from the duodenal bulb. GB: Gall Bladder
Strain elastograms of masses were qualitatively evaluated with a stepwise scoring system, according to the prevalent color in the nodule. We used the scoring system based on the breast strain US elastography scale of Itoh et al. It includes four different patterns. Masses with scores 1 and 2 are considered benign, and those with scores 3 and 4 are classified as suspicious for malignancy.[17]
The semi-quantitative score of elastography was represented by the strain ratio method [Figure 9]. Two areas were selected, area (A), representing the region of interest, and area (B), representing the normal area. Area (B) was then divided by area (A). For masses with a homogeneous pattern of elasticity, area A was chosen from any region, but for those with heterogeneous patterns, area A was chosen to cover all heterogeneous areas as much as possible. Both areas were manually selected according to these criteria. Furthermore, multiple measures of strain ratio were taken, and the median of these measures was recorded and considered for statistical analysis. Subsequently, the best cutoff value was calculated and used for the calculation of diagnostic value.
Figure 9.
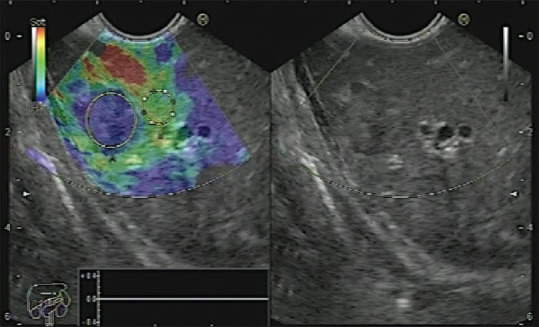
Liver metastasis with Grade 4 elasticity score and high strain ratio denoting its firm consistency
EUS examination was done by a single operator, who was blinded to any clinical, radiological, or cytopathological findings regarding the presence or absence of hepatic focal lesions to give the best results and avoid bias.
There were no major complications as severe bleeding or pancreatitis following EUS-FNA, but there were mild side effects, namely abdominal pain in 22 patients out of 543 patients with primary pancreatic masses and one case of minor self-limiting bleeding inside a pancreatic body mucinous cystic neoplasm after withdrawal of the 22G FNA needle. The pain was relieved within 48 h by giving simple analgesics without the need of hospital admission.
Statistical analysis
Data management and analysis were performed using the Statistical Package for the Social Sciences (SPSS) version 25 (Nie, Bent & Hull, 1970). Numerical data were summarized using means and standard deviations (SDs) or medians and/or ranges, as appropriate. Categorical data were summarized as numbers and percentages. Estimates of the frequency were done using the numbers and percentages. Numerical data were explored for normality using the Kolmogorov–Smirnov test and Shapiro–Wilk test.
To measure association between variables, the following steps were taken:
Chi-square or Fisher’s test was used to compare independent groups with respect to categorical data
Kappa statistics were used to test for agreement between categorical variables, with values ranging from 0 to 1
Comparisons between two groups for nonnormally distributed numeric variables were made using the Mann–Whitney U-test
P ≤ 0.05 is considered significant.
RESULTS
This study included 730 patients, with a mean age of 53 years ± 7 SD; 416 (57%) were males and 314 (43%) were females. Although pancreatic tumors were evaluated most commonly, there was a wide variety of primary tumors [Table 1]. Liver metastasis was the most common focal lesion [Table 2].
Table 1.
Final diagnosis of the malignant primary mass
| Final diagnosis of the primary mass | 730 patients |
|---|---|
| Pancreatic tumors | 543 |
| Adenocarcinoma | 485 |
| Neuroendocrine tumors | 22 |
| IPMN | 22 |
| Mucinous cystic neoplasms | 3 |
| SPPN | 11 |
| Gastric tumors | 77 |
| GIST | 50 |
| Adenocarcinoma | 24 |
| Carcinoid | 3 |
| Cholangiocarcinoma | 32 |
| Distal cholangiocarcinoma | 23 |
| Proximal cholangiocarcinoma | 9 |
| Papillary adenocarcinoma | 31 |
| Lymphoma | 27 |
| Duodenal masses | 11 |
| GIST | 6 |
| Adenocarcinoma | 3 |
| Carcinoid | 2 |
| Retroperitoneal | 5 |
| Peritoneal | 2 |
| Bronchogenic carcinoma | 2 |
IPMN: Intraductal papillary mucinous neoplasm; SPPN: Solid pseudopapillary neoplasm; GIST: Gastrointestinal stromal tumor
Table 2.
Final diagnosis of liver mass
| n (%) | |
|---|---|
| Final diagnosis of liver masses | 157 (100) |
| Metastasis | 124 (79.0) |
| Cholangitic abscess | 5 (3.2) |
| Focal fat depletion | 15 (9.5) |
| Simple hepatic cyst | 7 (4.5) |
| Hemangioma | 4 (2.5) |
| Lymphoma | 2 (1.3) |
The majority of the final diagnoses of primary and liver metastases were reached by EUS-FNA cytopathological examination (97.8% and 83.9%, respectively) [Table 3].
Table 3.
Method of diagnosis of primary tumor and liver masses
| Method of diagnosis of primary tumors | Total number: 730 (100%) |
|---|---|
| CT tru-cut biopsy | 3 (0.4) |
| Duodenoscopic biopsy | 5 (0.7) |
| EUS-FNA | 714 (97.8) |
| PET-CT | 33 (4.5) |
| Sonar | 102 (14) |
| Surgical excision | 2 (0.3) |
| Triphasic CT scan | 425 (58.2) |
|
| |
| Method of diagnosis of liver metastasis | Total number: 124 (100%) |
|
| |
| EUS | 14 (11.3) |
| EUS-FNA | 104 (83.9) |
| MRI | 30 (24.2) |
| PET scan | 18 (14.5) |
| Sonar tru-cut biopsy | 4 (3.2) |
| Surgical exploration | 1 (0.8) |
| Triphasic CT | 52 (41.9) |
| CT guided tru-cut biopsy | 3 (2.4) |
A single lesion can be diagnosed by more than one modality. CT: Computed tomography; PET: Positron emission tomography; MRI: Magnetic resonance imaging
The EUS examination of the liver detected focal lesions in 150 patients (20.5%) [Figures 10-12] and metastases in 118 patients (16.2%); meanwhile, CT and MRI detected focal lesions in 99 patients (13.6%) and metastases in 82 patients (11.2%). EUS successfully identified hepatic lesions ranging in size from 2 mm to 55 mm in transverse diameter and 3 mm to 80 mm in longitudinal diameter (right lobe: n. 49 [32.7%], left lobe: n. 41 [27.3%], and bilobar: n. 60[40%]). Most of the detected lesions were multiple (67.5%) and in segments III and IV (35.5% and 31.2%, respectively).
Figure 10.
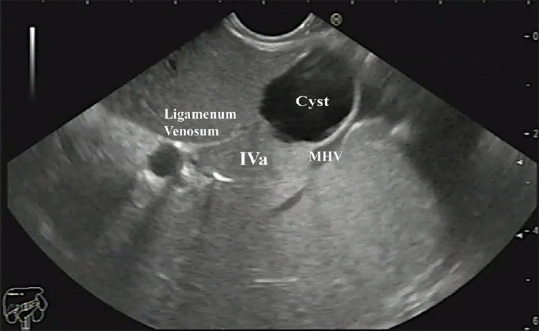
A simple cyst in segment IVa of the liver. MHV: Middle Hepatic Vein
Figure 12.
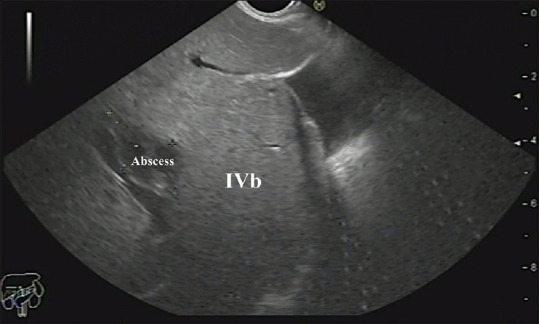
A cholangitic abscess in segment IVb of the liver
Figure 11.
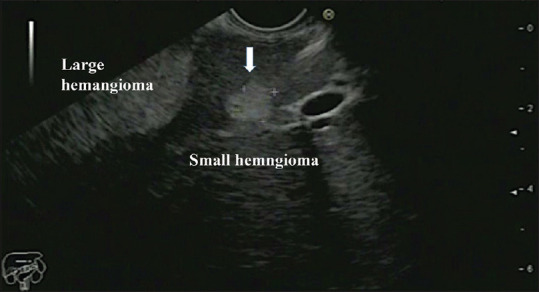
One large and one small hemangiomas in segment III of the liver
CT or MRI could not detect hepatic focal lesions or metastases in 58 patients (7.9%) and 42 patients (5.8%), respectively; meanwhile, it was detected by EUS. On the contrary, EUS could not detect focal lesions in 7 patients (1.0%), while they were detected by CT or MRI [Tables 4 and 5]. The 7 focal lesions missed by EUS (6 metastases and 1 simple cyst) were located in segments V (3 patients), VI (3 patients), and VII (1 patient). The median size of those 7 missed focal lesions was 16 mm for transverse and 20 mm for longitudinal diameter [Table 6], while the median transverse and longitudinal diameters for those not detected by CT or MRI (99 patients) were 12 mm and 15 mm, respectively [Table 7]. The median transverse and longitudinal diameters for metastatic focal lesions not detected by CT or MRI (82 patients) were 12 mm and 17 mm, respectively.
Table 4.
EUS and computed tomography in diagnosis of focal lesion
| Focal lesion by CT or MRI | Focal lesions by EUS | P | Kappa value | Interpretation | |
|---|---|---|---|---|---|
|
| |||||
| Yes, n (%)* | No, n (%) | ||||
| Yes | 92 (12.6) | 7 (1.0) | <0.001 | 0.68 | Moderate agreement |
| No | 58 (7.9) | 573 (78.5) | |||
*Percentage is calculated from the total number. CT: Computed tomography; MRI: Magnetic resonance imaging
Table 5.
EUS and computed tomography in diagnosis of liver metastasis
| Mets by CT or MRI | Mets by EUS | P | Kappa value | Interpretation | |
|---|---|---|---|---|---|
|
| |||||
| Yes, n (%)* | No, n (%) | ||||
| Yes | 76 (10.4) | 6 (0.8) | <0.001 | 0.72 | Moderate agreement |
| No | 42 (5.8) | 606 (83.0) | |||
*Percentage is calculated from the total number. CT: Computed tomography; MRI: Magnetic resonance imaging
Table 6.
Comparison between the size of hepatic focal lesions detected and missed by EUS
| Diameters (mm) | Focal lesions by EUS, median (range) | P | |
|---|---|---|---|
|
| |||
| Yes | No | ||
| Transverse diameter | 15 (2-55) | 16 (8-27) | 0.177 |
| Longitudinal diameter | 20 (3-80) | 20 (12-32) | 0.333 |
P<0.05 is considered significant
Table 7.
Comparison between the size of hepatic focal lesions detected and missed by computed tomography/magnetic resonance imaging
| Diameters (mm) | Focal lesion by CT or MRI, median (range) | P | |
|---|---|---|---|
|
| |||
| Yes | No | ||
| Transverse diameter | 17 (3-55) | 12 (2-45) | 0.002 |
| Longitudinal diameter | 20 (3-75) | 15 (3-80) | 0.002 |
P<0.05 is considered significant. CT: Computed tomography; MRI: Magnetic resonance imaging
Real-time elastography for the primary mass lesions revealed that there were 2 cases with score 1, 3 with score 2, 12 with score 3, and 57 with score 4; meanwhile, it revealed 2 cases with score 1, 3 with score 2, 1 with score 3, and 26 with score 4 for liver masses. The median of the strain ratio for the primary mass lesions was 12.4, while that of the liver mass lesions was 8.1, with a 0.9–53.0 and 0.9–80.3 range, respectively.
The majority of the final diagnoses of the liver masses were metastases in 124 (79.0%) followed by focal fat depletion in 12 patients (7.6%) [Table 6].
Overall, EUS results were in accordance (moderate agreement) with CT or MRI results for focal and metastatic liver lesions, with P < 0.001.
DISCUSSION
CT is considered the most widely available and acceptable noninvasive modality for detection of liver metastases and assessment of surgical resectability.[18] CT imaging has significantly improved with the introduction of multiple-detector CT, which enables high-resolution three-dimensional imaging and multiplanar image reformation or reconstruction. Alternatively, MRI may more reliably detect smaller, noncontour-deforming tumors compared with CT, especially when using contrast agents. The sensitivity of CT or MRI in detection of lesions >20 mm is similar at approximately 90% or more; this trustworthy figure dramatically drops as the size of lesions drops.
Transabdominal US and contrast-enhanced CT are the most widely used imaging modalities to evaluate focal liver lesions, as they are considered cheap and noninvasive methods with a detection rate up to 53%–71% and 68% for US and CT, respectively; however, the case seems different for smaller lesions (<1 cm), where the detection rate drops to 20% and 49% for US and CT, respectively.[19]
When comparing MRI to CT sensitivity in detection of smaller lesions, it becomes 71.1%–87.3% versus 65.7%–78.4% for lesions between 10 mm and 20 mm, respectively, and as low as 38.0%–55.4% versus 26.1%–47.3%, respectively, for lesions ≤10 mm.[20,21]
Contrary to CT and MRI, EUS, despite being an operator-dependent modality, could be the most sensitive tool in detection of hepatic focal lesions if it is used carefully with meticulous systematic examination by an expert endosonographer, especially for lesions <20 mm. EUS and EUS-guided sampling show superiority over CT in detecting small liver metastases with a diagnostic yield between 80% and 98% with a substantial effect on clinical management.[7] EUS has also a great role in the staging of GI and thoracic malignancies, as it provides data about depth of invasion (T stage) and regional lymph node involvement (N stage) and allows for FNA and biopsy of such lesions. EUS can also be used to screen patients for metastatic disease, especially to the liver, and enables easier and safer tissue acquisition for confirmatory pathologic diagnosis.
EUS-guided tissue sampling can be performed by FNA (EUS-FNA) or by EUS-guided fine-needle biopsy (EUS-FNB). They are well-established techniques for tissue acquisition in lesions in and around the GI tract and considered safe and effective methods to achieve definitive cytological diagnoses and to plan therapeutic decisions.[22] EUS-FNA has a sensitivity and specificity of up to 85% and 100%, respectively, and is the preferred method for making a definitive cytology diagnosis of a pancreatic mass, when other modalities could not confirm diagnosis. Immediate evaluation and feedback from an on-site expert cytopathologist during sampling increases a diagnostic yield by 10%–15%. EUS-FNA is also useful in the diagnosis of many hepatic lesions, especially when they are poorly accessible by US/CT-guided FNA;[23] however, it has some limitations regarding the vascular structures in the path of the needle, as well as in the right hepatic lobe, which constitutes some difficulty in the accessibility for biopsy and requires a more expert endosonographer to render it feasible.[24]
In this prospective study conducted on 730 patients, we aimed to assess the feasibility of EUS in detection of smaller (occult) hepatic focal lesions at the same time of examination for detection or local tumor staging of pancreatic, GI, or thoracic tumors and to compare our results with CT and/or MRI.
In this study, EUS successfully detected hepatic focal lesions and metastases that were overlooked by CT and MRI in 58 and 42 patients (7.9% and5.8%), respectively. The median size of the lesions missed by CT and MRI was 12 and 15 mm, with a range of 2–45 mm and 3–80 mm for both transverse and longitudinal diameters, respectively. The smaller size of such lesions might explain why they could not be detected by CT or MRI. The majority of the lesions missed by CT or MRI were in segment IV (12 patients), II (10 patients), and III (7 patients). Another explanation for this large number of lesions missed by CT or MRI could be that the scans were of varying quality, performed at different centers, and interpreted by different radiologists. Moreover, some lesions, such as focal fat changes, could be frequently missed by CT, while they are accurately detected by EUS. The lower lesion detection rate of CT or MRI might be underestimated in this study. Further studies with unification of the CT or MRI source might be needed.
EUS missed 7 focal lesions (6 metastatic lesions and 1 simple cyst). The 6 metastatic lesions were in segments V (3 patients), VI (2 patients), and VII (1 patient). The median sizes of the lesions missed by EUS were 16 and 20 mm, with a range of 8–27 mm and 12–32 mm for both transverse and longitudinal diameters, respectively. This could be explained by the site of the focal lesion, which was difficult to visualize, likely because of positioning of the echoendoscope, as well as smaller lesion size, which added another obstacle.
Nguyen et al. reported that EUS detected occult liver metastases in 2.4% of 574 patients with suspected GI or pulmonary malignancies, while liver lesions were detected by CT in only 3 of 14 (21%) patients.[25]
A study comparing the EUS, CT, MRI, and abdominal US in detection of hepatocellular carcinoma (HCC) showed that the diagnostic accuracy of US, CT, MRI, and EUS/EUS-FNA was 38%, 69%, 92%, and 94%, respectively. The study concluded that EUS has an advantage over CT in the detection of smaller lesions, in addition to the possibility of doing aspirations in the right liver lobe.[26] Awad et al. reported that EUS had better sensitivity for detecting small liver lesions than dynamic CT scans upon a preoperative evaluation of HCC by EUS before resection. The researchers reported that EUS could detect new/additional lesions in 28% of patients (all lesions <0.5 cm).[27]
In this study, EUS-FNA confirmed the diagnosis of 104 (83.9%) patients with hepatic focal lesions and 714 patients (97.8%) with primary tumors.
EUS-FNA has a high sensitivity for detection of malignant hepatic focal lesions (82%–94%) without any reported major complications.[28,29]
An early retrospective multicenter study by Ten Berge et al. in 2002 showed that CT-FNA missed malignant focal liver lesions in 83% of the cases diagnosed by EUS-FNA.[4] In contrast, another consecutive retrospective single-center study was conducted by Crowe et al. in 2006, in which they compared the results of CT-FNA with EUS-FNA for focal liver lesions and reported that CT-FNA and EUS-FNA had a similar comparative range of benign, atypical, and malignant diagnoses (CT: 26%, 18%, and 56% vs. EUS: 19%, 25%, and 56%, respectively).[30]
A prospective single-center study by Sing et al. in 2009 showed that EUS/EUS-FNA and CT scan had a diagnostic accuracy of 98% and 92%, respectively, with a higher number of metastatic liver lesions detected by EUS (40 vs. 19).[2] A single-center study including 77 patients with liver lesions concluded that in 41% of those previously having negative US/CT examinations, EUS could diagnose malignancy with a sensitivity of 82%, which increased to 94% after exclusion of 7 patients considered to be nondiagnostic. EUS-FNA cytological diagnosis changed the management plan in 86% of patients found to be malignant (n = 45, 58%).[28]
Another prospective single-center study conducted on 98 patients with malignant esophagus and cardiac lesions concluded that EUS had 80% diagnostic accuracy in detection of the occult hepatic lesions that were not evident on prior noninvasive imaging.[31]
The findings of these studies are in agreement with our study that showed that EUS is superior to CT and MRI for detection of focal liver lesions, especially smaller ones, being the greatest when such lesions are smaller than 1 cm. The reason for the superiority of EUS in this study is that it could detect a higher percentage of lesions missed by CT and MRI, nominally 58 and 42 patients, respectively, with a statistically significant P < 0.001.
A prospective study by Hollerbach et al. revealed that EUS-FNA had a successful biopsy of specimens in 40/41 patients, which, together with a combination of histology and cytology, had a sensitivity and specificity of 94% and 100%, respectively, with a negative predictive value and positive predictive value of 78% and 100%, respectively, for malignant lesions.[32]
Studies comparing EUS/EUS-FNA with CT and US-guided FNA found that the sensitivity, specificity, and diagnostic accuracy were almost 100% for EUS/EUS-FNA, while that of CT and US-guided FNA was about 83%–93.2%, respectively.[33,34]
In a retrospective survey study that included 130 endosonographers contacted via E-mail, where only 75% replied from 21 centers with 167 pooled cases, the reported complication rate for EUS-FNA was as low as 4% (6 cases), which included bleeding, abdominal pain, fever, and one mortality (0.6%). This survey concluded that EUS-FNA is generally a safe procedure with a low rate of complications.[4]
CE-EUS imaging and EUS elastography add a powerful advantage for EUS in the evaluation of liver malignancy.[35] Ma et al. reported a sensitivity of 85%, a specificity of 84%, and a positive likelihood ratio of 5.69 for differentiating benign from malignant liver lesions compared to the gold-standard histological examination.[36] Regarding this study, the real-time elastography for the primary and liver mass lesions showed a high percentage for score 4, which was matched with the malignancy risk, so it could be used as a potential tool for risk assessment of malignancy; however, it could not replace FNA.
EUS-FNA from the suspected liver metastasis did not add to the total cost as it was done by the same needle of FNA from the primary tumor. If both were present, we sampled the liver mass first, and then, we flushed the needle and the echoendoscope channel by sterile saline and then did FNA from the primary mass. EUS-FNA is mandatory if there were liver metastases in order to start chemotherapy on a cytopathological basis.
CONCLUSION
EUS examination of the liver is feasible and useful, with greater utility in detection of small hepatic lesions previously missed by other noninvasive imaging modalities such as CT and MRI. It is not considered an extra financial burden to the patient or health-care system because those patients are indicated for EUS examination for evaluation of their original lesion in the first place; it only requires a more thorough and dedicated examination by the operator to detect such occult hepatic lesions. Furthermore, EUS elastography and EUS-FNA can add another advantage in diagnosing the etiology of those lesions. The potential limitations of EUS and EUS-FNA are being invasive, relatively expensive, operator dependent, and not necessarily being available in many centers. Therefore, further studies are needed before considering EUS an alternative for current noninvasive liver imaging studies.
Recommendations
We recommend routine, meticulous evaluation of the liver in patients undergoing EUS examination for the staging of suspected or known GI and thoracic malignancies to detect occult liver lesions. EUS is also recommended as a preoperative tool for evaluation of malignancies before consideration of surgical resection, to offer the possibility of alteration of management.
Ethical consideration
The study was approved by the Institutional Ethical Committee and Form Review Board of Kasr Al Ainy Hospital. Oral and written informed consent was obtained from all subjects or from their eligible relatives.
The medical record profession has its own code of ethics, which applies to all medical record practitioners. Confidentiality of data, safe data storage, and privacy rights are respected by all who handle patient information. Data were coded and patient names or identities did not appear on any of the data collection forms or during statistical analysis.
Financial support and sponsorship
Nil.
Conflicts of interest
Hussein Hassan Okasha is an Editorial Board Member of the journal. The article was subject to the journal’s standard procedures, with peer review handled independently of this Member and his research groups.
Acknowledgments
We would like to acknowledge our great Kasr Al Ainy Hospital and its workers, nurses, and staff members for all the support and help in this study and throughout our careers.
REFERENCES
- 1.Baker ME, Pelley R. Hepatic metastases: Basic principles and implications for radiologists. Radiology. 1995;197:329–37. doi: 10.1148/radiology.197.2.7480672. [DOI] [PubMed] [Google Scholar]
- 2.Singh P, Mukhopadhyay P, Bhatt B, et al. Endoscopic ultrasound versus CT scan for detection of the metastases to the liver: Results of a prospective comparative study. J Clin Gastroenterol. 2009;43:367–73. doi: 10.1097/MCG.0b013e318167b8cc. [DOI] [PubMed] [Google Scholar]
- 3.Fusaroli P, Kypraios D, Eloubeidi MA, et al. Levels of evidence in endoscopic ultrasonography: A systematic review. Dig Dis Sci. 2012;57:602–9. doi: 10.1007/s10620-011-1961-y. [DOI] [PubMed] [Google Scholar]
- 4.Ten Berge J, Hoffman BJ, Hawes RH, et al. EUS-guided fine needle aspiration of the liver: indications, yield, and safety based on an international survey of 167 cases. Gastrointest Endosc. 2002;55:859–62. doi: 10.1067/mge.2002.124557. [DOI] [PubMed] [Google Scholar]
- 5.Saraireh HA, Bilal M, Singh S. Role of endoscopic ultrasound in liver disease: Where do we stand in 2017? World J Hepatol. 2017;9:1013–21. doi: 10.4254/wjh.v9.i24.1013. [DOI] [PMC free article] [PubMed] [Google Scholar]
- 6.Prasad P, Schmulewitz N, Patel A, et al. Detection of occult liver metastases during EUS for staging of malignancies. Gastrointest Endosc. 2004;59:49–53. doi: 10.1016/s0016-5107(03)02378-2. [DOI] [PubMed] [Google Scholar]
- 7.Jenssen C, Hocke M, Fusaroli P, et al. EFSUMB Guidelines on Interventional Ultrasound (INVUS), Part IV – EUS-guided interventions: General Aspects and EUS-guided Sampling (Short Version) Ultraschall Med. 2016;37:157–69. doi: 10.1055/s-0035-1553788. [DOI] [PubMed] [Google Scholar]
- 8.Jenssen C, Alvarez-Sánchez MV, Napoléon B, et al. Diagnostic endoscopic ultrasonography: Assessment of safety and prevention of complications. World J Gastroenterol. 2012;18:4659–76. doi: 10.3748/wjg.v18.i34.4659. [DOI] [PMC free article] [PubMed] [Google Scholar]
- 9.Wang KX, Ben QW, Jin ZD, et al. Assessment of morbidity and mortality associated with EUS-guided FNA: A systematic review. Gastrointest Endosc. 2011;73:283–90. doi: 10.1016/j.gie.2010.10.045. [DOI] [PubMed] [Google Scholar]
- 10.Ichim VA, Chira RI, Mircea PA, et al. Accuracy of endoscopic ultrasound-guided biopsy of focal liver lesions. Med Ultrason. 2020;22:20–5. doi: 10.11152/mu-2078. [DOI] [PubMed] [Google Scholar]
- 11.Sandulescu L, Padureanu V, Dumitrescu C, et al. A pilot study of real time elastography in the differentiation of focal liver lesions. Curr Health Sci J. 2012;38:32–5. [PMC free article] [PubMed] [Google Scholar]
- 12.Hirooka Y, Itoh A, Kawashima H, et al. Contrast-enhanced endoscopic ultrasonography in digestive diseases. J Gastroenterol. 2012;47:1063–72. doi: 10.1007/s00535-012-0662-4. [DOI] [PubMed] [Google Scholar]
- 13.Yamashita Y, Shimokawa T, Napoléon B, et al. Value of contrast-enhanced harmonic endoscopic ultrasonography with enhancement pattern for diagnosis of pancreatic cancer: A meta-analysis. Dig Endosc. 2019;31:125–33. doi: 10.1111/den.13290. [DOI] [PubMed] [Google Scholar]
- 14.Fusaroli P, D’Ercole MC, De Giorgio R, et al. Contrast harmonic endoscopic ultrasonography in the characterization of pancreatic metastases (with video) Pancreas. 2014;43:584–7. doi: 10.1097/MPA.0000000000000081. [DOI] [PubMed] [Google Scholar]
- 15.Gennisson JL, Deffieux T, Fink M, et al. Ultrasound elastography: Principles and techniques. Diagn Interv Imaging. 2013;94:487–95. doi: 10.1016/j.diii.2013.01.022. [DOI] [PubMed] [Google Scholar]
- 16.Andanappa HK, Dai Q, Korimilli A, et al. Acoustic liver biopsy using endoscopic ultrasound. Dig Dis Sci. 2008;53:1078–83. doi: 10.1007/s10620-008-0211-4. [DOI] [PubMed] [Google Scholar]
- 17.Itoh A, Ueno E, Tohno E, et al. Breast disease: Clinical application of US elastography for diagnosis. Radiology. 2006;239:341–50. doi: 10.1148/radiol.2391041676. [DOI] [PubMed] [Google Scholar]
- 18.Reimer P, Jahnke N, Fiebich M, et al. Hepatic lesion detection and characterization: value of non-enhanced MR imaging, superparamagnetic iron oxide-enhanced MR imaging, and spiral CT-ROC analysis. Radiology. 2000;217:152–8. doi: 10.1148/radiology.217.1.r00oc31152. [DOI] [PubMed] [Google Scholar]
- 19.Wernecke K, Rummeny E, Bongartz G, et al. Detection of hepatic masses in patients with carcinoma: Comparative sensitivities of sonography, CT, and MR imaging. Am J Roentgenol. 1991;157:731–9. doi: 10.2214/ajr.157.4.1892027. [DOI] [PubMed] [Google Scholar]
- 20.Ichikawa T, Saito K, Yoshioka N, et al. Detection and characterization of focal liver lesions: A Japanese Phase III, multicenter comparison between gadoxetic acid disodium-enhanced magnetic resonance imaging and contrast-enhanced computed tomography predominantly in patients with hepatocellular carcinoma and chronic liver disease. Invest Radiol. 2010;45:133–41. doi: 10.1097/RLI.0b013e3181caea5b. [DOI] [PubMed] [Google Scholar]
- 21.Ward J, Naik KS, Guthrie JA, et al. Hepatic lesion detection: comparison of MR imaging after the administration of superparamagnetic iron oxide with dual-phase CT by using alternative-free response receiver operating characteristic analysis. Radiology. 1999;210:459–66. doi: 10.1148/radiology.210.2.r99fe05459. [DOI] [PubMed] [Google Scholar]
- 22.Guo J, Sahai AV, Teoh A, et al. An international, multi-institution survey on performing EUS-FNA and fine needle biopsy. Endosc Ultrasound. 2020;9:319–28. doi: 10.4103/eus.eus_56_20. [DOI] [PMC free article] [PubMed] [Google Scholar]
- 23.Kimura H, Matsubayashi H, Fukutomi A, et al. Lymph node metastasis diagnosed by EUS-FNA in four cases with hepatocellular carcinoma. Clin Res Hepatol Gastroenterol. 2011;35:237–40. doi: 10.1016/j.clinre.2011.01.002. [DOI] [PubMed] [Google Scholar]
- 24.Oh D, Seo DW, Hong SM, et al. Endoscopic ultrasound-guided fine-needle aspiration can target right liver mass. Endosc Ultrasound. 2017;6:109–15. doi: 10.4103/2303-9027.204813. [DOI] [PMC free article] [PubMed] [Google Scholar]
- 25.Nguyen P, Feng JC, Chang KJ. Endoscopic ultrasound (EUS) and EUS-guided fine-needle aspiration (FNA) of liver lesions. Gastrointest Endosc. 1999;50:357–61. doi: 10.1053/ge.1999.v50.97208. [DOI] [PubMed] [Google Scholar]
- 26.Singh P, Erickson RA, Mukhopadhyay P, et al. EUS for detection of the hepatocellular carcinoma: Results of a prospective study. Gastrointest Endosc. 2007;66:265–73. doi: 10.1016/j.gie.2006.10.053. [DOI] [PubMed] [Google Scholar]
- 27.Awad SS, Fagan S, Abudayyeh S, et al. Preoperative evaluation of hepatic lesions for the staging of hepatocellular and metastatic liver carcinoma using endoscopic ultrasonography. Am J Surg. 2002;184:601–4. doi: 10.1016/s0002-9610(02)01092-9. [DOI] [PubMed] [Google Scholar]
- 28.DeWitt J, LeBlanc J, McHenry L, et al. Endoscopic ultrasound-guided fine needle aspiration cytology of solid liver lesions: A large single-center experience. Am J Gastroenterol. 2003;98:1976–81. doi: 10.1111/j.1572-0241.2003.07638.x. [DOI] [PubMed] [Google Scholar]
- 29.Hollerbach S, Willert J, Topalidis T, et al. Endoscopic ultrasound-guided fine-needle aspiration biopsy of liver lesions: Histological and cytological assessment. Endoscopy. 2003;35:743–9. doi: 10.1055/s-2003-41593. [DOI] [PubMed] [Google Scholar]
- 30.Crowe DR, Eloubeidi MA, Chhieng DC, et al. Fine-needle aspiration biopsy of hepatic lesions: Computerized tomographic-guided versus endoscopic ultrasound-guided FNA. Cancer. 2006;108:180–5. doi: 10.1002/cncr.21912. [DOI] [PubMed] [Google Scholar]
- 31.McGrath K, Brody D, Luketich J, et al. Detection of unsuspected left hepatic lobe metastases during EUS staging of cancer of the esophagus and cardia. Am J Gastroenterol. 2006;101:1742–6. doi: 10.1111/j.1572-0241.2006.00665.x. [DOI] [PubMed] [Google Scholar]
- 32.Hollerbach S, Reiser M, Topalidis T, et al. Diagnosis of hepatocellular carcinoma (HCC) in a high-risk patient by using transgastric EUS-guided fine-needle biopsy (EUS-FNA) Z Gastroenterol. 2003;41:995–8. doi: 10.1055/s-2003-42920. [DOI] [PubMed] [Google Scholar]
- 33.Edoute Y, Tibon-Fisher O, Ben Haim S, et al. Ultrasonically guided fine-needle aspiration of liver lesions. Am J Gastroenterol. 1992;87:1138–41. [PubMed] [Google Scholar]
- 34.Sautereau D, Vire O, Cazes PY, et al. Value of sonographically guided fine needle aspiration biopsy in evaluating the liver with sonographic abnormalities. Gastroenterology. 1987;93:715–8. doi: 10.1016/0016-5085(87)90432-x. [DOI] [PubMed] [Google Scholar]
- 35.Lange A, Muniraj T, Aslanian HR. Endoscopic ultrasound for the diagnosis and staging of liver tumors. Gastrointest Endosc Clin N Am. 2019;29:339–50. doi: 10.1016/j.giec.2018.12.005. [DOI] [PubMed] [Google Scholar]
- 36.Ma X, Zhan W, Zhang B, et al. Elastography for the differentiation of benign and malignant liver lesions: A meta-analysis. Tumour Biol. 2014;35:4489–97. doi: 10.1007/s13277-013-1591-4. [DOI] [PubMed] [Google Scholar]


