Abstract
Interfacial adsorption has been demonstrated to be an important retention process for per and polyfluoroalkyl substances (PFAS) in porous media with air or non-aqueous phase liquids (NAPLs) present. The objective of this study was to characterize the influence of PFAS molecular structure on air-water interfacial adsorption in electrolyte solutions. Measured and literature-reported surface-tension data sets were aggregated to generate the largest compilation of interfacial adsorption coefficients measured in aqueous solutions comprising environmentally representative ionic strengths. The surface activities and interfacial adsorption coefficients (Ki) exhibited chain length trends, with greater surface activities and larger Ki values corresponding to longer chain length. The impact of multiple-component PFAS solutions on the surface activity of a select PFAS was a function of the respective surface activities and concentrations. Quantitative structure-property relationship analysis (QSPR) employing a single molecular descriptor (molar volume) was used successfully to characterize the impact of PFAS molecular structure on air-water interfacial adsorption. A previously reported QSPR model based on PFAS data generated for deionized-water solutions was updated to include more than 60 different PFAS, comprising all head-group types and a wide variety of tail structures. The QSPR model developed for PFAS in electrolyte solution compared favorably to the model developed for deionized water. Additionally, the magnitude of ionic strength for non-zero ionic strength systems was determined to have relatively minimal impact on interfacial adsorption coefficients. The new QSPR model is therefore anticipated to be representative for a wide variety of PFAS and for a wide range of ionic compositions.
Keywords: perfluorooctanoic acid, perfluorooctane sulfonic acid, interfacial adsorption, air-water interface, NAPL-water interface, QSPR
1. Introduction
Adsorption to fluid-fluid interfaces is an important retention mechanism to consider for per and polyfluoroalkyl substances (PFAS). Numerous surfactant-science studies reporting surface-tension measurements have demonstrated the strong air-water interfacial activity of PFAS (e.g., Hendricks, 1953; Downes et al., 1995; López-Fontán et al., 2005; Lunkenheimer et al., 2015). Brusseau and colleagues have demonstrated with modeling and miscible-displacement transport experiments that air-water interfacial adsorption is a significant retention mechanism for PFAS transport in unsaturated porous media (Brusseau, 2018; Lyu et al., 2018; Brusseau et al., 2019; Brusseau, 2020; Lyu and Brusseau, 2020; Guo et al., 2020; Yan et al., 2020). For example, Lyu et al. (2018) determined that air-water interfacial adsorption contributed approximately 50–75% of total retention for PFOA transport in unsaturated sand. Similarly, recent modeling and transport studies have demonstrated that adsorption at interfaces between non-aqueous phase liquid (NAPL) and water can serve as an additional PFAS retention process (Brusseau, 2018; Brusseau et al., 2019; Van Glubt and Brusseau, 2021). For example, PFOS adsorption to the decane-water interface contributed to more than 70% of the total retention for PFOS transport in a sand containing residual decane NAPL (Brusseau et al., 2019).
Understanding and quantifying the fluid-fluid interfacial adsorption of PFAS is crucial to characterizing PFAS transport, conducting accurate risk assessments, and developing effective mitigation and remedial-action plans. Brusseau (2018) discussed the many factors that can influence fluid-fluid interfacial adsorption of PFAS in porous-media systems. One such factor is the ionic strength of the aqueous solution. The impact of ionic strength on the surface/interfacial activity of PFAS has long been established in the field of surfactant science through surface-tension measurements (e.g., Talbot, 1959; Shinoda and Nakayama, 1963; Downes et al., 1995; An et al., 1996; López-Fontán et al., 2005). The influence of ionic strength on air-water interfacial adsorption and transport of PFAS in unsaturated porous media was recently demonstrated in a series of miscible-displacement experiments (Lyu and Brusseau, 2020).
Surfactant-science studies typically employ single-salt solutions, whereas soil pore-water comprises a mixture of salts consisting of both monovalent and divalent ions. The interfacial activity of PFAS is influenced by the ionic composition as well as ionic strength of the solution (Brusseau and Van Glubt, 2019). Hence, it is important to measure PFAS activities and interfacial adsorption coefficients (Ki) in aqueous solutions whose compositions are representative of natural subsurface systems. Surface-tension data for PFAS in electrolyte solutions that more closely reflect actual soil pore-water characteristics have been reported in recent environmental-focused studies (Brusseau et al., 2019; Brusseau and Van Glubt, 2019; Costanza et al., 2019; Silva et al., 2019). These studies all employed synthetic groundwater (SGW) solutions comprised of multiple monovalent and divalent salts. As would be expected, surface activities of PFAS measured in the SGW solutions were greater than those measured in deionized water. These studies employed different solution compositions, and it would be informative to compare the data sets to further evaluate ionic-composition effects.
As previously discussed, surface activity and interfacial adsorption coefficients need to be quantified to characterize PFAS retention and transport. However, measuring interfacial adsorption coefficients for each of the thousands of PFAS in existence is impractical. As an alternative, quantitative-structure/property-relationship (QSPR) models provide empirical-based functions for estimating compound properties based on molecular structure. Brusseau and colleagues have demonstrated the utility of using QSPR analyses for characterizing the fluid-fluid interfacial adsorption of PFAS and predicting interfacial adsorption coefficients (Lyu et al., 2018; Brusseau, 2019; Brusseau and Van Glubt, 2019).
The objective of this study is to characterize the influence of molecular structure on air-water interfacial adsorption of PFAS in aqueous solutions comprising environmentally representative ionic strengths. Surface tensions are measured for several PFAS in a 0.01 M synthetic groundwater solution and a 0.01 M NaCl reference solution. In addition, surface-tension data measured in environmentally representative ionic-strength solutions are compiled from the literature. Interfacial adsorption coefficients are determined from the measured and literature-reported surface-tension data. The data are evaluated through QSPR analysis and the impacts of solution ionic strength and composition on interfacial adsorption coefficients are evaluated. A previously reported QSPR model based on PFAS data generated for deionized-water solutions is updated to include more than 60 different PFAS, comprising all headgroup types and a wide variety of tail structures. The QSPR model developed for PFAS in electrolyte solution is compared to the model developed for deionized water.
2. Materials and Methods
2.1. Materials
Perfluorobutanoic acid (PFBA; CAS# 375–22-4, 98%) and perfluorobutane sulfonic acid (PFBS; CAS# 375–73-5, 98% purity) were purchased from TCI America. Perfluorooctanoic acid (PFOA; CAS# 335–67-1, 98%) was purchased from AIKE Reagent. Sodium perfluorooctanoate (Na-PFOA; CAS# 335–95-5, 97%) was purchased from Manchester Organics. Potassium perfluorooctane sulfonate (K-PFOS; CAS# 1763–23-1, 98%) was purchased from Matrix Scientific. Perfluorohexanoic acid (PFHxA; CAS# 307–24-4, 97%), perfluoroheptanoic acid (PFHpA; CAS#375–85-9, 99%), potassium perfluorohexane sulfonate (K-PFHxS; CAS# 3871–99-6, >98%), and perfluorooctane sulfonic acid (PFOS; CAS# 1763–23-1, 98%), were purchased from Sigma Aldrich.Perfluorononanoic acid (PFNA; CAS#375–95-1, 97%) was purchased from Shanghai Macklin Biochemical Co., Ltd. Perfluorodecanoic acid (PFDA; CAS#335–76-2, 98%) was purchased from Shanghai Aladdin Biochemical Technology Co., Ltd.
All background solutions were prepared with distilled, deionized water. Measurements were conducted with background solutions of 0.01 M NaCl or SGW. The SGW pH is 7.7 and ionic strength is 0.01 M, and it is comprised of the cations (concentration in mg/L) Na+1 (50), Ca+2 (36), and Mg+2 (25), and anions NO3−1 (6), Cl−1 (60), CO3−2/HCO3−1 (133), and SO4−2 (99).
2.2. Methods
Surface tensions were measured for aqueous solutions of the selected PFAS to determine adsorption to the air-water interface. Measurements were conducted for individual compounds and some compound mixtures. Standard methods were followed using either a Fisher Scientific Surface Tensiomat 21 with a Du Nouy ring or a Biolin Scientific Sigma 701 precision force tensiometer using a Wilhelmy plate or Du Nouy ring. Comparisons of data collected for the same aqueous solutions using both instruments yielded consistent results. Solutions were prepared with a stock solution of the highest concentration to be measured, followed by dilutions to create subsequently lower concentrations. An automated method was employed for some measurements with the Sigma 701, where the software automatically controlled the addition of stock solution to the initial zero concentration solution to measure the entire concentration range. A minimum of 3–5 measurements were collected for each sample concentration. This constitutes one complete measurement set. Multiple sets were measured for the same PFAS over a period of 2–3 years to test for reproducibility. All measurements were conducted at room temperature (25±1 °C). The tensiometers were regularly calibrated with known masses and deionized water samples were regularly measured for surface tension to ensure proper instrument calibration.
Surface-tension data were aggregated from literature sources to combine with the measurements reported in the present study. A list of the literature data sets included in this work for electrolyte solutions is provided in Table 1. Additional surface-tension data sets were also collected from the literature for deionized-water systems to update the original QSPR model of Brusseau (2019). The additional data sources include the following: Boutevin et al., 2012; Hill et al., 2018; Lin et al., 2018a, 2018b; Ngo et al., 2010; Padoan et al., 2015; Rodriguez et al., 2001; Shen et al., 2018; Tadros, 1980; Wang et al., 2012; Yan et al., 2020; Zhai et al., 2019. The surface-tension data set of Ngo et al. (2010) was reported for an elevated temperature, and was temperature corrected based on the measurements reported by Tadros (1980). The literature data were digitized using the open-source Engauge program (Mitchell et al., 2017).
Table 1.
Experiments and literature data corresponding to solution molarity at or near 0.01 M included in this study
| Analyte | Background Solutiona | Source |
|---|---|---|
| H-PFBA | 0.01 M NaCl | This study |
| Na-PFPeA | 0.01 M NaCl 0.01 M SGW |
Brusseau and Van Glubt, 2019 |
| H-PFHxA | 0.01 M NaCl | This study |
| H-PFHpA | 0.01 M NaCl | This study |
| H-PFOA | 0.01M NaCl 0.01 M SGW |
This study |
| Na-PFOA | 0.01 M NaCl 0.01 M SGW |
Brusseau and Van Glubt, 2019 & This study |
| H-PFNA | 0.01 M NaCl | This study |
| H-PFDA | 0.01 M NaCl | This study |
| H-PFTDA | 0.01 M SGW | Brusseau and Van Glubt, 2019 |
| NH4-GenX H-GenX | 0.01 M NaCl 0.01 M SGW |
Yan et al., 2020 |
| H-PFBS | 0.01 M SGW | This study |
| K-PFHxS | 0.01 M SGW | This study |
| H-PFOS | 0.01 M NaCl 0.01 M SGW |
Brusseau and Van Glubt, 2019 & This study |
| K-PFOS | 0.01 M NaCl 0.01 M SGW |
Brusseau and Van Glubt, 2019 & This study |
| H-PFOS | 0.01 M NaCl + 0.1 mg/L each PFBA, PFOA, PFTDA | This study |
| Na-PFPeA | DIW + 1 mg/L each Na-PFPeA, K-PFOS, PFTDA | This study |
| Na-PFOA | DIW + 1 mg/L each Na-PFPeA, K-PFOS, PFTDA | This study |
| K-PFOS | DIW + 1 mg/L each Na-PFPeA, K-PFOS, PFTDA | This study |
| PFTDA | DIW + 1 mg/L each Na-PFPeA, K-PFOS, PFTDA | This study |
| H-PFPeA | 0.006 M SGW 0.023 M SGW |
Silva et al., 2019 |
| H-PFHxA | 0.006 M SGW 0.023 M SGW |
Silva et al., 2019 |
| H-PFHpA | 0.006 M SGW 0.023 M SGW |
Silva et al., 2019 |
| H-PFOA | 0.006 M SGW 0.023 M SGW |
Silva et al., 2019 |
| H-PFOA | 0.0125 M SGW 0.0375 M SGW |
Costanza et al., 2019 |
| H-PFNA | 0.006 M SGW 0.023 M SGW |
Silva et al., 2019 |
| H-PFDA | 0.006 M SGW 0.023 M SGW |
Silva et al., 2019 |
| K-PFBS | 0.006 M SGW 0.023 M SGW |
Silva, 2020 |
| K-PFHxS | 0.006 M SGW 0.023 M SGW |
Silva, 2020 |
| K-PFOS | 0.0125 M SGW 0.0375 M SGW |
Costanza et al., 2019 |
| K-PFOS | 0.006 M SGW 0.023 M SGW |
Silva, 2020 |
| SDS | 0.01 M NaCl | This study |
| CTAB | 0.01 M NaCl | Nakahara et al., 2011 |
| Triton X45 | 0.01 M NaCl | Fainerman et al., 2009 |
| CAPB | 0.01 M NaCl | Staszak et al., 2015 |
SGW is synthetic groundwater and DIW is deionized water
2.3. Data Analysis
A summary of the data analysis is included here. Further details of the data analysis methods are included in the prior studies (Brusseau, 2019; Brusseau and Van Glubt, 2019; Brusseau, 2021). The Gibbs adsorption equation was used to calculate the surface excess Γ (mol/cm2) from the surface-tension function:
| (1) |
where R is the universal gas constant (dyne-cm/mol °K), T is temperature (°K), γ is the surface tension (dyne/cm or mN/m), C is the aqueous concentration (mol/cm3), and x is a coefficient equal to 1 for nonionic surfactants or for ionic surfactants with excess solution electrolyte, and equal to 2 for ionic surfactants without excess solution electrolyte. The air-water interfacial adsorption coefficient (Ki; cm) was then determined as a function of concentration:
| (2) |
where the Ki can be quantified for any fluid-fluid system of interest, such as air-water or NAPL water.
The Szyszkowski equation was applied to all data sets to provide a uniform data-analysis method, and is represented by (e.g., Barnes and Gentle, 2011):
| (3) |
where γ0 is the surface tension when analyte aqueous solution concentration is zero, a (mol/cm3) is a parameter related to properties of the individual surfactant, and b is a parameter related to properties of the homologous series. Combining the differentiated form of equation 3 with equation 1 produces the Szyszkowski-Langmuir equation (e.g., Barnes and Gentle, 2011), which can be written in different forms to elucidate parameter identities:
| (4) |
where Γm is the maximum surface excess (=γ0b/RT) and KL is the Langmuir adsorption coefficient (a = 1/KL). The “a” parameter is a function of the free energy of adsorption from solution. Combining equations 2 and 4 produces:
| (5) |
Equation 5 highlights the nonlinearity of Ki as a function of aqueous concentration, and that it approaches a constant maximum value at lower concentrations (C<<a). The Ki values were calculated corresponding to concentrations sufficiently low (i.e., 0.1 mg/L or lower) to represent essentially maximum values, as discussed in our prior studies (Brusseau, 2019; Brusseau and Van Glubt, 2019; Brusseau, 2021).
A full description of the QSPR methods used for the analyses are included in Brusseau (2019). Molar volume (Vm, cm3/mol) is used as the single molecular descriptor for the QSPR analysis. This is the same descriptor employed by Brusseau (2019) and Brusseau and Van Glubt (2019). Molar volumes were determined from reported measured values where available, or calculated using molecular weight and reported densities. A standard group-contribution analysis approach, employing the Schroeder (Baum, 1998) or Fedors (1974) method was used to calculate molar volumes for those compounds for which densities were unavailable. The latter method was employed for the zwitterionic PFAS to account for the presence of more complex functional groups.
3. Results and Discussion
3.1. Measured Surface Tensions
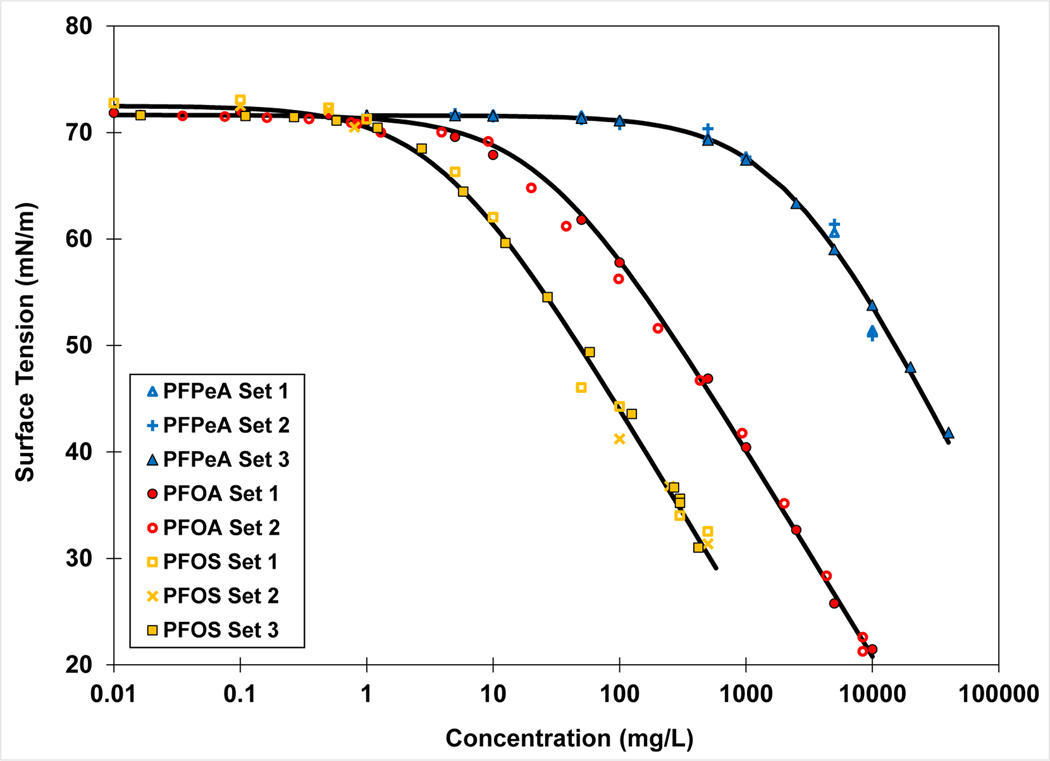
Measured surface tensions and fitted Szyszkowski functions for representative PFCAs and PFSAs are presented in Figures 1 and 2. The magnitudes of the surface activities are a function of chain length as expected. Greater surface activity is observed for compounds with longer chain lengths, with the decline in surface tension corresponding to lower concentrations compared to compounds of shorter chain length. This behavior is a manifestation of the greater hydrophobicity of longer carbon chains (e.g., Hendricks, 1953; Tamaki et al., 1989; Meissner et al., 1992; Campbell et al., 2009; Lunkenheimer et al., 2015). Good reproducibility is generally observed for the replicate measurement sets.
Figure 1.
Surface tension measurements and fitted Szyszkowski functions for Na-PFPeA, Na-PFOA, and K-PFOS in synthetic groundwater.
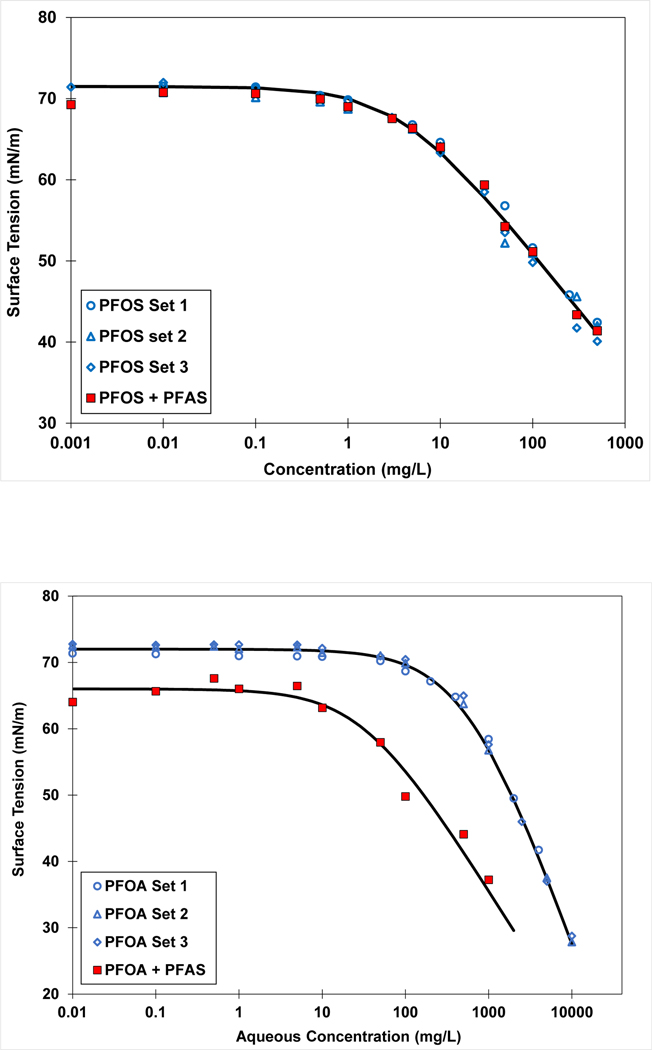
Figure 2.
Surface tensions for single and multiple-component solutions of PFAS. The solid curves represent Szyszkowski fits to the data. Top: Data for PFOS in 0.01 M NaCl solution. PFOS+PFAS solution contains 0.1 mg/L each of PFBA, PFOA, and PFTDA. Bottom: Data for Na-PFOA in deionized water solution. PFOA+PFAS solution contains 1mg/L each of Na-PFPeA, K-PFOS, and PFTDA.
PFAS-contaminated media generally contain mixtures of PFAS compounds. Therefore, understanding the adsorption behavior of mixtures is highly relevant to environmental systems. The impact of additional PFAS on the surface tension of PFOS was examined for a solution containing 0.1 mg/L each of PFBA, PFOA, and PFTDA in 0.01 M NaCl (Figure 2, Top). The results show that the surface-tension function for PFOS in the multiple-component solution is coincident with those of PFOS alone. The mean Ki value determined from the three individual surface-tension measurements is 0.033 (0.026–0.04) cm for a target concentration of 0.01 mg/L. The Ki value for PFOS in the multiple-component solution is 0.027 cm, which is within the 95% confidence interval of the PFOS-alone values. Consistent PFOS Ki values between the single and multiple-component solutions were also obtained for target concentrations of 0.1, 1, and 10 mg/L. These results indicate that the presence of relatively low concentrations of other PFAS had no measureable impact on PFOS activity and air-water interfacial adsorption.
Surface tensions were measured for another four-component mixture comprising Na-PFPeA, Na-PFOA, K-PFOS, and PFTDA in deionized water. Four sets of surface tensions were measured in this case, with concentration varying for one while the others remained at a constant background concentration of 1 mg/L each. An example data set is presented in Figure 2 (Bottom). The surface tensions for Na-PFOA are observed to be depressed at lower concentrations, resulting from the presence of relatively high concentrations of the other PFAS. Similar maximum Ki values were determined for K-PFOS for both the single-solute and multiple-component solutions. This indicates that there was no measurable impact of the other PFAS, consistent with the prior data set. Conversely, the maximum Ki value for Na-PFOA was 0.0024 cm for the multiple-component solution versus 0.00023 cm for the single-solute solution. Thus, the presence of the other PFAS had a significant impact on the Ki for Na-PFOA. The difference in impacts observed for PFOS and PFOA are consistent with the relative surface activities of the two (Vecitis et al., 2008; Brusseau and Van Glubt, 2019).
3.2. QSPR Analysis of Air-Water Interfacial Adsorption Coefficients
The QSPR analysis by Brusseau (2019) employed air-water (and a few NAPL-water) data sets with solutions of deionized water. The QSPR analysis by Brusseau and Van Glubt (2019) primarily used air-water data sets with solutions of deionized water, 0.01 M NaCl, and SGW. The data sets included in the present QSPR analysis all correspond to air-water systems with electrolyte solutions at or near 0.01 M. Specifically, the data comprise (1) PFAS and hydrocarbon surfactants for 0.01 NaCl, and (2) PFAS for 0.006 and 0.01 M SGW. The data sets employed in the analysis are listed in Table 1. The data from the multiple-component PFAS systems were not included in the QSPR analysis.
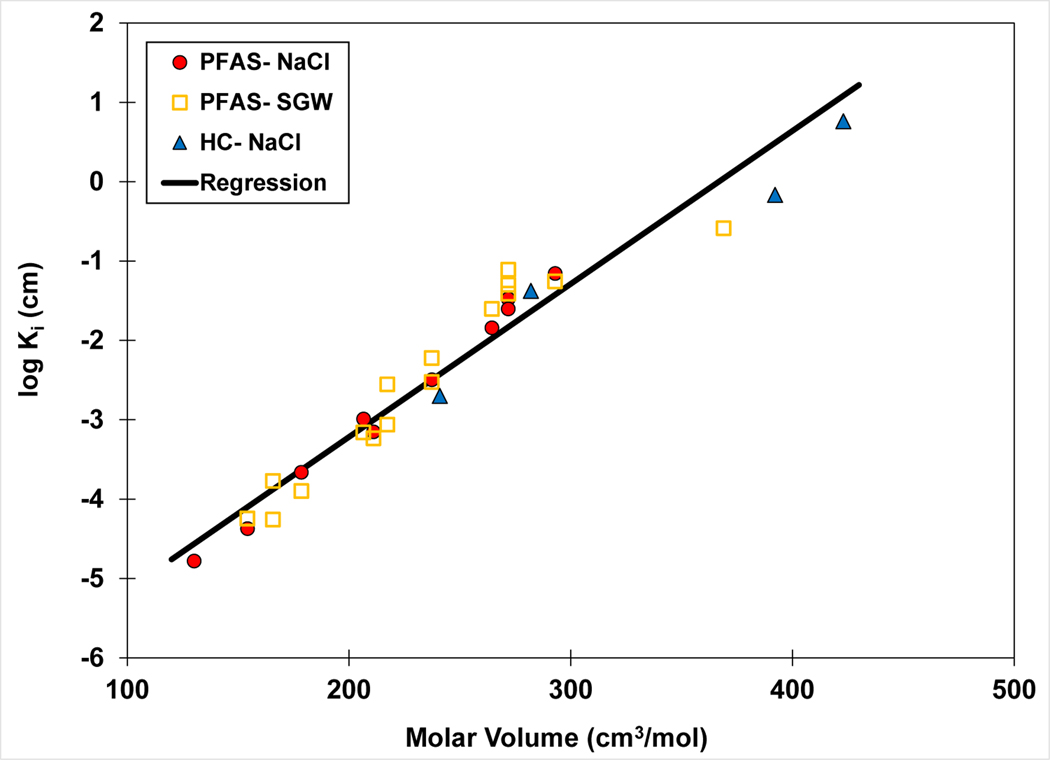
The results of the QSPR analysis are shown in Figure 3, including Ki values from this study and those calculated from the literature data. The Vm values span almost 300 cm3/mol and the Ki values span more than five log units. The QSPR regression has an r2 of 0.946, indicating the analysis provides a good representation of the data despite differences in solution ionic strength and ion composition between the data sets. These results indicate that the molar-volume QSPR model has the potential to provide robust estimates of Ki values for PFAS in electrolyte solutions. This potential will be further evaluated below.
Figure 3.
QSPR model for air-water interfacial adsorption coefficient (Ki) versus molar volume. The Ki values are calculated from surface-tension data sets measured in 0.01 M NaCl or 0.006 and 0.01 M synthetic groundwater (SGW) solutions. Note that multiple values are reported for some PFAS. The regression equation is log Ki = 0.019 (±0.002) Vm − 7.1 (±0.45), r2 = 0.946.
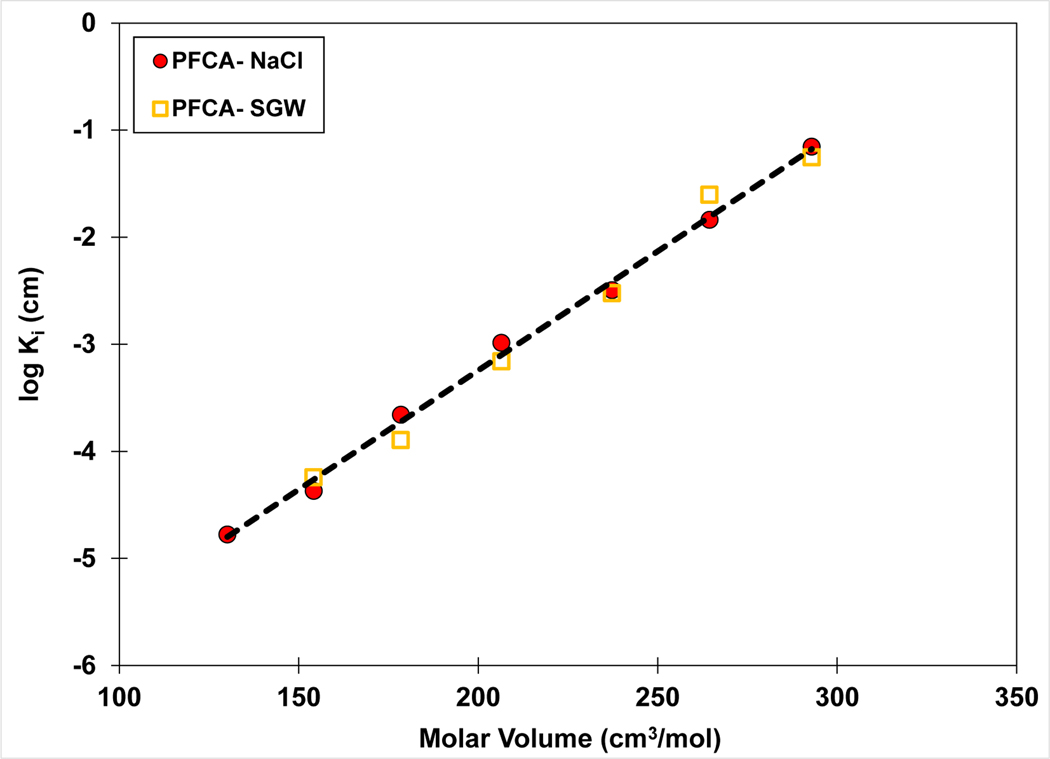
The similarity of Ki values for solutions of 0.01 M NaCl and 0.006 SGW observed in Figure 3 indicates similar PFAS surface activities for the two solutions. This is further demonstrated in Figure 4, wherein data are presented for only the homologous series of PFCAs in the two solutions. Concurrence of Ki values between the lower ionic-strength SGW solution and the higher ionic-strength NaCl solution is consistent with the presence of divalent ions in the SGW and their greater impact on activity (Brusseau and Van Glubt, 2019).
Figure 4.
QSPR model for air-water interfacial adsorption coefficient (Ki) versus molar volume of the C4-C10 homologous series of PFCAs. The Ki values are calculated from surface-tension data sets measured in 0.01 M NaCl or 0.006 M synthetic groundwater (SGW) solutions.
The similarity of Ki values measured for the 0.01 M SGW solution to values measured for the other two solutions indicates that ionic strength has a relatively small impact in this range of ionic strength. This was further tested by calculating Ki values for different ranges of ionic strength at five different PFAS target concentrations (0.01, 0.1, 1, 10, and 100 mg/L). Initially, four ionic-strength ranges were analyzed (<0.01, 0.01, >0.01 to <0.1, and ≥0.1 M). The actual ionic strengths are presented in Table 1. However, due to the nearly identical regressions for different ionic strengths at a given PFAS concentration, the number of ionic-strength ranges was decreased to two for simplicity and ease of comparison. Log Ki values corresponding to solution ionic strengths <0.1 M or ≥0.1 M were regressed with molar volume for each of the different PFAS concentrations. The regressions are essentially identical between the two ionic-strength ranges for a given PFAS target concentration. These results indicate that ionic strength has relatively minimal impact on the magnitude of PFAS interfacial adsorption coefficients for systems with non-zero ionic strength.
The ionic strength of soil pore-water is generally in the range of 0.005–0.01 M, spanning lower and higher values depending upon soil properties and conditions (e.g., Edmeades et al., 1985; Peverill et al., 1999). The ionic strengths for the data sets reported herein are similar to this range and therefore are representative of natural conditions. Additionally, the natural buffering capacity of soils reduces the likelihood of ionic strength changing significantly in a given system (e.g., Helyar and Porter, 1989; Sparks, 2003). Hence, it is anticipated that Ki values will exhibit relatively minimal changes due to solution ionic-strength effects under typical field conditions. The minimal impact of changes in ionic strength on PFAS air-water interfacial adsorption for non-zero ionic-strength systems observed in the present study is consistent with the results of prior surface-tension (Brusseau and Van Glubt, 2019; Silva et al., 2019) and transport studies (Lyu and Brusseau, 2020). These results indicate that the QSPR model presented in Figure 3 is likely to be representative for a broad range of natural pore-water systems with respect to ionic strength and composition.
3.3. Updated QSPR Model for PFAS in Deionized Water
The original QSPR model presented by Brusseau (2019) included air-water interfacial adsorption data for 42 individual PFAS representing anionic, cationic, and nonionic headgroups and a wide variety of tail structures. This data set was updated herein by adding 19 more PFAS, including several zwitterionic and additional cationic PFAS (Table 2). The new additions include PFAS of current significant interest such as precursors and replacements. The revised QSPR model is presented in Figure 5.
Table 2.
PFAS and hydrocarbon surfactants included in the revised QSPR model for deionized-water systems. Table revised from Brusseau (2019).
| Acronym | Formula | Perfluorocarboxylates |
|---|---|---|
| PFAA | CF3CO2Na | Na-Perfluoroacetoate |
| PFPrA | C2F5CO2Na | Na-Perfluoropropanoate |
| PFBA | C3F7CO2Na | Na-Perfluorobutanoate |
| PFPeA | C4F9CO2Na | Na-Perfluoropentanoate |
| PFHxA | C5F11CO2Na | Na-Perfluorohexanoate |
| PFHpA | C6F13CO2Na | Na-Perfluoroheptanoate |
| PFOA | C7F15CO2Na | Na-Perfluorooctanoate |
| PFNA | C8F17CO2Na | Na-Perfluorononanoate |
| PFDA | C9F19CO2Na | Na-Perfluorodecanoate |
| PFUnA | C10F21CO2Na | Na-Perfluoroundecanoate |
| PFTDA | C12F25CO2H | H-Perfluorotridecanoic acid |
| Branched PFCAs | ||
| Iso-PFOA | (CF3)2CF(CF2)4CO2Na | Na perfluoro-methyl-heptanoate |
| Iso-PFDA | (CF3)2CF(CF2)6CO2Na | Na-perfluoro-methyl-nonanoate |
| Perfluorosulfonates | ||
| PFBS | C4F9SO3K | K-Perfluorobutanesulfonate |
| PFHxS | C6F13SO3K | K-Perfluorohexanesulfonate |
| PFHpS | C7F15SO3K | Na-Perfluoroheptanesulfonate |
| PFOS | C8F17SO3K | K-Perfluorooctanesulfonate |
| PFNS | C9F19SO3K | K-Perfluorononanesulfonate |
| Polyfluoroalkyls | ||
| 9H-PFNA | C8HF16CO2Na | Na-9H-hexadecafluorononanoate |
| 7H-PFHpA | C6HF12CO2NH4 | NH4-7H-dodecafluoroheptanoate |
| SHDBS | C9F17OC6H4SO3Na | Na-heptadecafluorononenyloxy benzene sulfonate |
| FC-53 | CF3(CF2)5O(CF2)2SO3K | K-3-oxa-perfluorononane sulfonate |
| TDFHD | CF3(CF2)3CF(CF3)(CH2)10CO2Na | Na-tridecafluorohexadecanoate |
| UDFOS | CF3(CF2)3CH2CF2(CH2)2SO3H | H-undecafluorooctanesulfonate |
| NFHES | CF3CF2O(CF2)2(CH2)2SO3Na | Na-nonafluorohexylether sulfonate |
| UDFHES | CF3(CF2)2O(CF2)2(CH2)2SO3Na | Na-undecafluoroheptylether sulfonate |
| TDFP | CF3(CF2)2C(CF3)2CH2CO2Na | Na-tridecafluoropentanoate |
| TDHP | CF3(CF2)2C(CF3)2(CH2)2CO2Na | Na-tridecafluorohexanoate |
| HDFPEC | CF3(CF2)2OCF(CF3)CF2OCF(CF3)CO2Na | Na-heptadecafluoropolyether carboxylate |
| TDFPBP | CF3(CF2)2C(CF3)2CH2C6H4PO3Li2 | Li-heptafluoro-bis-trifluoromethylpentylbenzene phosphonate |
| 6:2 FTSA | CF3(CF2)5(CH2)2SO3H | 6:2 fluorotelomer sulfonate |
| 6:2 FtAoS | CF3(CF2)4(CH2)2S(CH2)2CONHC(CH3)2CH2SO 3Na | 6:2 fluorotelomer thioether amido sulfonate |
| 7H-6:2 monoPAP | H(CF2)6CH2OPO(ONa)2 | disodium dodecafluoroheptyl phosphate |
| DFHOA | H(CF2)6COCCO2Na | Na-7H-dodecafluoroheptyloxyoate |
| GenX | CF3(CF2)2OCF3CFCO2NH4 | NH4-perfluoromethyloxahexanoate |
| NFTFBA | CF3(CF2)3(CH2CF2)2CH2CO2H | H-nonafluoro-tetrafluorobutanoate |
| SNDBS | C10F19OC6H4SO3Na | Na-nonadecafluorononenyloxy benzene sulfonate |
| Cationic PFAS | ||
| F9-CTAB | CF3(CF2)3(CH2)11N(CH3)3Br | Nonafluoropentadecyl-CTAB |
| F12-CTAB | (CF3)2(CF2)3(CH2)10N(CH3)3Br | Dodecafluoropentadecyl-CTAB |
| F17-CTAB | CF3(CF2)7(CH2)6N(CH3)3Br | Heptadecafluorotetradecyl-CTAB |
| HDFTAI | CF3(CF2)7CH2COHCH2N(CH3)3I | Heptadecafluoroundecan-2-oltrimethylammonium iodide |
| TDFTAI | CF3(CF2)5CH2COHCH2N(CH3)3I | Tridecafluorononan-2-oltrimethylammonium iodide |
| NFTAI | CF3(CF2)3CH2COHCH2N(CH3)3I | Nonafluorohepta-2-ol-trimethylammonium iodide |
| HDFSTAI | CF3(CF2)7SO2NH(CH2)3(CH3)3I | Heptadecafluoropropylaminosulfonetrimeth ylammonium iodide |
| TCFPATAI | CF3(CF2)10CONH(CH2)3N(CH3)3I | Tricosafluoropentaamidotrimethylammoniu m iodide |
| NDFPATAI | CF3(CF2)8CONH(CH2)3N(CH3)3I | Nonadecafluoropentaamidotrimethylammoni um iodide |
| Zwitterionic PFAS | ||
| TDFAEB | CF3(CF2)2C(CF3)2CH2CONH(CH2)2N(CH3)2CH 2CO2 | Tridecafluoroamide ethyl betaine |
| 6:2 FTAB | CF3(CF2)5(CH2)2SO2NH(CH2)3N(CH3)2CH2CO 2 |
6:2 fluorotelomer sulfonamide betaine |
| HDFPEPB | CF3(CF2)2OCFCF3CF2OCFCF3CONH(CH2)3N(C H3)2CH2CO2 | heptadecafluoropolyetheramide propyl betaine |
| TDFPBAO | CF3(CF2)2C(CF3)2CH2C6H4CONH(CH2)2NO(C H3)2 | Tridecafluoropentylbenzamidodimethylamineoxide |
| TDFHBAO | CF3(CF2)2C(CF3)2CH2C6H4CONH(CH2)3NO(C H3)2 | Tridecafluorohexylbenzamidodimethylamineoxide |
| Nonionic PFAS | ||
| TDFTDE | CF3(CF2)5C2H4SC2H4(CH2CH2O)2OH | Tridecafluorothiodiethoxylate |
| TDFTTE | CF3(CF2)5C2H4SC2H4(CH2CH2O)3OH | Tridecafluorothiotriethoxylate |
| TDFTPE | CF3(CF2)5C2H4SC2H4(CH2CH2O)5OH | Tridecafluorothiopentaethoxylate |
| PFOA- amide |
CF3(CF2)6CONHCH2CH3CHOH | N-(2-hydroxypropyl)perfluorooctane amide |
| NFTME | CF3(CF2)3CH2O(CH2CH2O)3CH3 | Nonafluorotriethyleneoxide methyl ether |
| TDFTME | CF3(CF2)5CH2O(CH2CH2O)3CH3 | Tridecafluorotriethyleneoxide methyl ether |
| HOFTME | CF2H(CF2)3CH2O(CH2CH2O)3CH3 | H-octafluorotriethyleneoxide methyl ether |
| HDDFTME | CF2H(CF2)5CH2O(CH2CH2O)3CH3 | H-dodecafluorotriethyleneoxide methyl ether |
| Alcohol PFAS | ||
| 8:1 FTOH | CF3(CF2)7CH2OH | 8:1 Fluorotelomer alcohol |
| FC8diol | (CF2)6(CH2)2(OH)2 | Perfluorooctane-1,8-diol |
| Hydrocarbons | ||
| SDBS | C18H29SO3Na | Na-dodecylbenzene sulfonate |
| SDS | C12H25SO4Na | Na-dodecyl sulfate |
| CTAB | C19H42NBr | Hexadecyltrimethylammonium bromide |
| Triton 45 | (CH3)3CCH2C(CH3)2C6H4-(OCH2CH2)nOH, n=4.5 | Octylphenol Ethoxylate |
| CAPB | Cocamidopropyl betaine |
Figure 5.
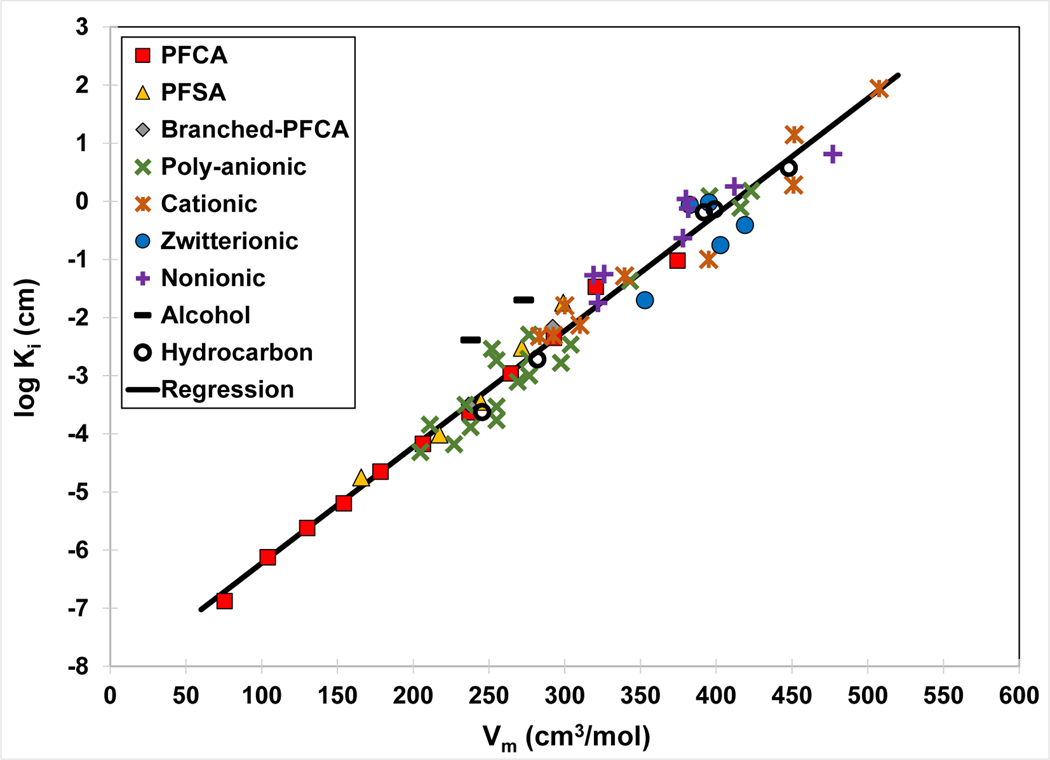
QSPR model for air-water interfacial adsorption coefficient (Ki) versus molar volume. The Ki values are calculated from PFAS and hydrocarbon-surfactant surface-tension data sets measured in deionized-water solutions. The regression equation is log Ki = 0.020 (±0.001) Vm − 8.2 (±0.30), r2 = 0.965. The PFAS and hydrocarbon surfactants are identified in Table 2. Figure revised from Brusseau (2019).
The log Ki-Vm regression is observed to provide an excellent representation of the measured data. Notably, the data span ~450 molar volume and 9 orders-of-magnitude for Ki, representing an extremely wide range of PFAS molecular sizes and tail lengths. As shown in Table 2, the data set includes anionic, cationic, zwitterionic, and nonionic head groups comprising different functional-group types. Additionally, a wide variety of tail structures is represented. Based on the robust high-resolution congruency demonstrated by the model for this highly diverse data set, it is anticipated that the QSPR model will be representative for many PFAS of interest.
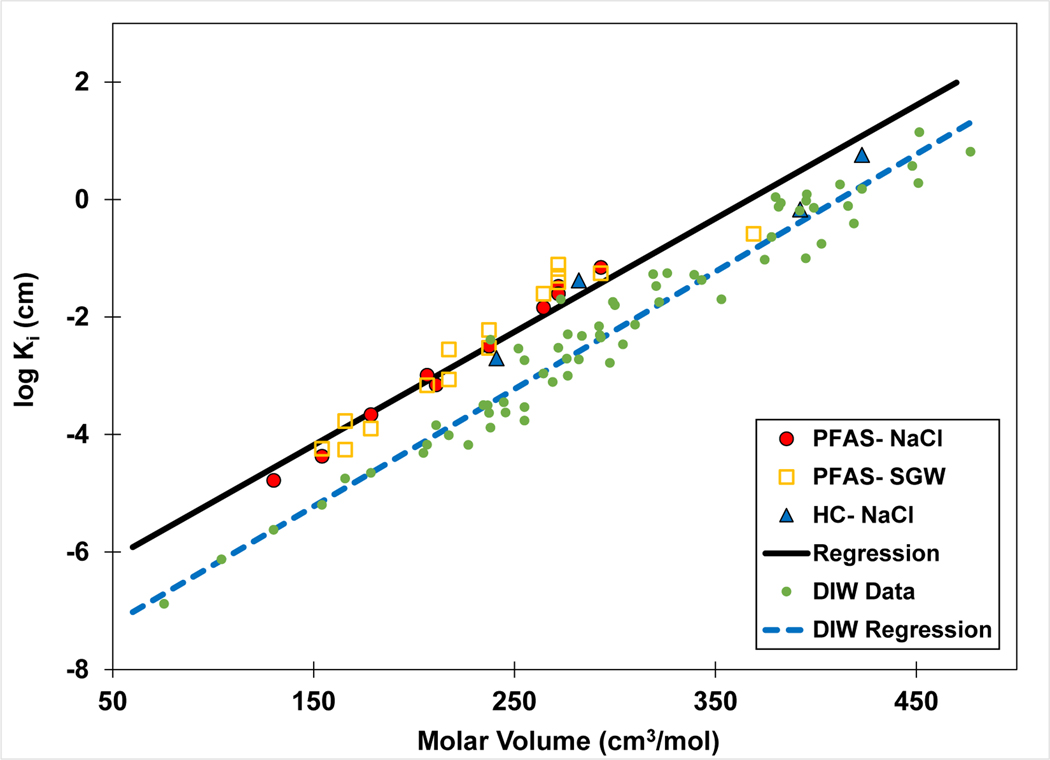
The measured data and QSPR model for electrolyte solutions is compared in Figure 6 to the model developed for deionized-water data. The regression slopes are statistically identical for the two data sets (see values reported in the respective figure captions). The coincident slopes indicate consistency in the relationship between log Ki and Vm for systems with differing solution characteristics. This reflects similarity of surface-activity behavior, which is expected given that interfacial adsorption is driven by the same hydrophobic-interaction process for both systems. The analysis presented here shows that molar volume is a good descriptor for characterizing surface activity, which is consistent with the findings of Brusseau (2019) and Brusseau and Van Glubt (2019). This is due to molar volume serving as an effective index of the influence of molecular size on solvation and hydrophobic interactions, as discussed by Brusseau (2019). The y-intercept for the electrolyte-solution data is greater than that of the deionized-water data, which reflects the influence of ionic strength on surface activity. The difference in intercepts produces an approximate factor of eight difference in Ki values.
Figure 6.
Comparison of QSPR models developed for PFAS in electrolyte (NaCl, SGW) and deionized-water (DIW) solutions. HC represents hydrocarbon surfactants.
Overall, the results presented in Figure 6 indicate consistency between the two QSPR models. One limitation of the QSPR model developed for the electrolyte solutions is that it is based on a moderate number of data sets representing a relatively narrow range of PFAS structures. Conversely, the QSPR model developed for the deionized-water data represents a wide range of PFAS structures. The similarity of the QSPR regression slopes for the two systems indicates that the QSPR model developed for electrolyte solutions should be representative for a wide variety of PFAS.
3.4. Reference Concentrations for PFAS Activity and Interfacial Adsorption
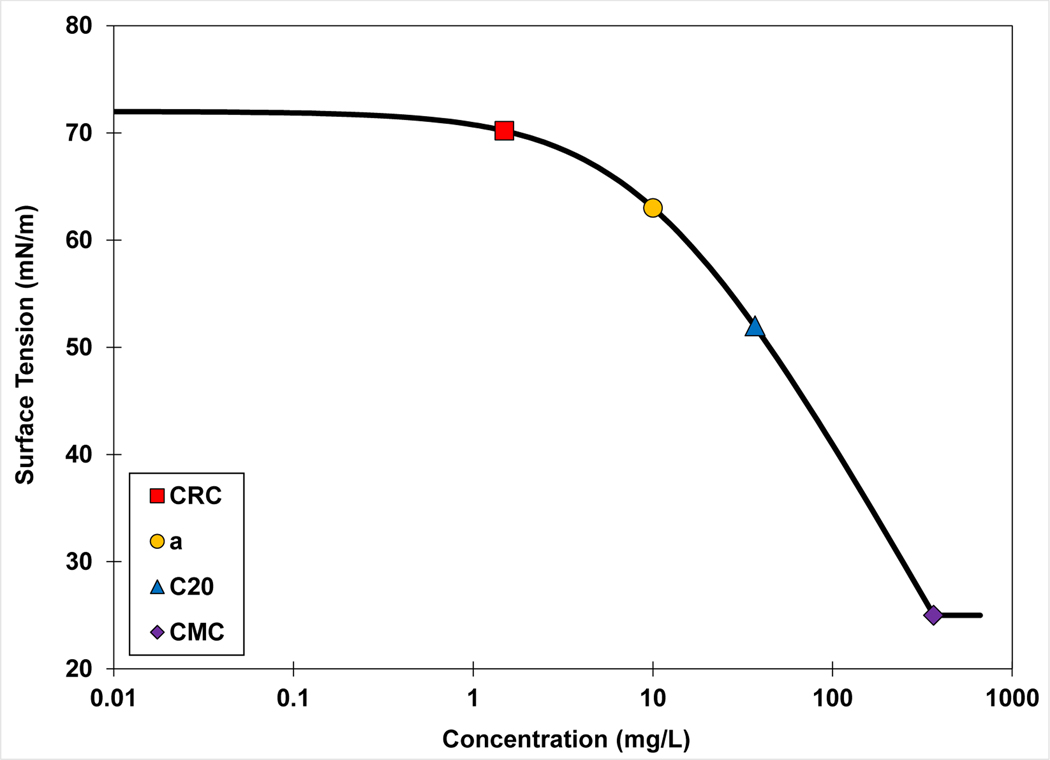
The γ-C function or surface-tension isotherm represents a characterization of the relationship between interfacial adsorption and solution activity of the surfactant, or equivalently a characterization of the surface activity of the surfactant. The γ-C function can be used to quantify surface activities and to compare and contrast among different surfactants. However, using the full γ-C function is cumbersome, and therefore single-value reference concentrations have been developed to serve as simplified indices of surfactant activity. The most commonly used reference concentration is the critical micelle concentration (CMC), representing the nominal concentration for onset of monomer aggregation. Another reference concentration is the C20 concentration, which represents the concentration of surfactant required to reduce surface tension of the solvent by 20 mN/m (Rosen and Kunjappu, 2012). The “a” parameter from the Szyszkowski equation can be used as another reference concentration (e.g., Chang and Franses, 1995; Rosen and Kunjappu, 2012). This term is equivalent to the reciprocal of the Langmuir adsorption coefficient (equation 4) and represents the concentration at which interfacial adsorption is half of the maximum. Brusseau (2019a, 2021) introduced the critical reference concentration (CRC), which is defined as the concentration at which the slope of the γ-C function begins to increase significantly. For this work, the CRC was quantitatively defined as the concentration at which the surface tension is decreased by 2.5%. The different reference concentrations are illustrated in Figure 7.
Figure 7.
Representative surface-tension curve illustrating the four reference concentrations discussed in the main text. CRC is the critical reference concentration (quantitatively defined as the concentration at which the surface tension is decreased by 2.5%), “a” is the Szyszkowski parameter, C20 represents the concentration at which surface tension is decreased by 20 mN/m, and CMC is the critical micelle concentration.
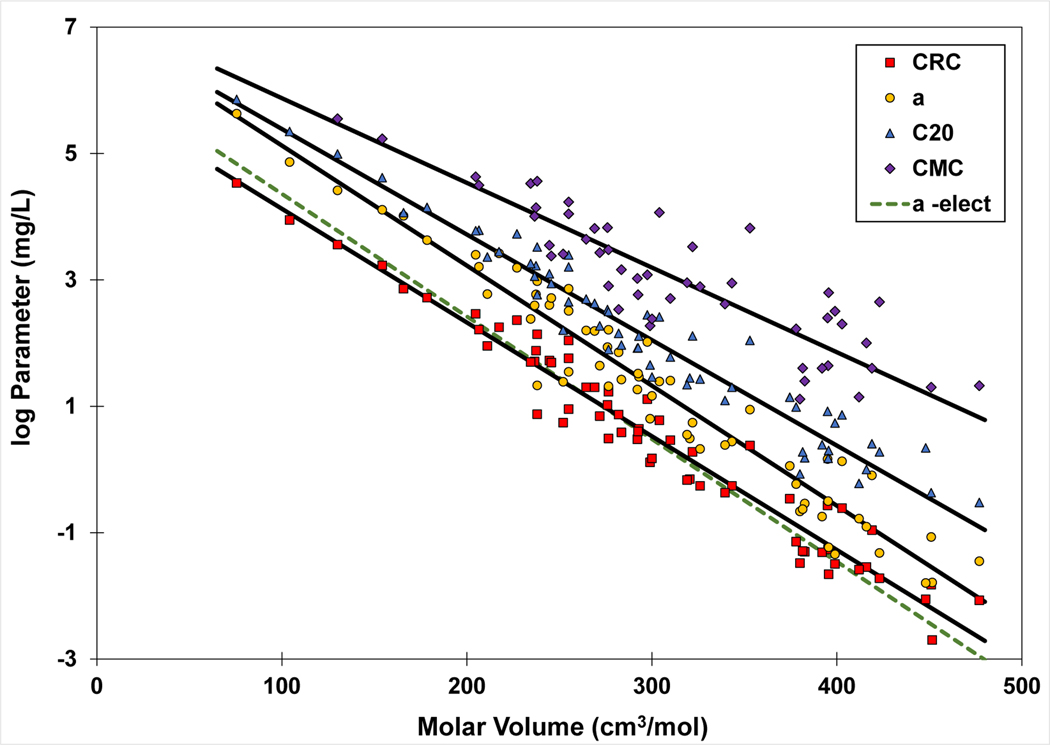
Each of the reference concentrations represents a specific and different condition with respect to the relative amount of surfactant adsorbed at the interface (the surface coverage) because of the nonlinearity of the γ-C function. For example, the CMC generally represents conditions of maximum surface coverage. Conversely, the CRC represents conditions of low surface coverage (< ~10%; Brusseau, 2021). The C20 and a-parameter represent intermediate ranges of surface coverage. However, all of these reference concentrations are reflections of the free energy of adsorption from solution. As such, they all exhibit log-linear relationships to molar volume (Figure 8).
Figure 8.
Relationship of various reference concentrations (“Parameter”) to molar volume. The reference concentrations are defined in the caption for Figure 7. “a-elect” represents the regression for the “a” parameter determined for the electrolyte-solution data set (the measured Ki values are not shown to reduce clutter). The regression coefficients are CRC: slope = −0.018, intercept = 5.9, r2 = 0.956; a: slope = −0.019, intercept = 7.0, r2 = 0.946; a-elect: slope = −0.0194, intercept = 6.3, r2 = 0.945; C20= slope = −0.0167, intercept = 7.0, r2 = 0.948; CMC: slope = −0.0134, intercept = 7.2, r2 = 0.788.
The slopes of the regressions for CRC and the a-parameter are very similar, whereas the slopes are somewhat smaller for the C20 and CMC regressions. This reflects in part the impact of different slopes for the γ-C function for different PFAS at higher aqueous concentrations (different b and Γm values). The “b” values range from approximately 0.06 to 0.3, and exhibit a weak correlation to molar volume (slope=−0.00032, intercept=0.26, r2=0.3). The CRC is roughly 7-times lower than the a-parameter concentration. The a-parameter regression for the electrolyte-solution data has a lower intercept compared to that of the deionized-water data as would be expected. Similarly, the CRC-Vm regression for the electrolyte-solution data (slope=−0.018, intercept=5.26, r2=0.950) has a smaller intercept than the deionized-water data. The b-parameter for the electrolyte-solution data exhibits a correlation to molar volume that is very similar to that obtained for the deionized-water data.
Each of the reference concentrations provide a measure of the relative surface activity of a given surfactant. The key question is which is most relevant for the objectives of the target application. For applications concerning PFAS transport and fate in environmental systems, one objective would be to define conditions wherein air-water interfacial adsorption is essentially linear, such that Ki can be treated as practically constant. Characterizing and simulating PFAS retention and transport would be simplified under such conditions. Clearly, the CMC is not appropriate for this objective. Inspection of Figure 7 shows that surface tensions change significantly with small changes in concentration in the regions represented by the C20 and a-parameter reference concentrations, meaning that air-water interfacial adsorption is nonlinear in those regions. In addition, use of the a-parameter is complicated by the fact that the “b” parameter varies across different PFAS. Conversely, surface tension changes minimally below the CRC. The CRC represents the condition of low surface coverage, wherein air-water interfacial adsorption is essentially linear and Ki values are essentially constant for concentrations lower than the CRC (Brusseau, 2019, 2021). Hence, the CRC would be the most relevant reference concentration for the designated target objective.
The QSPR model was developed using maximum Ki values, and is therefore applicable for PFAS concentrations that are lower than the respective CRCs. The CRC-Vm correlation can be used to determine the relevant CRC for a given PFAS, from which one can delineate the applicability of the model. An alternative approach can be used to estimate Ki values for cases wherein the concentration of interest is greater than the CRC, and air-water interfacial adsorption is nonlinear (i.e., Ki is a function of concentration). The a-Vm and b-Vm correlations can be used to estimate values for “a” and “b”, which can then be used with equations 4 and 5 to determine the Ki for the target concentration.
4. Conclusions
The influence of PFAS molecular structure on air-water interfacial adsorption in aqueous solutions comprising environmentally representative ionic strengths was investigated in this study. Surface tensions were measured for several PFAS in a 0.01 M synthetic groundwater solution and a 0.01 M NaCl reference solution. In addition, surface-tension data measured in environmentally representative ionic-strength solutions were compiled from the literature. Interfacial adsorption coefficients were determined from the measured and literature-reported surface/interfacial tension data.
It was demonstrated that changes in ionic strength within environmentally relevant ranges had minimal impact on air-water interfacial adsorption. The QSPR analysis provided a very good representation of the data sets and demonstrated consistent results with previous studies despite differences in solution properties. The results of the study indicate that the QSPR model developed herein should be applicable for a wide range of solution ionic strengths and compositions, and for a wide variety of PFAS. Hence, it is anticipated that the model will serve as a useful method for estimating air-water interfacial adsorption coefficients for characterizing and simulating PFAS transport and fate in environmental systems.
Highlights.
Air-water interfacial adsorption coefficients for PFAS in electrolyte solution
Adsorption coefficient trends with compound properties and solution characteristics
Minimal ionic strength impact for non-zero ionic strength solutions
QSPR model is developed to predict interfacial adsorption coefficients for PFAS
Acknowledgements
This research was supported by the NIEHS Superfund Research Program (grant #P42 ES 4940) and by the National Science Foundation (2023351). We thank Ying Lyu and Ni Yan for their assistance in measuring surface tensions. We also thank the reviewers for their constructive comments.
Footnotes
Credit Author Statement
Mark L. Brusseau: Conceptualization, Methodology, Resources, Supervision, Investigation, Analysis, Writing- Original draft preparation, Writing- Review & Editing.
Sarah Van Glubt: Investigation, Analysis, Writing- Original draft preparation, Writing- Review & Editing.
Declaration of interests
The authors declare that they have no known competing financial interests or personal relationships that could have appeared to influence the work reported in this paper.
Publisher's Disclaimer: This is a PDF file of an unedited manuscript that has been accepted for publication. As a service to our customers we are providing this early version of the manuscript. The manuscript will undergo copyediting, typesetting, and review of the resulting proof before it is published in its final form. Please note that during the production process errors may be discovered which could affect the content, and all legal disclaimers that apply to the journal pertain.
References
- An SW; Lu JR; Thomas RK Apparent anomalies in surface excesses determined from neutron reflection and the Gibbs equation in anionic surfactants with particular reference to perfluorooctanoates at the air/water interface. Langmuir 1996, 12, 2446–2453. [Google Scholar]
- Barnes G, Gentle I, 2011. Interfacial Science: an Introduction, Second edition. Oxford University Press, New York, NY. [Google Scholar]
- Boutevin G; Tiffes D; Loubat C; Boutevin B; Amenuri B. New fluorinated surfactants based on vinylidene fluoride telomers. J. Fluor. Chem 2012, 134, 77–84. [Google Scholar]
- Brusseau ML Assessing the potential contributions of additional retention processes to PFAS retardation in the subsurface. Sci. Total Environ 2018, 613–614, 176–185. [DOI] [PMC free article] [PubMed] [Google Scholar]
- Brusseau ML The influence of molecular structure on the adsorption of PFAS to fluid-fluid interfaces: Using QSPR to predict interfacial adsorption coefficients. Wat. Res 2019, 152, 148–158. [DOI] [PMC free article] [PubMed] [Google Scholar]
- Brusseau ML Simulating PFAS transport influence by rate-limited multi-process retention. Wat. Res 2020, 168, 115179. [DOI] [PMC free article] [PubMed] [Google Scholar]
- Brusseau ML Examining the robustness and concentration dependency of PFAS air-water and NAPL-water interfacial adsorption coefficients. Water Res. 2021, 190, 116778. [DOI] [PMC free article] [PubMed] [Google Scholar]
- Brusseau ML; Van Glubt S. The influence of surfactant and solution composition on PFAS adsorption at fluid-fluid interfaces. Wat. Res 2019, 161, 17–26. [DOI] [PMC free article] [PubMed] [Google Scholar]
- Brusseau ML; Yan N; Van Glubt S; Wang Y; Chen W; Lyu Y; Dungan B; Carroll KC; Holguin FO Comprehensive retention model for PFAS transport in subsurface systems. Wat. Res 2019, 148, 41–50. [DOI] [PMC free article] [PubMed] [Google Scholar]
- Campbell TY; Vecitis CD; Mader BT; Hoffmann MR Perfluorinated surfactant chain-length effects on sonochemical kinetics. J. Phys. Chem. A 2009, 113, 9834–9842. [DOI] [PubMed] [Google Scholar]
- Chang C-H and Franses EI Adsorption dynamics of surfactants at the air/water interface: A critical review of mathematical models, data, and mechanisms. Coll. Surf. A, 1995, 100, 1–45. [Google Scholar]
- Costanza J; Arshadi M; Abriola LM; Pennell KD Accumulation of PFOA and PFOS at the air-water interface. Environ. Sci. Technol 2019, 6, 487–491. [DOI] [PubMed] [Google Scholar]
- Downes N; Ottewill GA; Ottewill RH An investigation of the behaviour of ammonium perfluoro-octanoate at the air/water interface in the absence and presence of salts. Colloids Surf. A Physiochem. Eng. Asp 1995, 102, 203–211. [Google Scholar]
- Edmeades DC; Wheeler DM; Clinton OE The chemical composition and ionic strength of soil solutions from New Zealand topsoils. Australian J. Soil Res 1985, 23, 151–165. [Google Scholar]
- Fainerman VB; Lylyk SV; Aksenenko EV; Makievski AV; Petkov JT; Yorke J; Miller R. Adsorption layer characteristics of Triton surfactants 1. Surface tension and adsorption isotherms. Coll. Surf. A: Phys. Eng. Aspects 2009, 334, 1–7. [Google Scholar]
- Fedors R. A method for estimating both the solubility parameters and molar volumes of liquids. Poly. Eng. Sci, 1974, 14, 147–154. [Google Scholar]
- Guo B; Zeng J; Brusseau ML A mathematical model for the release, transport, and retention of per- and polyfluoroalkyl substances (PFAS) in the vadose zone. Wat. Resour. Res 2020, 56 doi: 10.1029/2019WR026667 [DOI] [PMC free article] [PubMed] [Google Scholar]
- Helyar KR; Porter WM Chapter 2. Soil acidification, its measurement and the processes involved. Soil Acidity and Plant Growth, 1989, Academic Press, San Diego, CA. [Google Scholar]
- Hendricks JO Industrial fluorochemicals. Ind. Eng. Chem 1953, 45, 99–105. [Google Scholar]
- Hill C, Czajka A, Hazell G, Grillo I, Rogers SE, Skoda MWA, Joslin N, Payne J, Eastoe J, 2018. Surface and bulk properties of surfactants used in fire-fighting. J. Colloid Interface Sci. 530, 686–694. [DOI] [PubMed] [Google Scholar]
- Lin C; Pan R; Xing P; Jiang B. Synthesis and surface activity study of novel branched zwitterionic heterogemini fluorosurfactants with CF3CF2CF2C(CF3)2 group. J. Fluor. Chem 2018a, 214, 35–41. [Google Scholar]
- Lin C; Pan R; Xing P; Jiang B. Synthesis and combined properties of novel fluorinated cationic surfactants derived from hexafluoropropylene dimer. Chinese Chem Letters.2018b, 29, 1613–1616. [Google Scholar]
- López-Fontán JL; Sarmiento F; Schulz PC The aggregation of sodium perfluorooctanoate in water. Colloid Polym. Sci 2005, 283, 862–871. [Google Scholar]
- Lunkenheimer K; Prescher D; Hirte R; Geggel K. Adsorption properties of surface chemically pure sodium perfluoro-n-alkanoates at the air/water interface: Counterion effects within homologous series of 1:1 ionic surfactants. Langmuir 2015, 31, 970–981. [DOI] [PubMed] [Google Scholar]
- Lyu Y; Brusseau ML The influence of solution chemistry on air-water interfacial adsorption and transport of PFOA in unsaturated porous media. Sci. Total Environ 2020, 713, 136744. [DOI] [PMC free article] [PubMed] [Google Scholar]
- Lyu Y; Brusseau ML; Chen W; Yan N; Fu X; Lin X. Adsorption of PFOA at the air-water interface during transport in unsaturated porous media. Environ. Sci. Technol 2018, 52, 7745–7753. [DOI] [PMC free article] [PubMed] [Google Scholar]
- Meissner E; Myszkowski J. Synthesis and surface activity of sodium salts of branched perfluorocarboxylic acids and their analogs containing one chlorine atom. J. Chem. Tech. Biotechnol 1992, 55, 273–276. [Google Scholar]
- Mitchell Mark, Muftakhidinov Baurzhan, Winchen Tobias. Engauge Digitizer Software. Webpage http://markummitchell.github.io/engauge-digitizer/
- Nakahara H; Shibata O; Moroi Y. Examination of surface adsorption cetyltrimethyl ammonium bromide and sodium dodecyl sulfate. J. Phys. Chem. B, 2011, 115, 9077–9086. [DOI] [PubMed] [Google Scholar]
- Ngo THV; Damas C; Naejus R; Coudert R. Synthesis and comparative behaviour study of fluorocarbon and hydrocarbon cationic surfactants in aqueous media. J. Fluor. Chem 2010, 131, 704–708. [Google Scholar]
- Padoan G; Darmanin T; Zaggia A; Amigoni S; Conte L; Guittard F. Characterization of air/water interface adsorption of a series of partially fluorinated/hydrogenated quaternary ammonium salts. J. Fluor. Chem 2015, 178, 241–248. [Google Scholar]
- Peverill KI, Sparrow LA, and Reuter DJ Soil Analysis: An Interpretation Manual. 1999. CSIRO Publishing, Australia. [Google Scholar]
- Rodriguez C; Kunieda H; Noguchi Y; Nakaya T. Surface-tension properties of novel phosphocholine-based fluorinated surfactants. J. Coll. Inter. Sci 2001, 242, 255–258. [Google Scholar]
- Rosen MJ, Kunjappu JT, 2012. Surfactants and Interfacial Phenomena. John Wiley and Sons, Hoboken, New Jersey. [Google Scholar]
- Shen J, Bai Y, Tai X, Wang W, Wang G. Surface activity, spreading, and aggregation behavior of ecofriendly perfluoropolyether amide propyl betaine in aqueous solution. ACS Sustain. Chem. Eng 2018, 6, 6183–6191. [Google Scholar]
- Shinoda K; Nakayama H. Separate determinations of the surfac excesses of surface-active ions and of gegenions at the air-water solution interface. J. Colloid Sci 1963, 18, 705–712. [Google Scholar]
- Silva J. Baseline data acquisition and numerical modeling to evaluate the fate and transport of PFAS within the vadose zone. SERDP Project ER18–1389, public release data of June 2020.
- Silva JAK; Martin WA; Johnson JL; McCray JE Evaluating air-water and NAPL-water interfacial adsorption and retention of perfluorocarboxylic acids within the vadose zone. J. Contam. Hydrol 2019, 223, 103472. [DOI] [PubMed] [Google Scholar]
- Sparks DL Chapter 9. The chemistry of soil acidity. Environmental Soil Chemistry 2nd Edition, 2003, Academic Press, San Diego, CA. [Google Scholar]
- Staszak K, Wieczorek D, Michocka K. Effect of sodium chloride on the surface and wetting properties of aqueous solutions of cocamidopropyl betaine. J. Surfactants Deterg 2015. 18, 321–328. [DOI] [PMC free article] [PubMed]
- Tadros Th.F. Thermodynamics of micellization of fluorocarbon surfactants. J. Coll. Interface Sci 1980, 74, 196–200. [Google Scholar]
- Tamaki K; Ohara Y; Watanabe S. Solution properties of sodium perfluoroalkoanoates. Heats of solution, viscosity B coefficients, and surface tensions. Bull. Chem. Soc. Jpn 1989, 62, 2497–2501. [Google Scholar]
- Van Glubt S. and Brusseau ML Contribution of nonaqueous-phase liquids to the retention and transport of per and polyfluoroalkyl substances (PFAS) in porous media. Environ. Sci. Technol 2021, 55, 3706–3715. [DOI] [PMC free article] [PubMed] [Google Scholar]
- Vecitis CD; Park H; Cheng J; Mader BT; Hoffman MR Enhancement of perfluorooctanoate and perfluorooctanesulfonate activity at acoustic cavitation bubble interfaces. J. Phys. Chem. C 2008, 112, 16850–16857.
- Wang Q; Zhang S; Geng B; Zhang L; Zhao J; Shi J. Synthesis and surface activities of novel monofluoroalkyl phosphate surfactants. J. Surfact. Deterg 2012, 15, 83–88. [Google Scholar]
- Yan N; Ji Y; Zhang B; Zheng X; Brusseau ML Transport of GenX in saturated and unsaturated porous media. Environ. Sci. Technol 2020, 54, 11876–11885. [DOI] [PMC free article] [PubMed] [Google Scholar]
- Zhai C; Zhang L; Azhar U; Zong C; Xu A; Zhang S; Zhang Y. Synthesis and performance of a Mono (dodecafluoroheptyl) acetate surfactant, J. Disper. Sci. Technol, 2019, 40, 431–439. [Google Scholar]


