

Abstract
Lung ultrasound (US) imaging has the potential to be an effective point-of-care test for detection of COVID-19, due to its ease of operation with minimal personal protection equipment along with easy disinfection. The current state-of-the-art deep learning models for detection of COVID-19 are heavy models that may not be easy to deploy in commonly utilized mobile platforms in point-of-care testing. In this work, we develop a lightweight mobile friendly efficient deep learning model for detection of COVID-19 using lung US images. Three different classes including COVID-19, pneumonia, and healthy were included in this task. The developed network, named as Mini-COVIDNet, was bench-marked with other lightweight neural network models along with state-of-the-art heavy model. It was shown that the proposed network can achieve the highest accuracy of 83.2% and requires a training time of only 24 min. The proposed Mini-COVIDNet has 4.39 times less number of parameters in the network compared to its next best performing network and requires a memory of only 51.29 MB, making the point-of-care detection of COVID-19 using lung US imaging plausible on a mobile platform. Deployment of these lightweight networks on embedded platforms shows that the proposed Mini-COVIDNet is highly versatile and provides optimal performance in terms of being accurate as well as having latency in the same order as other lightweight networks. The developed lightweight models are available at https://github.com/navchetan-awasthi/Mini-COVIDNet.
Keywords: Coronavirus, COVID-19, deep learning, detection, lung ultrasound (US) imaging, point-of-care testing
I. Introduction
Coronavirus disease (2019-nCov) is an illness which is caused by the novel coronavirus, and generally known as COVID-19. It is from the respiratory family of viruses, including middle east respiratory syndrome (MERS) and severe acute respiratory syndrome (SARS). The virus originated from Wuhan City from Hubei Province, China [1]. Human-to-human transmission via direct contact or droplets is a known characteristic of this virus, having a basic reproduction number of 2.24–3.58 and an incubation period of 2–14 days [2]. Patients suffer from rhinorrhea, chest pain, cough, muscle ache, shortness of breath, confusion, headache, sore throat, diarrhea, fever, nausea, and vomiting according to a study of 99 patients with COVID-19 [3]. The standard test included for detection of COVID-19 is molecular diagnostic test, i.e., a real-time reverse transcriptase-polymerase chain reaction (RT-PCR) with near perfect specificity and high analytical sensitivity for laboratory-based performance [4]. The performance of the same in clinical practice is severely affected by factors such as specimen types, adequacy of specimen, stage of infection, and specimen handling, including sample acquisition time from the onset of COVID-19. The rapid spread of COVID-19 has resulted in shortage of reverse RT-PCR test kits for the detection of COVID-19 and has led to the exploration of other options, such as chest computed tomography (CT), chest X-ray (CXR) and lung ultrasound (US) imaging for screening of COVID-19.
X-ray and CT imaging modalities have seen wider applicability for detection of COVID-19 as RT-PCR tests in the clinical setting have low sensitivity and specificity [4]. Various studies have shown the benefit of using CXR or CT and proven to improve results for detection of COVID-19 in the clinical scenario [5]–[9]. The low sensitivity of RT-PCR technique requires repeated negative tests resulting in short supply or unavailability of kits at various parts of the globe [5]. Also, CT scans can result in false negatives when the infection is in the early stages and requires time consuming detailed disinfection procedure. Although CT has the required promise for becoming modality of choice for detection of COVID-19 [9], lung US has got the attention recently due to US machines being widely available and are relatively cheaper with added advantage of being safe and easy to disinfect.
US imaging is a noninvasive technique, it is already replacing X-ray in diagnosis of lung related diseases [10]–[12]. Recently there has been a wide interest in point of care US based on evidence-based and expert consensus [13], [14]. The benefits of point-of-care ultrasound (POCUS) lies with being cost effective, easy to transport, and bedside accessibility for care of patients. It is not widely used currently as it lacked training pathways and also understanding of evidence behind this modality. It was found that it improves traditional examinations in diagnosis and the technology is expanding rapidly. It was also proposed that POCUS should be integrated into the acute and internal medicine curricula for widespread utility [15].
Previous studies proposed that critical care ultrasound (CCUS) can be utilized for monitoring the progression of the COVID-19 pneumonia [16], [17]. Since the disease progression varies and US imaging is cheap, noninvasive, and nonradiating, it is the preferred modality of choice for widespread use. The US imaging can be performed daily for patients having severe infection of the lungs due to COVID-19 for better management [16], [17]. The recent work [18] utilizes POCUS for diagnosis of COVID-19 and was found to be very effective for rapid screening as well as diagnosis of COVID-19 in symptomatic patients. It was also concluded that lung POCUS was not very accurate for patients having a history of heart failure, severe emphysema, and interstitial lung disease [18]. The availability and use of POCUS screening helped in the identification of symptomatic patients having COVID-19 and does not require performing the RT-PCR test in the resource-constrained settings and during peak periods of a surge in COVID-19 [18]. In [19], it was suggested to use positive US signs as markers for identification of persons having COVID-19 unless otherwise proven negative by RT-PCR and suggested the possibility of a classification system based on US images (US-COVID-CORADS). The work presented here is an effort in the direction of building a model for classification and assessment of the lung damage although more analysis/efforts are required by capturing more data with different acquisition schemes. Moreover, the models that are part of this work will allow better triaging of patients in busy centers with lung US.
This work was aimed at making point-of-care testing of COVID-19 using lung US imaging a reality. Typical point-of-care testing facilities does not have well trained clinical personnel and even the computing infrastructure in these settings is limited. This work provides a lightweight mobile friendly deep learning models for automated detection of COVID-19 based on lung US images. The aim here is that these models should be trainable in less than half-an-hour and deployable in mobile platforms and provide detection accuracy of COVID-19 on par or better than a human expert. Three different classes including COVID-19, Pneumonia, and healthy were included in this detection task.
The main contributions of this work are as follows.
-
1)
Efficient models, both in terms of the number of parameters as well as memory, were proposed for the detection of COVID-19 using lung US images to provide performance on par or better than a human expert.
-
2)
These models can be used in mobile or embedded applications making them universally appealing, especially in the point of care setting.
-
3)
The class imbalance problem was managed using the focal loss as the loss function to reduce the bias toward a particular class.
-
4)
With parameters being less, these networks are easily trainable on smaller data set and can provide site/imaging protocol-specific models for wider acceptance.
-
5)
This work also benchmarks the state-of-the-art lightweight networks that were proposed previously for computer vision tasks to show their efficacy in detection of COVID-19 using lung US images.
-
6)
This work also provides a comparison of the proposed as well as available lightweight networks in terms of their training as well as inference on low-cost embedded platforms to show the utility in a point of care setting.
II. Related Works
Lung imaging is found to be one of the techniques for capturing the information content and detection of COVID-19. The modalities that are currently being utilized for the diagnosis of the COVID-19 are the following ones and related work utilizing the same has been summarized in the respective subsections. A comparison of lung US and CXR imaging modalities was also briefly presented for completeness.
A. CXR
CXR is currently most widely utilized imaging technique for confirming the diagnosis of COVID-19. In [20], it was shown that the vast majority of patients (566 out of 636) were either having normal or mildly abnormal CXRs (89%) and thus it was concluded that a CXR alone may not be effective for detection of COVID-19. In [21], it was shown that the CXR frequently showed the bilateral peripheral consolidation, but the sensitivity was lower than the RT-PCR testing (69% versus 91%, respectively). In [22], on a small data set, it was found that the deep learning based detection model provided an accuracy of 91.24% and the true positive rate of 0.7879 with 6.88% false positives. It also highlighted the importance of having good resolution images, lack of large data set for providing more generalizability. There were various studies earlier to demonstrate the advantages of lung US imaging for detection of pneumonia and other lung conditions as in [23], the sensitivity of US was found to be better than the radiography. In [24], it was shown that due to higher specificity and sensitivity when compared to CXRs, US was proposed for first-line examinations for acute pneumonia cases. In [25], lung US was proven to be highly beneficial for diagnosing the community-acquired pneumonia (CAP) in hospitalized children. In [26], it was shown that due to a high negative prediction value, US has the potential to replace X-rays for excluding the lung consolidation in children and hence helps in reducing the exposure of radiation in the population. In [27], it was shown that lung US performance was superior to CXR for diagnosing pneumonia for those with frailty and advocated to be widely utilized for management and detection of acute respiratory symptoms in older patients.
B. CT
While CXR is one of the important modalities for the detection of chest abnormalities, it was also shown that chest CT is effective for the detection of abnormalities in the lung. The effectiveness for detection of COVID-19 using chest CT was also investigated earlier [28], [29]. A systematic review was also provided in [30], in which a literature search of various databases such as Google Scholar, PubMed, Elsevier, and World Health Organization was performed to provide an understanding of the follow-up CT and initial characteristics of COVID-19. Chest CT was found to be showing the greatest severity approximately after ten days of initial symptoms onset in patients with severe respiratory distress during COVID-19 course [31]. It was found that consolidation at chest imaging or bilateral ground-glass opacities (GGOs) will be the main signatures in assisting the radiologist for possible diagnosis as well as management of COVID-19 [32]. Many deep learning based architectures were proposed for detection of COVID including various pretrained architectures (including ResNet-50, LSTM, DenseNet-201, Location-attention etc. [9], [33]–[38]), architectures based on attention networks, and hybrid architectures. The achieved accuracy was as high as 98% even with number of samples available for training the network being less. In previous works, it was shown that the pretrained network-based architectures performed better as compared to training a network from scratch [34]–[38]. The same strategy of the utilization of pretrained networks coupled with utilization of smaller (lightweight) models was deployed in this work. The problems of infection control, limited CT availability in parts of the world, CT room decontamination, and coupled with high dose makes CT less attractive and portable chest radiography (CXR) was proposed as an alternative in identification of lung abnormalities [39].
C. US
A timeline of US findings and comparison with CT can be found in [40]. The characteristics in chest CT images were highly consistent with the lung US findings having irregular pleural line, subpleural consolidates, multilobar B-lines and decreased blood flow [41]–[43] and can be expected to follow similar timeline as of CT [40], [43]. Moreover, when the ratio of water, air, tissue is lower in the lung, it does not manifest itself as a complete specular reflector and hence various types of vertical artifacts will be present in the US images [44]–[46]. COVID-19 was found to be associated with pulmonary embolisms as well as cardiovascular complications and the lung US can also be effective in the diagnosis, including detection of pulmonary embolisms [47]. It was found that the lung US is more beneficial because of radiation damage absence, repeatability, safety, low cost, easy disinfection, and point of care use. It was suggested that in case findings of lung US were inconclusive then the chest CT to be utilized [43]. The lung US can be effectively utilized to monitor the progress, guide the position, making decisions when to remove the patient from ventilation support and managing extracorporeal membrane therapy [43]. Development of deep learning model for diagnosis of COVID-19 using US images was achieved by utilization of a VGG-Net architecture [48] and these developments were also highlighted in the recent survey [49]. Transfer learning was also utilized and it was shown that the deeper models are difficult to train and provide inconsistent performance over the different imaging modalities with limited data training [50]. Comparisons of CT with US imaging showed that they offer complementary information and can be utilized depending on the need (case to case) basis. While CT scan is more useful in case of severe clinical condition or for an initial assessment, lung US can be utilized as a first-level examination technique in the emergency department of low-risk patients and subsequent follow-ups [51]. An automatic, unsupervised method was developed using Viterbi algorithm and hidden Markov model (HMM) followed by support vector machine (SVM) for localization and detection of pleural lines in US imaging [52]. This technique achieved an accuracy of 84% and 94% for convex and linear probes. Another custom model based on deep learning was proposed for the presence and absence of B-lines and gave a sensitivity of 93% and specificity of 96%. This custom model was found to be successful in distinguishing between B-line severity and improved detection of presence and absence of B-lines and was found to be easily integrated in the US system [53]. Another recent work based on deep learning utilized spatial transformer networks to provide a simultaneous prediction of severity score and segmentation of abnormalities related to COVID-19 lung US images [54] in a weakly supervised manner. The main task in this work [54] was to provide pixel-level segmentation of abnormalities pertaining to COVID-19 in lung US images. There have been some attempts to make lung US a choice of imaging modality for detection of pneumonia and other diseases related to lung utilizing deep learning [55].
III. Data Set
The data set utilized in this work was the same one as given in [48] and is explained briefly for completeness. The data set consists of 64 videos of lung US with 11 of them being belonging to healthy patients, 14 videos of pneumonia patients, and 39 videos of COVID-19 patients. These 64 videos were taken from different sources and hence differ in format and illumination. The videos were assumed to be having a frame rate of 3 Hz and a maximum of 30 frames per video to enable the extraction of lung US images that form the basis of the lung US image data set utilized in this work. This resulted in a total of 1103 lung US images (182 healthy, 277 pneumonia, and 678 COVID-19). Since the data set is small, we utilized a fivefold validation for the classification of the data set into the three classes. In fivefold cross validation, the data set was divided into five subsets and the classification/detection task was repeated five times. Each time, one of the subsets gets utilized as the test set, while all remaining four subsets become part of the training set. The advantage of performing this cross validation is that irrespective of data set division during the testing and the training, each data sample is present in the test set exactly once and in the training set exactly four times. The only disadvantage of this technique is that the model needs to rerun five times, which means it takes five times as much computation to make any evaluation [56]. As the developed models here are lightweight and geared toward deploying in a limited computing environment (mobile type), the total computational time required for this fivefold validation is in the same order as any other traditional deep learning models that get trained for this purpose. Note that the data set splitting into these five subsets are at the patient (available video) level and not at the corresponding images level. So the fivefold cross validation that was performed on a particular model was with test data that the network has never seen at the patient level. The data set was further augmented using rotation, horizontal and vertical flip, width, and height scaling during training of each network. The number of samples per class in each of the five folds is chosen uniformly and exact sample numbers are provided in Table I.
TABLE I. Comparison of Number of Samples (Training as Well as Validation) Per Class in Each of the Fold for COVID, Pneumonia and Healthy Classes.
| Fold | Covid (Training/Validation) |
Pneumonia (Training/Validation) |
Healthy (Training/Validation) |
|---|---|---|---|
| 1 | 562/116 | 219/58 | 142/40 |
| 2 | 557/121 | 217/60 | 141/41 |
| 3 | 540/138 | 206/71 | 156/26 |
| 4 | 486/192 | 235/42 | 149/33 |
| 5 | 567/111 | 231/46 | 140/42 |
IV. Methods
Various deep learning models have been developed for the detection of COVID-19 using CT, CXR, and US images. The detection of COVID-19 using lung US images has been posed as a three-class problem, i.e., to accurately classify the lung US images into healthy, pneumonia, and COVID-19 cases (representative US images corresponding to each of these classes are given in Fig. 1). As the main aim of this work is to propose a COVID-19 detection algorithm based on point-of-care US imaging, the emphasis has been on smaller (lightweight) networks that can run on mobile or embedded systems to provide bed-side and immediate detection without the need for additional computing hardware. The computational complexity of each of the deep learning [convolutional neural network (CNN)] model can be known by the number of floating-point operations (FLOPs) and the same was computed using the TensorFlow built-in profiler. These models were presented in detail in the following.
Fig. 1.

Example lung US images utilized in this work representing classes (rowwise) of (a) healthy lung, (b) pneumonia infected lung, and (c) lung infected with COVID-19 exhibiting pleural irregularities and small subpleural consolidation.
A. State of the Art Models
1). COVID-Caps:
This architecture has been previously utilized for the identification of COVID-19 infected cases using CXR images and gave high values of specificity and sensitivity. It is an ultracompact model that utilizes spatial correlation. It consists of four convolutional layers and three capsule layers [57]. The initial layer is a convolutional layer succeeded by batch normalization (BN). This layer was followed by another convolutional layer superseded by average pooling. Alike, the third and fourth layers are convolutional layers, with the fourth layer being reshaped to obtain the first capsule layer. Later, these three convolutional layers were embedded in the COVID-CAPS for the subdue by agreement process. The ultimate layer has the instantiation parameters of three classes as the task at hand involves classifying lung US images into three classes. The cross entropy loss function was utilized with Adam [58] as an optimizer with an initial learning rate set as 1e-4. The network parameter details as well as memory required were provided in the first row of Table II. For completeness, a scaled version in terms of matching the number of parameters with the proposed Mini-COVIDNet of the model was also included and the details of the same are presented in the third row of Table II.
TABLE II. Comparison of Various Lightweight Deep Learning Models Utilized in This Work in Terms of Parameters, Corresponding Required Memory (in MB), as Well as the Number of FLOPs.
| Method | Total no. of Parameters | Trainable | Non-Trainable | Memory (in MB) | Giga Flops |
|---|---|---|---|---|---|
| COVID-CAPS | 295,616 | 295,488 | 128 | 4.51 | 8.8 |
| COVID-CAPS(Focal) | 295,616 | 295,488 | 128 | 4.51 | 8.8 |
| COVID-CAPS Scaled | 3,094,432 | 3,093,920 | 512 | 37.82 | 55.4 |
| COVID-CAPS Scaled (Focal) | 3,094,432 | 3,093,920 | 512 | 37.82 | 55.4 |
| POCOVID-Net | 14,747,971 | 2,392,963 | 12,355,008 | 225.04 | 30.7 |
| POCOVID-Net(Focal) | 14,747,971 | 2,392,963 | 12,355,008 | 225.04 | 30.7 |
| Mini-COVIDNet | 3,361,091 | 3,338,947 | 22,144 | 51.29 | 1.15 |
| Mini-COVIDNet(Focal) | 3,361,091 | 3,338,947 | 22,144 | 51.29 | 1.15 |
| MOBILE-Net-V2 | 2,422,979 | 2,388,611 | 34,368 | 36.97 | 0.613 |
| MOBILE-Net-V2(Focal) | 2,422,979 | 2,388,611 | 34,368 | 36.97 | 0.613 |
| NASNetMOBILE | 4,406,039 | 4,369,045 | 36,994 | 67.23 | 1.15 |
| NASNetMOBILE(Focal) | 4,406,039 | 4,369,045 | 36,994 | 67.23 | 1.15 |
| ResNet50 | 23,851,011 | 23,797,635 | 53,376 | 291.30 | 7.75 |
| ResNet50(Focal) | 23,851,011 | 23,797,635 | 53,376 | 291.30 | 7.75 |
2). POCOVID-Net:
Here a convolutional part of VGG-16 [59], which was known to provide good performance on a very large computer vision data set, was utilized for detection of COVID-19 using lung US images [48]. It was followed by a hidden layer having ReLU activation with 64 neurons, dropout of 0.5 [60] followed by BN [61]. This was superseded with a softmax activated output layer. This model was originally used on the ImageNet data set for extracting the features from images. The last three layers’ weights were fine-tuned during training. The weights of other layers were frozen at the same time resulting in the number of parameters as shown in the fifth row of Table II. The loss function, in this case, was cross entropy and training was performed with Adam [58] optimizer and initial learning rate set as 1e-4.
3). ResNet:
Here a convolutional part of ResNet50 [59], which was known to provide good performance on very large computer vision data set such as ImageNet database, was utilized for detection of COVID-19 using lung US images [35]. It was followed by a hidden layer having ReLU activation with 64 neurons, dropout of 0.5 [60] followed by BN [61]. This was superseded with softmax activated output layer. This model was originally used on the ImageNet data set for extracting the features from images. The last three layers’ weights were fine-tuned during training. The weights of other layers were frozen at the same time resulting in the number of parameters as shown in the 13th row of Table II. The loss function in this case was cross entropy and training was performed with Adam [58] optimizer and initial learning rate set as 1e-4.
4). MOBILE-NET-V2:
There has been a wide interest in building smaller and efficient neural network models, that can be used in mobile and embedded vision applications. The most widely used one among these lightweight and efficient CNN models is MobileNet. It was originally developed for detecting the objects for mobile-based and embedded computer vision applications [62]. Following this, many models were developed using the same framework and for providing improved accuracy. One such example is MobileNetV2, which uses an inverted residual structure with shortcut connections between bottleneck layers [63]. MOBILE-NET-V2 architecture was shown in previous works to improve state-of-the-art performance among lightweight deep learning models for benchmarks and other multiple tasks [63]. It is based on an invertible residual structure, where the thin bottleneck layers have shortcut connections between them. The intermediate expansion layer utilizes lightweight convolutions to filter features and use those as a source of nonlinearity in the model. Also, it was found that removing nonlinearities that are present in the narrow layers was important to obtain the representational power. This leads to improved performance and provided an intuition leading to the design of this architecture. It was also shown that this approach allows decoupling of the input–output domains providing an easy framework for further analysis [63]. The details of this network, such as exact number of parameters and the corresponding memory, were listed in ninth row of Table II.
5). NASNetMOBILE:
NASNetMOBILE architectures utilize a new search space called as “NASNet search space” enabling the transferability with a new regularization technique known as “ScheduledDropPath”’ to provide more generalizability of the model [64]. These models have been shown to provide better performance especially for classification tasks and hence have been utilized here and compared with other lightweight architectures. In this architecture, the search was performed for the best convolutional layer on CIFAR-10 data set and then applied this layer to the ImageNet data set by stacking copies of this layer to design a NASNet architecture [64]. The details of this network, such as the exact number of parameters and the corresponding memory, were listed in the 11th row of Table II.
B. Proposed Model
1). Mini-COVIDNet:
The MobileNet based models have been shown to be very competent due to the fewer number of parameters, less model size (memory), and low latency of the model. They gave the benefit of choosing a smaller network that match the latency and size restrictions for a specific application. Generally, the smaller models focus on only the size of the model but do not give much consideration to the speed.
In this work, we propose a modified MobileNet model combined with focal loss, naming it as Mini-COVIDNet for improving the accuracy of the detection of COVID-19. This network utilizes depthwise separable convolutions and pointwise convolutions for a reduction in size [62]. Here, we have utilized the focal loss for MobileNet first time for the US data sets and compared it with other lightweight architectures. The comparison included a study to know the effect of utilization of focal loss on these architectures [65]. Since MobileNet has been trained on the ImageNet data set, we wanted to utilize the weights of the pretrained model for the US data set. Hence, the original model with the original weights was utilized with final layers being modified. The original model was appended by a hidden layer having ReLU activation with 64 neurons, dropout of 0.5 [60] followed by BN [61]. This was superseded with a softmax activated output layer. This model was originally deployed on ImageNet data set for extracting the features from images. The last three layers weights were fine-tuned during training for the problem at hand.
The benefits of using the MobileNet based architectures are as follows.
-
1)
Because of their low size, they can be used for mobile and embedded vision applications and can be trained easily with minimal computing hardware requirement.
-
2)
Generalize well because of having less number of parameters as compared to using very large networks.
The details of this network/architecture are presented in the following in detail.
Suppose the input has a size of
 with
with
 being the height and width of the input and the number of input channels being represented by
 . Assuming the filter has a shape of
 with
with
 being the height and width of the filter. The number of filters is represented by
 , application of the same on the input results in a size of
 , where
 is the height and width of the output and the number of channels in the output is being represented by
 . The computational cost of a regular convolution is
 |
The depthwise separable convolution for the same input of the same size can be computed in two steps.
-
1)Depthwise Convolution: Each input channel gets convolved by a filter of size
 for producing
 sized output. The cost of computation is
-
2)Pointwise Convolution: A filter of size
 was applied to the depthwise convolution output for producing an output of
 . The cost of computation is
The total cost can be written as the sum of both costs, resulting in
 |
The computational cost is reduced for depthwise separable convolution as compared to regular convolution and is given as
 |
Thus, if a
 convolution is performed using the depthwise separable convolution, it has nine to eight times less computational complexity as compared to the regular convolution operation owing to a negligible decrease in the accuracy of the model. Fig. 2 shows how a regular convolution can be factorized into a pointwise and a depthwise convolution. The summary of this model along with layerwise details were presented in Table III.
Fig. 2.

Steps involved in (a) traditional convolution and conversion of the same into (b) depthwise separable convolution. Here BN refers to batch normalization.
TABLE III. Mini-COVIDNet Architecture Utilized in This Work Detailing Each Layer Type and Its Corresponding Output Size. Each Convolutional Layer was Superseded by a BN Layer and a ReLU Layer. Notation Wise, Conv Refers to Convolution, pw: Pointwise, and dw: Depthwise.
| Layer (Type) | Output size |
|---|---|
| input-1 (InputLayer) | (None, 224, 224, 3) |
| conv1 (Conv2D) | (None, 112, 112, 32) |
| conv-dw-1 (DepthwiseConv2D) | (None, 112, 112, 32) |
| conv-pw-1 (Conv2D) | (None, 112, 112, 64) |
| conv-dw-2 (DepthwiseConv2D) | (None, 56, 56, 64) |
| conv-pw-2 (Conv2D) | (None, 56, 56, 128) |
| conv-dw-3 (DepthwiseConv2D) | (None, 56, 56, 128) |
| conv-pw-3 (Conv2D) | (None, 56, 56, 128) |
| conv-dw-4 (DepthwiseConv2D) | (None, 28, 28, 128) |
| conv-pw-4 (Conv2D) | (None, 28, 28, 256) |
| conv-dw-5 (DepthwiseConv2D) | (None, 28, 28, 256) |
| conv-pw-5 (Conv2D) | (None, 28, 28, 256) |
| conv-dw-6 (DepthwiseConv2D) | (None, 14, 14, 256) |
| conv-pw-6 (Conv2D) | (None, 14, 14, 512) |
| conv-dw-7 (DepthwiseConv2D) | (None, 14, 14, 512) |
| conv-pw-7 (Conv2D) | (None, 14, 14, 512) |
| conv-dw-8 (DepthwiseConv2D) | (None, 14, 14, 512) |
| conv-pw-8 (Conv2D) | (None, 14, 14, 512) |
| conv-dw-9 (DepthwiseConv2D) | (None, 14, 14, 512) |
| conv-pw-9 (Conv2D) | (None, 14, 14, 512) |
| conv-dw-10 (DepthwiseConv2D) | (None, 14, 14, 512) |
| conv-pw-10 (Conv2D) | (None, 14, 14, 512) |
| conv-dw-11 (DepthwiseConv2D) | (None, 14, 14, 512) |
| conv-pw-11 (Conv2D) | (None, 14, 14, 512) |
| conv-dw-12 (DepthwiseConv2D) | (None, 7, 7, 512) |
| conv-pw-12 (Conv2D) | (None, 7, 7, 1024) |
| conv-dw-13 (DepthwiseConv2D) | (None, 7, 7, 1024) |
| conv-pw-13 (Conv2D) | (None, 7, 7, 1024) |
| average-pooling2d (AveragePo | (None, 1, 1, 1024) |
| flatten (Flatten) | (None, 1024) |
| dense (Dense) | (None, 64) |
| batch-normalization (BatchNorm) | (None, 64) |
| relu (ReLU) | (None, 64) |
| dropout (Dropout) | (None, 64) |
| dense-1 (Dense) | (None, 3) |
Initially, we trained the network using the cross entropy based metric and realized that since the data set was imbalanced, we needed scaling of the data set. Hence, we utilized a focal loss based strategy for training the network to provide improved performance [66], [67]. The focal loss was explained in detail in the following text. If we denote the actual class by
 and
and
 to denote the estimated probability. The posterior probability
 then becomes
 |
Here,
 was computed using
 . The binary cross entropy loss can be written as
 |
Note that the gradient will be overshadowed by easily classified negative examples especially when the network was trained using the binary cross entropy loss due to existence of class imbalance. The focal loss can be described as a dynamic scaled version of cross entropy loss with its definition being
 |
The focal loss helps in down weighting the well classified examples and hence improves the accuracy of the classification scheme. The hyperparameter
 helps tuning of weight of different samples. If
 , it represents the binary cross entropy loss, while with a larger value of
 fewer easily classified samples contribute to the training loss, and the samples which are less in number are given more weight. Previous works have introduced hyperparameters to balance the losses from negative and positive samples or by normalizing the negative and positive loss by frequency of corresponding samples. However, it cannot handle the gradient saliency when there are hard negative samples tough to classify. Here, dynamic scaling with the posterior probability
 is used and a weighted focal loss can be utilized for handling the different classes having a different number of samples utilizing the following form of the focal loss:
 |
Here,
 introduces the weight for different classes. The cross entropy loss function was used with Adam [58] optimizer with initial learning rate set as 1e-4. As with the earlier models, the exact number of parameters as well as memory required for the network were given in the seventh row of Table II.
Note that except POCOVID-Net, the rest models were never deployed in the detection/classification of COVID-19 lung US images. Moreover, only COVID-CAPS was utilized earlier for the COVID-19 detection task using CXRs. To summarize, we have retrained four new networks in this work on lung US images and showed a systematic comparison of the same. To handle the class imbalance problem, the utilization of focal loss was implemented in the mini-COVIDNet. Results pertaining to the same were presented as a separate method to show the improvement achieved due to focal loss. Note that all networks except the COVID-CAPS utilized in this work have an addition of a 64 neurons hidden layer with ReLU activation, dropout of 0.5, superseded by BN. This was followed by an output layer for three classes on top of these existing models to perform the task at hand. All networks were trained for 50 epochs to be consistent for comparison and converged before reaching 50 epochs. The time taken for 50 epochs as well as the training time has been shown in Tables VII and IX. All computations in this work were performed on a Linux workstation consisting of a Intel Xeon Silver 4110 CPU with 2.10-GHz clock speed, 128-GB RAM and a Nvidia Titan RTX GPU with 24-GB memory.
TABLE VII. Comparison of Various Classification Models Discussed in Section IV Using Fivefold Cross Validation in Terms of Accuracy Across All Classes. The Last Column of the Table Shows Training Time (in Minutes) Required for Each Model.
| Model | Accuracy | Time for 50 epochs | Training Time (in min.) |
|---|---|---|---|
| COVID-CAPS | 0.686 | 17.74 | 6.03 |
| COVID-CAPS(Focal) | 0.657 | 16.43 | 10.19 |
| COVID-CAPS Scaled | 0.759 | 22.37 | 4.92 |
| COVID-CAPS Scaled(Focal) | 0.734 | 22.42 | 4.93 |
| POCOVID-Net | 0.829 | 26.03 | 7.29 |
| POCOVID-Net(Focal) | 0.832 | 18.90 | 4.05 |
| Mini-COVIDNet | 0.811 | 24.22 | 1.45 |
| Mini-COVIDNet(Focal) | 0.832 | 24.03 | 2.88 |
| MOBILE-Net-V2 | 0.793 | 17.45 | 5.93 |
| MOBILE-Net-V2(Focal) | 0.763 | 34.01 | 20.41 |
| NASNetMOBILE | 0.744 | 28.74 | 20.69 |
| NASNetMOBILE(Focal) | 0.771 | 17.19 | 6.88 |
| ResNet50 | 0.704 | 16.67 | 3.67 |
| ResNet50(Focal) | 0.748 | 19.47 | 3.89 |
TABLE IX. Comparison of Various Lightweight Deep Learning Models Utilized in This Work in Terms of Latency (in Seconds), Training Time on Nvidia Jetson AGX Xavier as Well as Corresponding Required Memory (in MB).
| Method | Latency (Raspberry Pi 4, Tensorflow Lite model) | Latency (Nvidia Jetson AGX Xavier, Tensorflow Lite model) | Latency (Nvidia Jetson AGX Xavier, Tensorflow model) | Memory in MB (Tensorflow Lite model) | Time for 50 epochs (Nvidia Jetson AGX Xavier, in Minutes) | Training Time (Nvidia Jetson AGX Xavier, in Minutes) |
|---|---|---|---|---|---|---|
| COVID-CAPS | 0.8493 | 0.7413 | 0.7259 | 1 | 67.5 | 22.95 |
| COVID-CAPS(Focal) | 0.8595 | 0.8021 | 0.8494 | 1 | 67.05 | 41.57 |
| COVID-CAPS Scaled | 3.2532 | 3.7950 | 1.0085 | 12 | 127.20 | 27.98 |
| COVID-CAPS Scaled (Focal) | 3.2892 | 3.2529 | 1.0344 | 12 | 140.18 | 30.84 |
| POCOVID-Net | 1.8386 | 2.1073 | 0.7205 | 56 | 72.98 | 20.43 |
| POCOVID-Net(Focal) | 1.8508 | 2.1120 | 0.7640 | 56 | 72.74 | 10.18 |
| Mini-COVIDNet | 0.1841 | 0.1150 | 0.7638 | 13 | 26.20 | 1.57 |
| Mini-COVIDNet(Focal) | 0.1849 | 0.1601 | 0.9373 | 13 | 27.90 | 3.34 |
| MOBILE-Net-V2 | 0.1465 | 0.0660 | 0.8872 | 9 | 23.57 | 8.01 |
| MOBILE-Net-V2(Focal) | 0.1465 | 0.0600 | 0.8987 | 9 | 24.27 | 14.56 |
| NASNetMOBILE | 0.3018 | 0.1402 | 1.7603 | 17 | 44.92 | 32.34 |
| NASNetMOBILE(Focal) | 0.3068 | 0.1488 | 1.8647 | 17 | 46.66 | 18.66 |
| ResNet50 | 0.8531 | 0.5589 | 0.7964 | 91 | 55.05 | 12.11 |
| ResNet50(Focal) | 0.8539 | 0.5528 | 0.7574 | 91 | 54.10 | 10.82 |
V. Figures of Merit
For quantitative comparison of the performance of the discussed deep learning methods for detection of COVID-19 (along with the other two classes), the following figures of merit were utilized.
A. Sensitivity/Recall
This is also known as the true positive rate or recall and can be defined as the proportion of actual positive cases that are correctly classified [68]. It can be written as
 |
where TP denotes the true positives, while FN denotes the false negatives.
B. Specificity
It is also called as the true negative rate and defined as the proportion of actual negatives that are correctly identified [68]. It can be computed using
 |
where TN denotes the true negatives, while FP denotes the false positives.
C. Precision
Precision is a measure of the ability of a model not to label a negative sample as positive one [69]. It can be defined as
 |
D. F1-Score
It is a measure of an accuracy and provides an easy comparison among different models for the same task [70]. It is given as
 |
where recall is the same as sensitivity defined in Section V-A.
E. Accuracy
Accuracy was defined as the number of images/frames correctly classified and given as
 |
This figure of merit is for all three classes combined and represented as one number to provide quantitative comparison of discussed models.
Note that the value of above discussed figures of merit will be between 0 to 1 and in all cases, the higher value (close to 1) indicates better performance of a model. These values (except accuracy) will be specific to a particular class (in here the number of classes being three).
VI. Hardware Implementation
All models were deployed on two embedded low-cost hardware devices that are attractive in the point of care settings (low-cost), namely Raspberry Pi 4 Model B and Nvidia Jetson AGX Xavier developer kit, which are also easy to integrate into the existing US scanner setup.
Raspberry Pi 4 Model B is the latest microprocessor released by Raspberry Pi Foundation. It is a cost-effective embedded system with a total cost of only
 35. It also provides improved connectivity, memory capacity, and processor speed, when compared with its predecessor Raspberry Pi 3 Model B+. To deploy the models on the embedded system, they must first be converted from Tensorflow to Tensorflow Lite version. Tensorflow Lite is developed by Tensorflow and works as an accelerator to reduce inference time of the deployed models. Tensorflow Lite has been used to deploy several deep learning models on mobile, IoT and embedded systems. All the proposed models were converted into the Tensorflow Lite version and were compared based on their inference time and memory size as shown in Table IX. The entire hardware setup of Raspberry Pi 4 Model B is shown in Fig. 3(a). It is important to note that Raspberry Pi can be considered equal to the mobile platform as the hardware specifications are similar to what is available in a typical smart phone (e.g., being 2-GB RAM). The cost specification is provided in Table X.
Fig. 3.
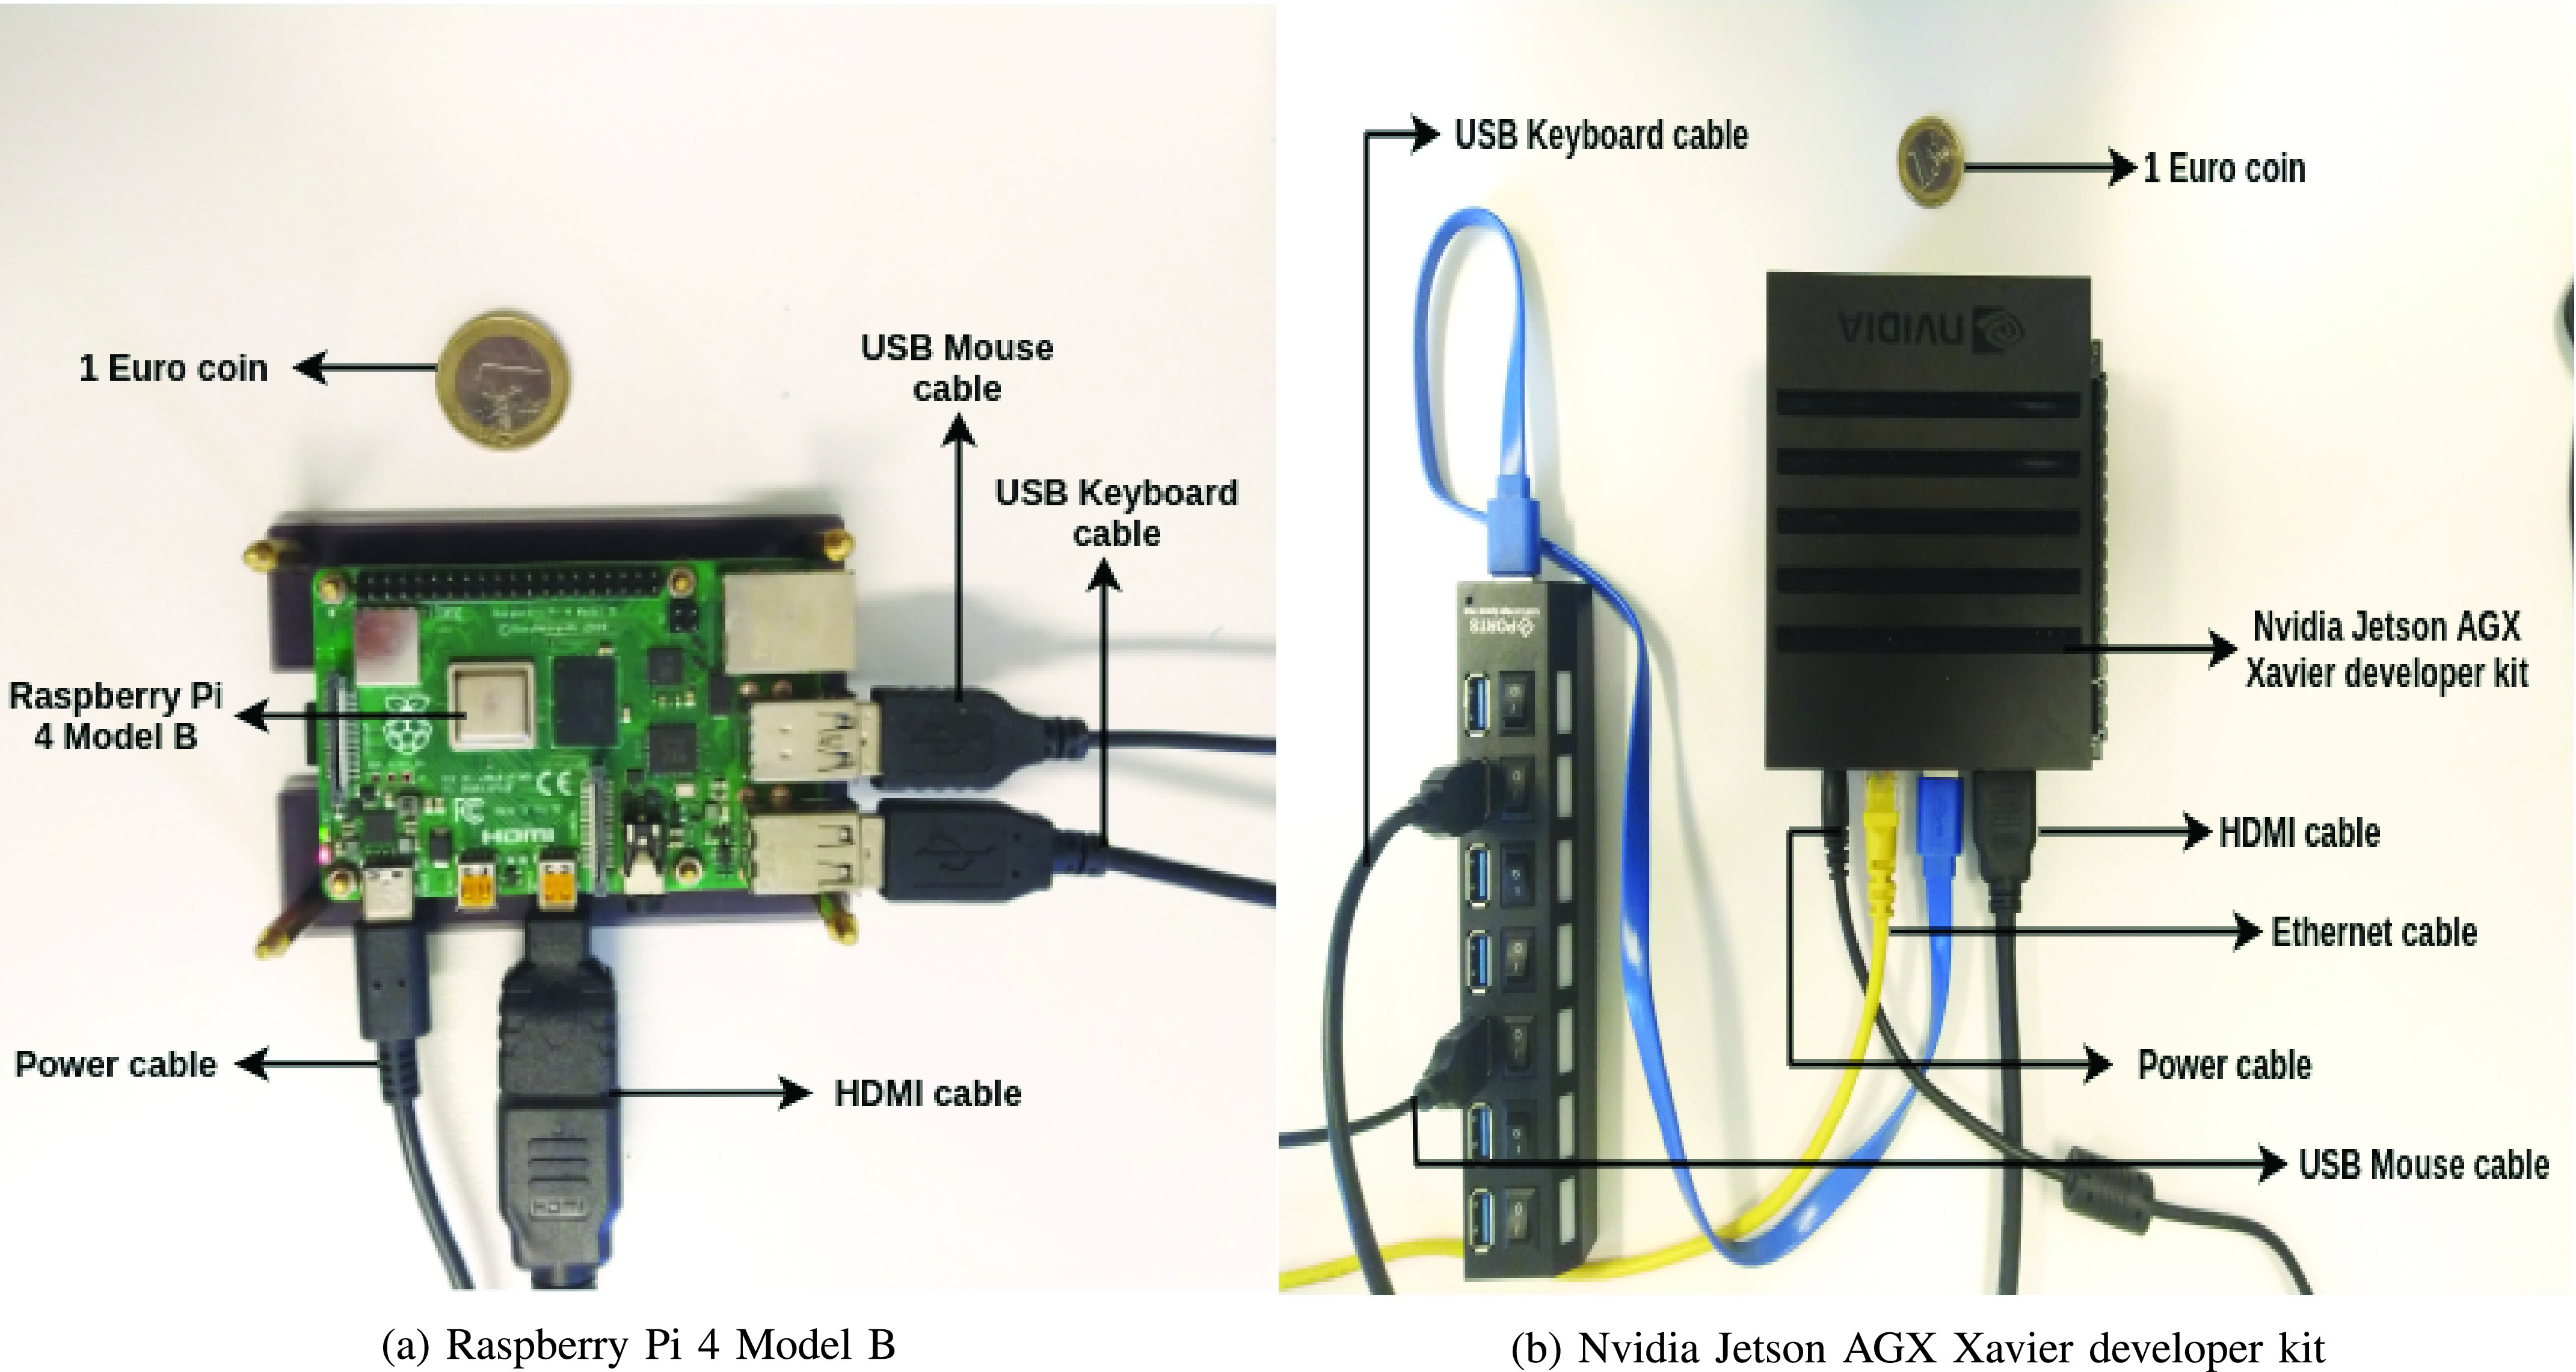
Hardware setup of (a) Raspberry Pi 4 Model B and (b) Nvidia Jetson AGX Xavier developer kit.
TABLE X. Comparison Among the Different Hardware Devices Used for Deploying Different Models Utilized in This Work in Terms of Cost and Available Memory.
| Device | Cost | Available Memory |
|---|---|---|
| Raspberry Pi 4 |
 35 35 |
2 GB RAM |
| Nvidia Jetson AGX |
 700 700 |
32 GB RAM & 1 GB GPU RAM |
| Nvidia Titan RTX |
 4300 4300 |
24 GB GPU RAM |
Next, the models were also deployed on Nvidia Jetson AGX Xavier developer kit, the latest version in the Jetson family released by Nvidia. Nvidia Jetson AGX Xavier developer kit is a deep learning model accelerator with an 8-core ARM CPU processor and a 512-core Volta GPU with Tensor cores, offering ten times better energy efficiency and 20 times better performance than its predecessor Nvidia Jetson TX2. The models were deployed in both the Tensorflow version and the Tensorflow Lite version and the comparison based on inference time can be seen in Table IX. The complete hardware setup of Nvidia Jetson AGX Xavier developer kit is shown in Fig. 3(b). As Nvidia Jetson also has the Volta GPU, this was also deployed for training and the required training time for each model has also been provided in Table IX.
Results in Table IX shows that the minimum latency was obtained for the MOBILE-Net-V2 models with the Mini-COVIDNet model being second lowest in the observed latency and hence gives better performance as compared to the other models. The latency was also obtained for the Nvidia Jetson AGX Xavier platform using the Tensorflow as well as Tensorflow Lite models. Again, the minimum latency was obtained for the MOBILE-Net-V2 models with the Mini-COVIDNet models being second lowest in the latency as observed with Raspberry Pi. The memory of the Tensorflow Lite model was also compared and shown in Table IX. It can be seen that memory requirements for the Mini-COVIDNet models are far less as compared to the POCOVID-Net and ResNet50 models and hence can be easily deployed on a hardware platform. The training time is also shown for the models on the Nvidia Jetson AGX Xavier platform and Mini-COVIDNet has 26.20 min as the training time on this system. Given that the proposed Mini-COVIDNet has better accuracy compared to MOBILE-Net-V2 (Table VII), a marginal increase in the latency as well as the training time including memory makes it worthwhile for deployment on hardware platforms.
VII. Results and Discussion
The results obtained in terms of figures of merit utilizing the discussed models in Section IV including mini-COVIDNet and POCOVID-Net have been shown in Tables IV–VI for the COVID-19, pneumonia, and healthy classes, respectively. The model size with the number of parameters have been summarized in Table II for all discussed models in this work. The memory size requirement of COVID-CAPS is very less as compared to the other models, but the performance of the same in terms of precision and F1-Score was poor compared to other models. POCOVID-Net performance is similar to Mini-COVIDNet while the number of parameters in the Mini-COVIDNet are lesser by 4.39 times, which results in a smaller model and hence can be deployed in a real embedded system (including mobile platforms) for preliminary detection of COVID-19. This makes Mini-COVIDNet attractive in the point-of-care setting, where the computing power is limited.
TABLE IV. Comparison of Performance of Discussed Models (Section IV) Using Fivefold Cross Validation for the COVID Class in Terms of Figures of Merit Discussed in Section V.
| Model | Sensitivity | Specificity | Precision | F1-Score |
|---|---|---|---|---|
| COVID-CAPS | 0.95 | 0.35 | 0.71 | 0.82 |
| COVID-CAPS(Focal) | 0.96 | 0.23 | 0.66 | 0.78 |
| COVID-CAPS Scaled | 0.92 | 0.54 | 0.76 | 0.83 |
| COVID-CAPS Scaled (Focal) | 0.99 | 0.36 | 0.67 | 0.81 |
| POCOVID-Net | 0.88 | 0.76 | 0.85 | 0.87 |
| POCOVID-Net(Focal) | 0.88 | 0.79 | 0.86 | 0.87 |
| Mini-COVIDNet | 0.92 | 0.68 | 0.82 | 0.86 |
| Mini-COVIDNet(Focal) | 0.92 | 0.71 | 0.83 | 0.87 |
| MOBILE-Net-V2 | 0.96 | 0.61 | 0.81 | 0.88 |
| MOBILE-Net-V2(Focal) | 0.91 | 0.64 | 0.81 | 0.86 |
| NASNetMOBILE | 0.92 | 0.49 | 0.73 | 0.82 |
| NASNetMOBILE(Focal) | 0.95 | 0.52 | 0.75 | 0.84 |
| ResNet50 | 0.84 | 0.57 | 0.76 | 0.80 |
| ResNet50(Focal) | 0.95 | 0.47 | 0.74 | 0.83 |
TABLE V. Comparison of Performance of Discussed Models (Section IV) Using Fivefold Cross Validation for the Pneumonia Class in Terms of Figures of Merit Discussed in Section V.
| Model | Sensitivity | Specificity | Precision | F1-Score |
|---|---|---|---|---|
| COVID-CAPS | 0.45 | 0.92 | 0.69 | 0.55 |
| COVID-CAPS(Focal) | 0.31 | 0.99 | 0.90 | 0.47 |
| COVID-CAPS Scaled | 0.80 | 0.96 | 0.88 | 0.84 |
| COVID-CAPS Scaled (Focal) | 0.56 | 0.99 | 0.95 | 0.73 |
| POCOVID-Net | 0.91 | 0.98 | 0.94 | 0.93 |
| POCOVID-Net(Focal) | 0.94 | 0.96 | 0.90 | 0.92 |
| Mini-COVIDNet | 0.82 | 0.96 | 0.90 | 0.86 |
| Mini-COVIDNet(Focal) | 0.82 | 0.97 | 0.92 | 0.87 |
| MOBILE-Net-V2 | 0.64 | 0.98 | 0.93 | 0.76 |
| MOBILE-Net-V2(Focal) | 0.68 | 0.95 | 0.85 | 0.75 |
| NASNetMOBILE | 0.62 | 0.98 | 0.93 | 0.74 |
| NASNetMOBILE(Focal) | 0.70 | 0.97 | 0.89 | 0.78 |
| ResNet50 | 0.62 | 0.97 | 0.89 | 0.73 |
| ResNet50(Focal) | 0.58 | 0.98 | 0.93 | 0.71 |
TABLE VI. Comparison of Performance of Discussed Models (Section IV) Using Fivefold Cross Validation for the Healthy Class in Terms of Figures of Merit Discussed in Section V.
| Model | Sensitivity | Specificity | Precision | F1-Score |
|---|---|---|---|---|
| COVID-CAPS | 0.06 | 0.94 | 0.20 | 0.10 |
| COVID-CAPS(Focal) | 0.07 | 0.94 | 0.20 | 0.10 |
| COVID-CAPS Scaled | 0.08 | 0.95 | 0.25 | 0.12 |
| COVID-CAPS Scaled (Focal) | 0 | 1 | 0 | – |
| POCOVID-Net | 0.50 | 0.92 | 0.55 | 0.52 |
| POCOVID-Net(Focal) | 0.51 | 0.93 | 0.58 | 0.54 |
| Mini-COVIDNet | 0.41 | 0.95 | 0.60 | 0.49 |
| Mini-COVIDNet(Focal) | 0.51 | 0.96 | 0.70 | 0.59 |
| MOBILE-Net-V2 | 0.40 | 0.93 | 0.52 | 0.45 |
| MOBILE-Net-V2(Focal) | 0.34 | 0.89 | 0.39 | 0.36 |
| NASNetMOBILE | 0.28 | 0.94 | 0.52 | 0.36 |
| NASNetMOBILE(Focal) | 0.20 | 0.98 | 0.65 | 0.32 |
| ResNet50 | 0.34 | 0.84 | 0.31 | 0.32 |
| ResNet50(Focal) | 0.25 | 0.95 | 0.50 | 0.33 |
The proposed model saves 173.75-MB memory for a single model. Since the amount of data used is less and cross validation is performed using five different models. Here, we utilized five different models (five times cross validation) for the classification of the US into the different classes. Hence, the memory saved is
 MB which will be saved if the compressed models based on MOBILE-Net were utilized for deployment. The results are similar to the POCOVID-Net with an added advantage of proposed model providing the same accuracy with very less memory foot print as well as requiring lesser training time (Tables VII and IX). Here, we have trained the data obtained using the linear transducer, but when the transducer or the US machine becomes different, the sample images will have different properties, thus requiring the retraining of the network. Thus, having the training time being less is an advantage for these cases and as shown even on embedded platforms the training time is less than 30 min.
Generally, the medical images such as PET, CT, MRI, or US lack standardization in terms of imaging protocols and vary in terms of quality across different machines at different imaging centers [71]. This is not a problem when routine identification of features was performed in clinical setting by the clinicians. The lung US imaging protocol in the point-of-care setting is often tailored for a site and adds variation even in terms of image feature set. When these images are analyzed numerically for extracting meaningful features or using deep learning models, these imaging features that distinguish different pathologies may not be consistent across sites [71]. Thus, having a model which can be trained in less time for extracting these features is more suitable in these settings. Another area where these models can be utilized is in the continual/lifelong learning scenarios [72]. The ability of a model to learn continuously as well as retain the previously learned knowledge is termed as continual/lifelong learning [73], [74]. This also has the disadvantage of catastrophic forgetting/interference where the model learns on new samples while forgetting the previously learned information and hence a decrease in performance of the model is observed [75], [76]. The proposed model is a lightweight one with the possibility for training in less time, making it ideal for continual/lifelong learning.
The probes required for the acquisition of US images can be linear or curved. A model trained with one type of probe may not be able to perform well with other. Similarly, when the US system characteristics or imaging protocol changes, the model needs to be retrained again. To avoid catastrophic forgetting, the model can be easily trained with the whole data since it can be trained easily in less time. This has not been explored here and will be taken up in future work. Also, the recent emphasis is also on designing of various energy-efficient processors both for training as well as testing of these deep learning models. This work focused on more efficient and accurate models without worrying about the energy consumption of the models, which is also an important factor. Some of the models, deployed here, have high computational requirements, memory requirements, high computing power as they need to be trained on large data sets. The energy consumption of the MobileNet, Inception-3 and DenseNet model are given in [77]. The energy consumption is enormous if we include the model tuning, hyper-parameter optimizations into effect as it involves a lot of trial and error. Energy consumption is also an active area of research and has not been discussed herein much detail, the approaches for faster training will definitely help in less energy consumption and hence being very beneficial for the community [77].
Results specific to COVID-19 class were presented in Table IV. The COVID-CAPS technique gave a higher value of sensitivity, but the specificity, precision, and F1-score were less for the detection of COVID-19 class. POCOVID-Net gave better figures of merit, but at the cost of a large number of parameters and a higher memory requirement. Mini-COVIDNet has improved sensitivity as compared to the POCOVID-Net and requires less parameters and memory size. Similar trend was observed for the Pneumonia class (Table V). The results for the healthy class (Table VI) showed improved performance for the Mini-COVIDNet with focal loss compared to all other models. In [54], the model produces an output matrix of size
 as the model trains the network by minimizing the loss which consists of Soft ORDinal regression (SORD) [78], consistency loss and prior on the parameters of the transformations. Since, any change in the architecture will change the model, thus, we have not performed the comparisons of this model with the proposed one.
The accuracy of the discussed models was given in Table VII. From the results the Mini-COVIDNet with focal loss performance is marginally improved compared to the POCOVID-Net in terms of accuracy, while the accuracy of other models is much lower than these. The corresponding confusion matrix was provided in Fig. 4 for the Mini-COVIDNet with focal loss. From this, it is clear that only two samples of pneumonia class fall into healthy class and only five samples of the healthy class fall into pneumonia class giving high values of specificity for both these classes. The Mini-COVIDNet with focal loss model specificity for pneumonia and healthy class were 0.97 and 0.96, respectively, as seen from Tables V and VI. The focal loss provides an active way of handling the class imbalance. In some cases, the focal loss did not give better performance as compared to the cross entropy loss [79], [80]. Similarly, for the problem at hand in some scenarios, the cross entropy gives better performance. Other techniques such as oversampling or undersampling can be utilized along with focal loss for improving the accuracy, but have not been explored in here. Table VIII shows the ablation study in terms of accuracy across all classes for the cross entropy loss and focal loss for the fivefold cross validation. The focal loss, in general, provided improved accuracy for the proposed model as well as its immediate competitor POCOVID-Net.
Fig. 4.

Confusion Matrix of Mini-COVIDNet with focal loss after the fivefold cross validation for the three classes of lung US images.
TABLE VIII. Ablation Study of Various Classification Models Discussed in Section IV Using Fivefold Cross Validation in Terms of Accuracy Across All Classes.
| Model | Accuracy (Cross Entropy) | Accuracy (Focal Loss) |
|---|---|---|
| COVID-CAPS | 0.686 | 0.657 |
| COVID-CAPS Scaled | 0.759 | 0.734 |
| POCOVID-Net | 0.829 | 0.832 |
| Mini-COVIDNet | 0.811 | 0.832 |
| MOBILE-Net-V2 | 0.793 | 0.763 |
| NASNetMOBILE | 0.744 | 0.771 |
| ResNet50 | 0.704 | 0.748 |
The training time for each of the discussed models is provided in Table VII. It is possible to train a network and again use pruning [81] and quantization [82] to reduce the size of the model. The accuracy obtained using the ResNet50 architecture was less as compared to the other mobile architectures and hence pruning and quantization are not performed further on this architecture. The ResNet50 model had the largest number of trainable parameters and performs poorly on the test data and with focal loss it clearly shows an improvement over the basic ResNet50 model. Since the original COVID-CAPS model has less parameters as compared to the proposed Mini-COVIDNet, we have also implemented a modified COVID-CAPS Scaled model to increase the number of parameters to make it comparable to Mini-COVIDNet.
The rest of the networks training times are in proportion to the number of trainable parameters (except for COVID-CAPS, which takes more training time due to depth convolution) and overall the training time is in the order of tens of minutes for the discussed lightweight networks. To distangle the performance based on the loss used for the training, all models were trained again utilizing the focal loss as a loss function. The results are shown in Tables IV–VII. Except for COVID-CAPS, COVID-CAPS Scaled, and MOBILE-Net-V2, the rest models perform better when the focal loss was utilized for training the models in terms of accuracy as seen in Table VII.
The comparison of various lightweight deep learning models utilized in this work in terms of latency (in seconds), training time on Nvidia Jetson AGX Xavier as well as corresponding required memory (in MB) has been shown in Table IX. The comparison among the different hardware devices used for deploying the different architectures in terms of cost and available memory is shown in Table X. The Raspberry Pi 4 has the minimum cost and is equal to mobile platform in terms of deployment and hence can be easily deployed along with a clinical US scanner in a clinical setting.
The visualization of what the model is actually learning is also very important for the purpose of understanding the model. Here, gradient-weighted class activation mapping (Grad-CAM) [83] was utilized which is class-discriminative for different classes. It highlights the important regions of the image helping in making decision for each of the possible classes. Fig. 5 shows the visualizations obtained utilizing the Grad-CAM model for Covid, pneumonia as well as healthy lung US. As evident, from the figure, the model activates different regions of the input image for different classes for learning the properties and hence classifying using this information. The different regions used for classification are shown and are used inherently in the model. It is also shown that since the activations in the image area are different for different images of the same type of diseased or healthy lung, they can be further improved by utilizing more data sets for the same. The healthy lungs are marked with regular pleural and A-lines [51]. Visualizations given in Fig. 5(a) capture the pleural and A lines, but failed to capture them for all cases. The pleural consolidations are present in the Pneumonia cases as can be seen from Fig. 5(b), similar to what is reported in [47] and [51]. Recent works [47], [51]–[53] confirm that the characteristics of the lung US with COVID-19 infection include irregular pleural lines with vertical artifacts. Fig. 5(c) shows the lungs infected with COVID-19 and it is clear that the proposed networks are targeting the region near the pleural lines in classifying them into COVID-19 class. This analysis also asserts that the model developed here can rapidly recognize those patients who have significant lung changes (for example, the peripheral distribution of GGOs) manifesting as B-lines, allowing better triaging of COVID-19 patients.
Fig. 5.

Example lung US images after the visualization using the Grad-CAM utilized in this work representing classes (rowwise) of (a) healthy lung, (b) pneumonia infected lung, and (c) lung infected with COVID-19 exhibiting pleural irregularities and small subpleural consolidation.
It is also important to note that the lung US may not be capable to detect deep lesions within the lung and may not have discerning ability for the diagnosis of COVID19. The current method is sensitive to the damage to the pleural surface of the lung, which has been proven to have prognostic value, commonly observed in intensive care unit–admitted and deceased patients [84]. The results from the developed model have to be interpreted in the clinical and epidemiological context of the patient. The developed model will have better utility in the context of a massive COVID-19 pandemic, where it can better triage patients with pulmonary symptoms (suspected of infection).
The human/expert classification accuracy of lung US images for the COVID-19 has been only about 0.67 [54]. The results presented in this work (especially in Table VII) indicate that these lightweight models have larger utility due to less number of parameters and less size in memory and can easily perform on par or better than an expert. Even training times being in the order of tens of minutes, makes them highly attractive for a clinical setting. As these deep learning models are lightweight, the run times are in the order of seconds (even in mobile platforms) and can be easily executed to give the first line of detection of COVID-19 as a rapid point-of-care test using lung US images.
The final predictions currently come from a single frame of the video. Since there are five different models trained, every test image frame will be able to give us five values of prediction probabilities. These prediction probabilities can be combined differently to get a single value which will decide the class of the frame. There are mainly two basic methods of combining these.
-
1)
Majority Voting: Selecting the classification output on the basis of highest probability among the five models [85].
-
2)
Averaging: Selecting the classification output by averaging the output probabilities from the five models [86].
In this work, we have only performed the averaging for overall accuracy. The other advanced methods will be explored in future for improving overall accuracy.
As lung US imaging protocols vary significantly across imaging centers [87], developing a universally applicable model will be a challenge across all imaging conditions. The work presented in here specifically provides a solution to this challenge with the utilization of these lightweight CNNs requiring very less training time (Table VII) without compromising the accuracy of the detection, making them attractive as well as easy to deploy in the point-of-care setting, where US was aimed. These types of methods are essential for making deep learning methods more appealing for point-of-care COVID-19 detection studies. The developed lightweight models were made available as an open-source for enthusiastic users at https://github.com/navchetan-awasthi/Mini-COVIDNet.
VIII. Conclusion
US imaging has been known to be an effective point-of-care test for diagnosis of pneumonia and is proven to be as competent as CXR. This work showed that lung US imaging can be utilized as a point-of-care test for COVID-19 with the deployment of lightweight deep neural networks. This work utilized deep learning models that can easily run on mobile platforms for end-to-end detection of COVID-19 using lung US images, truly making it a point-of-care test. As US is comparatively less infection-prone (easy to disinfect), the bed-side detection based on the developed models has been shown to be a reality. The presented lightweight networks, including Mini-COVIDNet, have trainable parameters in the order 2–3 million and can be trained in less than thirty minutes to provide an effective detection models, whose performance is on par with a human expert (>68%). The other advantage of Mini-COVIDNet is that the total number of parameters is 4.39 times lower compared to its counterpart, making it highly versatile to deploy in mobile platforms and is also shown to provide a highest accuracy of 83.2% in the detection of COVID-19. The deployment results on the embedded platforms like Raspberry Pi and Nvidia Jetson makes the proposed Mini-COVIDNet very attractive to be utilized in point of care setting allowing better triaging of COVID-19 patients.
Acknowledgment
The authors are thankful to Dr. Jannis Born and other research group members for providing lung US imaging data as an open source, which made this work possible.
Biographies

Navchetan Awasthi (Member, IEEE) received the B.Tech. degree in electronics and communication engineering from the National Institute of Technology (NIT), Jalandhar, India, in 2011, and the M.Tech. degree in computational science and Ph.D. degree in medical imaging from the Indian Institute of Science (IISc), Bengaluru, India, in 2016 and 2019, respectively.
He is currently a Research Fellow with the Massachusetts General Hospital, Boston, MA, USA, and Harvard University, Cambridge, MA, USA. His research interests include inverse problems in biomedical optics, medical image analysis, medical image reconstruction, biomedical signal processing, and deep learning.

Aveen Dayal received the bachelor’s degree in computer science and engineering from BML Munjal University, Gurgaon, India, in 2020.
He is currently a Visiting Research Student with the Department of Information and Communication Technology, University of Agder, Grimstad, Norway. His main research interests are in machine learning and deep learning for autonomous cyberphysical systems.

Linga Reddy Cenkeramaddi (Senior Member, IEEE) received the master’s degree in electrical engineering from IIT Delhi, New Delhi, India, in 2004, and the Ph.D. degree in electrical engineering from the Norwegian University of Science and Technology (NTNU), Trondheim, Norway, in 2011.
He worked for Texas Instruments, Bengaluru, India, in mixed-signal circuit design before joining the Ph.D. program at NTNU. After finishing his Ph.D. degree, he worked in radiation imaging for an atmosphere space interaction monitor (ASIM mission to International Space Station) at the University of Bergen, Bergen, Norway, from 2010 to 2012. He is currently an Associate Professor with the University of Agder, Grimstad, Norway. His main scientific interests are in cyberphysical systems, autonomous systems, and wireless embedded systems.

Phaneendra K. Yalavarthy (Senior Member, IEEE) received the M.Sc. degree in engineering from the Indian Institute of Science, Bengaluru, India, in 2004, and the Ph.D. degree in biomedical computation from the Dartmouth College, Hanover, NH, USA, in 2007.
He is an Associate Professor with the Department of Computational and Data Sciences, Indian Institute of Science. His research interests include medical image computing, medical image analysis, and biomedical optics.
Dr. Yalavarthy is a Senior Member of the SPIE and the OSA. He serves as an Associate Editor for the IEEE Transactions on Medical Imaging.
Funding Statement
This work was supported in part by the WIPRO-GE Collaborative Laboratory on Artificial Intelligence in Healthcare and Medical Imaging and Indo-Norwegian collaboration in Autonomous Cyber-Physical Systems (INCAPS) Project: 287918 of International Partnerships for Excellent Education, Research and Innovation (INTPART) Program from the Research Council of Norway.
Contributor Information
Navchetan Awasthi, Email: navchetanawasthi@gmail.com.
Linga Reddy Cenkeramaddi, Email: linga.cenkeramaddi@uia.no.
Phaneendra K. Yalavarthy, Email: yalavarthy@iisc.ac.in.
References
- [1].Memish Z. A., Perlman S., Van Kerkhove M. D., and Zumla A., “Middle east respiratory syndrome,” Lancet, vol. 395, pp. 1063–1077, Sep. 2020. [DOI] [PMC free article] [PubMed] [Google Scholar]
- [2].Lai C.-C., Shih T.-P., Ko W.-C., Tang H.-J., and Hsueh P.-R., “Severe acute respiratory syndrome coronavirus 2 (SARS-CoV-2) and corona virus disease-2019 (COVID-19): The epidemic and the challenges,” Int. J. Antimicrobial Agents, vol. 55, no. 3, 2020, Art. no. 105924. [DOI] [PMC free article] [PubMed] [Google Scholar]
- [3].Chen N.et al. , “Epidemiological and clinical characteristics of 99 cases of 2019 novel coronavirus pneumonia in Wuhan, China: A descriptive study,” Lancet, vol. 395, no. 10223, pp. 507–513, Feb. 2020. [DOI] [PMC free article] [PubMed] [Google Scholar]
- [4].Rubin G. D.et al. , “The role of chest imaging in patient management during the COVID-19 pandemic: A multinational consensus statement from the Fleischner society,” Radiology, vol. 296, no. 1, pp. 172–180, Jul. 2020. [DOI] [PMC free article] [PubMed] [Google Scholar]
- [5].Kanne J. P., Little B. P., Chung J. H., Elicker B. M., and Ketai L. H., “Essentials for radiologists on COVID-19: An update—Radiology scientific expert panel,” Radiology, vol. 296, no. 2, pp. E113–E114, Aug. 2020, doi: 10.1148/radiol.2020200527. [DOI] [PMC free article] [PubMed] [Google Scholar]
- [6].Fang Y.et al. , “Sensitivity of chest CT for COVID-19: Comparison to RT-PCR,” Radiology, vol. 296, no. 2, 2020, Art. no. 200432. [DOI] [PMC free article] [PubMed] [Google Scholar]
- [7].Ai T.et al. , “Correlation of chest CT and RT-PCR testing in coronavirus disease 2019 (COVID-19) in China: A report of 1014 cases,” Radiology, vol. 296, no. 2, 2020, Art. no. 200642. [DOI] [PMC free article] [PubMed] [Google Scholar]
- [8].Mossa-Basha M., Meltzer C. C., Kim D. C., Tuite M. J., Kolli K. P., and Tan B. S., “Radiology department preparedness for COVID-19: Radiology scientific expert panel,” Radiology, vol. 16, 2020, Art. no.200988, doi: 10.1148/radiol.2020200988. [DOI] [PMC free article] [PubMed] [Google Scholar]
- [9].Paluru N.et al. , “Anam-Net: Anamorphic depth embedding-based lightweight CNN for segmentation of anomalies in COVID-19 chest CT images,” IEEE Trans. Neural Netw. Learn. Syst., vol. 32, no. 3, pp. 932–946, Mar. 2021. [DOI] [PMC free article] [PubMed] [Google Scholar]
- [10].Gehmacher O., Mathis G., Kopf A., and Scheier M., “Ultrasound imaging of pneumonia,” Ultrasound Med. Biol., vol. 21, no. 9, pp. 1119–1122, Jan. 1995. [DOI] [PubMed] [Google Scholar]
- [11].Orso D., Guglielmo N., and Copetti R., “Lung ultrasound in diagnosing pneumonia in the emergency department: A systematic review and meta-analysis,” Eur. J. Emergency Med., vol. 25, no. 5, pp. 312–321, Oct. 2018. [DOI] [PubMed] [Google Scholar]
- [12].Chavez M. A.et al. , “Lung ultrasound for the diagnosis of pneumonia in adults: A systematic review and meta-analysis,” Respiratory Res., vol. 15, no. 1, p. 50, 2014. [DOI] [PMC free article] [PubMed] [Google Scholar]
- [13].Volpicelli G.et al. , “International evidence-based recommendations for point-of-care lung ultrasound,” Intensive Care Med., vol. 38, no. 4, pp. 577–591, Apr. 2012. [DOI] [PubMed] [Google Scholar]
- [14].Bouhemad B., Zhang M., Lu Q., and Rouby J.-J., “Clinical review: Bedside lung ultrasound in critical care practice,” Crit. Care, vol. 11, no. 1, p. 205, Feb. 2007. [DOI] [PMC free article] [PubMed] [Google Scholar]
- [15].Smallwood N. and Dachsel M., “Point-of-care ultrasound (POCUS): Unnecessary gadgetry or evidence-based medicine?,” Clin. Med., vol. 18, no. 3, p. 219, 2018. [DOI] [PMC free article] [PubMed] [Google Scholar]
- [16].Zou T., Yin W., and Kang Y., “Application of critical care ultrasound in patients with COVID-19: Our experience and perspective,” IEEE Trans. Ultrason., Ferroelectr., Freq. Control, vol. 67, no. 11, pp. 2197–2206, Nov. 2020. [DOI] [PMC free article] [PubMed] [Google Scholar]
- [17].Qian X., Wodnicki R., Kang H., Zhang J., Tchelepi H., and Zhou Q., “Current ultrasound technologies and instrumentation in the assessment and monitoring of COVID-19 positive patients,” IEEE Trans. Ultrason., Ferroelectr., Freq. Control, vol. 67, no. 11, pp. 2230–2240, Nov. 2020. [DOI] [PMC free article] [PubMed] [Google Scholar]
- [18].Brenner D. S., Liu G. Y., Omron R., Tang O., Garibaldi B. T., and Fong T. C., “Diagnostic accuracy of lung ultrasound for SARS-CoV-2: A retrospective cohort study,” Ultrasound J., vol. 13, no. 1, pp. 1–11, Dec. 2021. [DOI] [PMC free article] [PubMed] [Google Scholar]
- [19].Dudea S. M., “Ultrasonography and SARS-CoV 2 infection: A review of what we know and do not yet know,” Med. Ultrasonogr., vol. 22, no. 2, pp. 129–132, 2020. [DOI] [PubMed] [Google Scholar]
- [20].Weinstock M. B., Echenique A., Dabr J. W. R., Leib A., and Illuzzi F. A., “Chest X-ray findings in 636 ambulatory patients with COVID-19 presenting to an urgent care center: A normal chest X-ray is no guarantee,” J. Urgent Care Med., vol. 14, no. 7, pp. 13–18, 2020. [Google Scholar]
- [21].Wong H. Y. F.et al. , “Frequency and distribution of chest radiographic findings in COVID-19 positive patients,” Radiology, vol. 296, no. 2, 2020, Art. no. 201160. [DOI] [PMC free article] [PubMed] [Google Scholar]
- [22].Hall L. O., Paul R., Goldgof D. B., and Goldgof G. M., “Finding COVID-19 from chest X-rays using deep learning on a small dataset,” 2020, arXiv:2004.02060. [Online]. Available: http://arxiv.org/abs/2004.02060
- [23].Bourcier J.-E.et al. , “Performance comparison of lung ultrasound and chest X-ray for the diagnosis of pneumonia in the ED,” Amer. J. Emergency Med., vol. 32, no. 2, pp. 115–118, 2014. [DOI] [PubMed] [Google Scholar]
- [24].Bourcier J.-E., Braga S., and Garnier D., “Lung ultrasound will soon replace chest radiography in the diagnosis of acute community-acquired pneumonia,” Current Infectious Disease Rep., vol. 18, no. 12, p. 43, Dec. 2016. [DOI] [PubMed] [Google Scholar]
- [25].Reali F.et al. , “Can lung ultrasound replace chest radiography for the diagnosis of pneumonia in hospitalized children?,” Respiration, vol. 88, no. 2, pp. 112–115, 2014. [DOI] [PubMed] [Google Scholar]
- [26].Claes A.-S., Clapuyt P., Menten R., Michoux N., and Dumitriu D., “Performance of chest ultrasound in pediatric pneumonia,” Eur. J. Radiol., vol. 88, pp. 82–87, Mar. 2017. [DOI] [PubMed] [Google Scholar]
- [27].Ticinesi A.et al. , “Lung ultrasound and chest X-ray for detecting pneumonia in an acute geriatric ward,” Medicine, vol. 95, no. 27, p. e4153, 2016. [DOI] [PMC free article] [PubMed] [Google Scholar]
- [28].Bao C., Liu X., Zhang H., Li Y., and Liu J., “Coronavirus disease 2019 (COVID-19) CT findings: A systematic review and meta-analysis,” J. Amer. College Radiol., vol. 17, no. 6, pp. 701–709, Jun. 2020. [DOI] [PMC free article] [PubMed] [Google Scholar]
- [29].Lee E. Y. P., Ng M.-Y., and Khong P.-L., “COVID-19 pneumonia: What has CT taught us?,” Lancet Infectious Diseases, vol. 20, no. 4, pp. 384–385, Apr. 2020. [DOI] [PMC free article] [PubMed] [Google Scholar]
- [30].Salehi S., Abedi A., Balakrishnan S., and Gholamrezanezhad A., “Coronavirus disease 2019 (COVID-19): A systematic review of imaging findings in 919 patients,” Amer. J. Roentgenol., vol. 215, no. 1, pp. 1–7, 2020. [DOI] [PubMed] [Google Scholar]
- [31].Pan F.et al. , “Time course of lung changes on chest CT during recovery from 2019 novel coronavirus (COVID-19) pneumonia,” Radiology, vol. 295, no. 3, 2020, Art. no. 200370. [DOI] [PMC free article] [PubMed] [Google Scholar]
- [32].Kanne J. P., “Chest CT findings in 2019 novel coronavirus (2019-nCoV) infections from Wuhan, China: Key points for the radiologist,” Radiology, vol. 295, no. 1, pp. 16–17, Apr. 2020. [DOI] [PMC free article] [PubMed] [Google Scholar]
- [33].Kang H.et al. , “Diagnosis of coronavirus disease 2019 (COVID-19) with structured latent multi-view representation learning,” IEEE Trans. Med. Imag., vol. 39, no. 8, pp. 2606–2614, Aug. 2020. [DOI] [PubMed] [Google Scholar]
- [34].Li L.et al. , “Artificial intelligence distinguishes COVID-19 from community acquired pneumonia on chest CT,” Radiology, vol. 296, no. 2, pp. E65–E71, 2020, doi: 10.1148/radiol.2020200905. [DOI] [PMC free article] [PubMed] [Google Scholar]
- [35].He K., Zhang X., Ren S., and Sun J., “Deep residual learning for image recognition,” in Proc. IEEE Conf. Comput. Vis. Pattern Recognit. (CVPR), Jun. 2016, pp. 770–778. [Google Scholar]
- [36].Bai X.et al. , “Predicting COVID-19 malignant progression with AI techniques,” medRxiv, Mar. 2020, Art. no. 20037325.
- [37].Chowdhury M. E. H.et al. , “Can AI help in screening viral and COVID-19 pneumonia?,” 2020, arXiv:2003.13145. [Online]. Available: http://arxiv.org/abs/2003.13145
- [38].Butt C., Gill J., Chun D., and Babu B. A., “Deep learning system to screen coronavirus disease 2019 pneumonia,” Appl. Intell., pp. 1–7, Apr. 2020, doi: 10.1007/s10489-020-01714-3. [DOI] [PMC free article] [PubMed]
- [39].Jacobi A., Chung M., Bernheim A., and Eber C., “Portable chest X-ray in coronavirus disease-19 (COVID-19): A pictorial review,” Clin. Imag., vol. 64, pp. 35–42, Aug. 2020. [DOI] [PMC free article] [PubMed] [Google Scholar]
- [40].Fiala M. J., “Ultrasound in COVID-19: A timeline of ultrasound findings in relation to CT,” Clin. Radiol., vol. 75, no. 7, pp. 553–554, Jul. 2020. [DOI] [PMC free article] [PubMed] [Google Scholar]
- [41].Huang Y.et al. , “A preliminary study on the ultrasonic manifestations of peripulmonary lesions of non-critical novel coronavirus pneumonia (COVID-19),” SSRN, 2020, Art. no.3544750, doi: 10.2139/ssrn.3544750. [DOI]
- [42].Poggiali E.et al. , “Can lung us help critical care clinicians in the early diagnosis of novel coronavirus (COVID-19) pneumonia?,” Radiology, vol. 295, no. 3, 2020, Art. no. 200847. [DOI] [PMC free article] [PubMed] [Google Scholar]
- [43].Peng Q.-Y., Wang X.-T., and Zhang L.-N., “Findings of lung ultrasonography of novel corona virus pneumonia during the 2019–2020 epidemic,” Intensive Care Med., vol. 46, no. 5, pp. 849–850, May 2020. [DOI] [PMC free article] [PubMed] [Google Scholar]
- [44].Demi M., Prediletto R., Soldati G., and Demi L., “Physical mechanisms providing clinical information from ultrasound lung images: Hypotheses and early confirmations,” IEEE Trans. Ultrason., Ferroelectr., Freq. Control, vol. 67, no. 3, pp. 612–623, Oct. 2019. [DOI] [PubMed] [Google Scholar]
- [45].Soldati G., Demi M., Smargiassi A., Inchingolo R., and Demi L., “The role of ultrasound lung artifacts in the diagnosis of respiratory diseases,” Expert Rev. Respiratory Med., vol. 13, no. 2, pp. 163–172, Feb. 2019. [DOI] [PubMed] [Google Scholar]
- [46].Soldati G.et al. , “Is there a role for lung ultrasound during the COVID-19 pandemic?,” J. Ultrasound Med., vol. 39, no. 7, pp. 1459–1462, Jul. 2020, doi: 10.1002/jum.15284. [DOI] [PMC free article] [PubMed] [Google Scholar]
- [47].Boccatonda A.et al. , “Can lung ultrasound be used to screen for pulmonary embolism in patients with SARS-CoV-2 pneumonia?,” Eur. J. Case Rep. Internal Med., vol. 7, no. 7, 2020. [DOI] [PMC free article] [PubMed] [Google Scholar]
- [48].Born J.et al. , “POCOVID-Net: Automatic detection of COVID-19 from a new lung ultrasound imaging dataset (POCUS),” 2020, arXiv:2004.12084. [Online]. Available: http://arxiv.org/abs/2004.12084
- [49].Nguyen T. T., “Artificial intelligence in the battle against coronavirus (COVID-19): A survey and future research directions,” 2020, arXiv:2008.07343. [Online]. Available: https://arxiv.org/abs/2008.07343
- [50].Horry M. J.et al. , “COVID-19 detection through transfer learning using multimodal imaging data,” IEEE Access, vol. 8, pp. 149808–149824, 2020. [DOI] [PMC free article] [PubMed] [Google Scholar]
- [51].Pata D., Valentini P., De Rose C., De Santis R., Morello R., and Buonsenso D., “Chest computed tomography and lung ultrasound findings in COVID-19 pneumonia: A pocket review for non-radiologists,” Frontiers Med., vol. 7, p. 375, Jun. 2020. [DOI] [PMC free article] [PubMed] [Google Scholar]
- [52].Carrer L.et al. , “Automatic pleural line extraction and COVID-19 scoring from lung ultrasound data,” IEEE Trans. Ultrason., Ferroelectr., Freq. Control, vol. 67, no. 11, pp. 2207–2217, Nov. 2020. [DOI] [PMC free article] [PubMed] [Google Scholar]
- [53].Baloescu C.et al. , “Automated lung ultrasound B-line assessment using a deep learning algorithm,” IEEE Trans. Ultrason., Ferroelectr., Freq. Control, vol. 67, no. 11, pp. 2312–2320, Nov. 2020. [DOI] [PubMed] [Google Scholar]
- [54].Roy S.et al. , “Deep learning for classification and localization of COVID-19 markers in point-of-care lung ultrasound,” IEEE Trans. Med. Imag., vol. 39, no. 8, pp. 2676–2687, Aug. 2020. [DOI] [PubMed] [Google Scholar]
- [55].Zheng X., Kulhare S., Mehanian C., Chen Z., and Wilson B., “Feature detection and pneumonia diagnosis based on clinical lung ultrasound imagery using deep learning,” J. Acoust. Soc. Amer., vol. 144, no. 3, p. 1668, 2018, doi: 10.1121/1.5067436. [DOI] [Google Scholar]
- [56].DeGroot M. H., Optimal Statistical Decisions, vol. 82. Hoboken, NJ, USA: Wiley, 2005. [Google Scholar]
- [57].Afshar P., Heidarian S., Naderkhani F., Oikonomou A., Plataniotis K. N., and Mohammadi A., “COVID-CAPS: A capsule network-based framework for identification of COVID-19 cases from X-ray images,” 2020, arXiv:2004.02696. [Online]. Available: http://arxiv.org/abs/2004.02696 [DOI] [PMC free article] [PubMed]
- [58].Kingma D. P. and Ba J., “Adam: A method for stochastic optimization,” 2014, arXiv:1412.6980. [Online]. Available: http://arxiv.org/abs/1412.6980
- [59].Simonyan K. and Zisserman A., “Very deep convolutional networks for large-scale image recognition,” 2014, arXiv:1409.1556. [Online]. Available: http://arxiv.org/abs/1409.1556
- [60].Srivastava N., Hinton G., Krizhevsky A., Sutskever I., and Salakhutdinov R., “Dropout: A simple way to prevent neural networks from overfitting,” J. Mach. Learn. Res., vol. 15, no. 1, pp. 1929–1958, 2014. [Google Scholar]
- [61].Ioffe S. and Szegedy C., “Batch normalization: Accelerating deep network training by reducing internal covariate shift,” 2015, arXiv:1502.03167. [Online]. Available: http://arxiv.org/abs/1502.03167
- [62].Howard A. G.et al. , “MobileNets: Efficient convolutional neural networks for mobile vision applications,” 2017, arXiv:1704.04861. [Online]. Available: http://arxiv.org/abs/1704.04861
- [63].Sandler M., Howard A., Zhu M., Zhmoginov A., and Chen L.-C., “MobileNetV2: Inverted residuals and linear bottlenecks,” in Proc. IEEE/CVF Conf. Comput. Vis. Pattern Recognit., Jun. 2018, pp. 4510–4520. [Google Scholar]
- [64].Zoph B., Vasudevan V., Shlens J., and Le Q. V., “Learning transferable architectures for scalable image recognition,” in Proc. IEEE/CVF Conf. Comput. Vis. Pattern Recognit., Jun. 2018, pp. 8697–8710. [Google Scholar]
- [65].Busson A. J. G., Colcher S., Milidiú R. L., Dias B. P., and Bulcão A., “Seismic shot gather noise localization using a multi-scale feature-fusion-based neural network,” 2020, arXiv:2005.03626. [Online]. Available: http://arxiv.org/abs/2005.03626
- [66].Yun P., Tai L., Wang Y., Liu C., and Liu M., “Focal loss in 3D object detection,” IEEE Robot. Autom. Lett., vol. 4, no. 2, pp. 1263–1270, Jan. 2019. [Google Scholar]
- [67].Lin T.-Y., Goyal P., Girshick R., He K., and Dollár P., “Focal loss for dense object detection,” in Proc. IEEE Int. Conf. Comput. Vis. (ICCV), Oct. 2017, pp. 2980–2988. [DOI] [PubMed] [Google Scholar]
- [68].Altman D. G. and Bland J. M., “Diagnostic tests. 1: Sensitivity and specificity,” Brit. Med. J., vol. 308, p. 1552, Jun. 1994. [DOI] [PMC free article] [PubMed] [Google Scholar]
- [69].Buckland M. and Gey F., “The relationship between recall and precision,” J. Amer. Soc. Inf. Sci., vol. 45, no. 1, pp. 12–19, Jan. 1994. [Google Scholar]
- [70].Blair D. C., “Information retrieval,” J. Amer. Soc. Inf. Sci., vol. 30, no. 6, pp. 374–375, 1979. [Google Scholar]
- [71].Gillies R. J., Kinahan P. E., and Hricak H., “Radiomics: Images are more than pictures, they are data,” Radiology, vol. 278, no. 2, pp. 563–577, Feb. 2016. [DOI] [PMC free article] [PubMed] [Google Scholar]
- [72].Parisi G. I., Kemker R., Part J. L., Kanan C., and Wermter S., “Continual lifelong learning with neural networks: A review,” Neural Netw., vol. 113, pp. 54–71, May 2019. [DOI] [PubMed] [Google Scholar]
- [73].Hassabis D., Kumaran D., Summerfield C., and Botvinick M., “Neuroscience-inspired artificial intelligence,” Neuron, vol. 95, no. 2, pp. 245–258, Jul. 2017. [DOI] [PubMed] [Google Scholar]
- [74].Thrun S. and Mitchell T. M., “Lifelong robot learning,” Robot. Auton. Syst., vol. 15, nos. 1–2, pp. 25–46, Jul. 1995. [Google Scholar]
- [75].McCloskey M. and Cohen N. J., “Catastrophic interference in connectionist networks: The sequential learning problem,” Psychol. Learn. Motivat., vol. 24, pp. 109–165, Dec. 1989. [Google Scholar]
- [76].McClelland J. L., McNaughton B. L., and O’Reilly R. C., “Why there are complementary learning systems in the hippocampus and neocortex: Insights from the successes and failures of connectionist models of learning and memory,” Psychol. Rev., vol. 102, no. 3, p. 419, 1995. [DOI] [PubMed] [Google Scholar]
- [77].García-Martín E., Rodrigues C. F., Riley G., and Grahn H., “Estimation of energy consumption in machine learning,” J. Parallel Distrib. Comput., vol. 134, pp. 75–88, Dec. 2019. [Google Scholar]
- [78].Diaz R. and Marathe A., “Soft labels for ordinal regression,” in Proc. IEEE/CVF Conf. Comput. Vis. Pattern Recognit. (CVPR), Jun. 2019, pp. 4738–4747. [Google Scholar]
- [79].Pasupa K., Vatathanavaro S., and Tungjitnob S., “Convolutional neural networks based focal loss for class imbalance problem: A case study of canine red blood cells morphology classification,” J. Ambient Intell. Humanized Comput., pp. 1–17, 2020.
- [80].Baloch B. K., Kumar S., Haresh S., Rehman A., and Syed T., “Focused anchors loss: Cost-sensitive learning of discriminative features for imbalanced classification,” in Proc. Asian Conf. Mach. Learn., 2019, pp. 822–835. [Google Scholar]
- [81].Reed R., “Pruning algorithms—A survey,” IEEE Trans. Neural Netw., vol. 4, no. 5, pp. 740–747, Sep. 1993. [DOI] [PubMed] [Google Scholar]
- [82].Han S., Mao H., and Dally W. J., “Deep compression: Compressing deep neural networks with pruning, trained quantization and Huffman coding,” 2015, arXiv:1510.00149. [Online]. Available: http://arxiv.org/abs/1510.00149
- [83].Selvaraju R. R., Cogswell M., Das A., Vedantam R., Parikh D., and Batra D., “Grad-CAM: Visual explanations from deep networks via gradient-based localization,” in Proc. IEEE Int. Conf. Comput. Vis. (ICCV), Oct. 2017, pp. 618–626. [Google Scholar]
- [84].Tabatabaei S. M. H., Talari H., Moghaddas F., and Rajebi H., “CT features and short-term prognosis of COVID-19 pneumonia: A single-center study from Kashan, Iran,” Radiol., Cardiothoracic Imag., vol. 2, no. 2, Apr. 2020, Art. no. e200130, doi: 10.1148/ryct.2020200130. [DOI] [PMC free article] [PubMed] [Google Scholar]
- [85].Ruta D. and Gabrys B., “Classifier selection for majority voting,” Inf. Fusion, vol. 6, no. 1, pp. 63–81, Mar. 2005. [Google Scholar]
- [86].Brewster L. R.et al. , “Development and application of a machine learning algorithm for classification of elasmobranch behaviour from accelerometry data,” Mar. Biol., vol. 165, no. 4, p. 62, Apr. 2018. [DOI] [PMC free article] [PubMed] [Google Scholar]
- [87].Patel C. J., Bhatt H. B., Parikh S. N., Jhaveri B. N., and Puranik J. H., “Bedside lung ultrasound in emergency protocol as a diagnostic tool in patients of acute respiratory distress presenting to emergency department,” J. Emergencies, Trauma, Shock, vol. 11, no. 2, p. 125, 2018. [DOI] [PMC free article] [PubMed] [Google Scholar]