Abstract
In this article, we present a novel method for line artifacts quantification in lung ultrasound (LUS) images of COVID-19 patients. We formulate this as a nonconvex regularization problem involving a sparsity-enforcing, Cauchy-based penalty function, and the inverse Radon transform. We employ a simple local maxima detection technique in the Radon transform domain, associated with known clinical definitions of line artifacts. Despite being nonconvex, the proposed technique is guaranteed to convergence through our proposed Cauchy proximal splitting (CPS) method, and accurately identifies both horizontal and vertical line artifacts in LUS images. To reduce the number of false and missed detection, our method includes a two-stage validation mechanism, which is performed in both Radon and image domains. We evaluate the performance of the proposed method in comparison to the current state-of-the-art B-line identification method, and show a considerable performance gain with 87% correctly detected B-lines in LUS images of nine COVID-19 patients.
Keywords: Cauchy-based penalty, COVID-19, line artifacts, lung ultrasound (LUS), Radon transform
I. Introduction
The outbreak of SARS-CoV-2 at the end of 2019 has rapidly spread to multiple countries on all continents, within the span of just few months. As of the beginning of August 2020, there have been more than 18 million confirmed cases globally with a death toll of more than 700 thousands people, and these numbers are continuously growing. Current approaches to diagnose COVID-19 are based on real-time reverse-transcriptase polymerase chain reaction, which became the gold standard for confirming the infection. However, the sensitivity of this approach is low, and it is mainly useful at the inception of COVID-19.
Some medical imaging modalities, including computed tomography (CT) and X-ray, play a major role in confirming positive COVID-19 patients, but use ionizing radiation and require patient movement. On the other hand, medical ultrasound is a technology that has advanced tremendously in recent years and is increasingly used for lung problems that previously needed large X-ray or CT scanners. Indeed, lung ultrasound (LUS) can help in assessing the fluid status of patients in intensive care as well as in deciding management strategies for a range of conditions, including COVID-19 patients.
LUS can be conducted rapidly and repeatedly at the bedside to help assess COVID-19 patients in intensive care units (ICUs), and in emergency settings [1]–[3]. LUS provides real-time assessment of lung status and its dynamic interactions, which are disrupted in pathological states. In the right clinical context, LUS information can contribute to therapeutic decisions based on more accurate and reproducible data. Additional benefits include a reduced need for CT scans and therefore shorter delays, lower irradiation levels and cost, and above all, improved patient management and prognosis due to innovative LUS quantitative and integrative analytical methods.
The common feature in all clinical conditions, both local to the lungs (e.g., pneumonia) and those manifesting themselves in the lungs (e.g., kidney disease [4]), is the presence in LUS of a variety of line artifacts. These include so-called A-, B-, and Z-lines, whose detection and quantification is of extremely significant clinical relevance. Bilateral B-lines are commonly present in lung with interstitial edema. Subpleural septal edema is postulated to provide a bubble-tetrahedron interface, generating a series of very closed spaced reverberations at a distance below the resolution of ultrasound which is interpreted as a confluent vertical echo which does not fade with increasing depth [4]–[6]. The presence or absence of B-lines in thoracic ultrasonography, as well as their type and quantity, can be used as a marker of COVID-19 disease [1], [7]–[10]. As reported in [7] and [9], a thick and irregularly shaped (broken) pleural line, and the existence of focal, multifocal, and/or confluent vertical B-lines are important indicators of the stage of COVID-19, while A-lines become visible predominantly during the recovery phase.
A clinical limitation when using LUS is that quantification of line artifacts relies on visual estimation and thus may not accurately reflect generalized fluid overload or the severity of conditions such as interstitial lung disease or severe pneumonia. Moreover, currently the technique is operator-dependent and requires specialist training. Therefore, reliable image-processing techniques that improve the visibility of lines and facilitate line detection in speckle images are essential. However, only a few automatic approaches have been reported in the literature [4], [11]–[14]. The method in [11] employs angular features and thresholding (AFT). A B-line is detected in a particular image column if each feature exceeds a predefined threshold. The method in [12] uses alternate sequential filtering (ASF). A repeated sequential morphological opening and closing approach is applied to the mask until potential B-lines are separated. In [4], an inverse problem-based method has been proposed for line detection in ultrasound images, referred to as the pulmonary ultrasound image (PUI) analysis method hereafter. It involves
 -norm regularization, which promotes sparsity via small norm orders
 , and is shown to be suitable for the detection of B-lines, as well as of other line artifacts, including Z-lines and A-lines. More recently, deep learning approaches have also been employed to detect and localize line artifacts in LUS [15], [16]. The method in [15] in particular is able to detect in real-time the presence of B-lines and requires only a small amount of annotated training images.
In this article, we present a new LUS image analysis system based on a sophisticated nonconvex regularization method for automatic quantification of line artifacts, and validate it on the novel coronavirus (SARS-CoV-2)-induced pneumonia. The proposed nonconvex regularization scheme, which we prefer to call Cauchy proximal splitting (CPS) can be guaranteed to converge following [17], whilst benefiting from the advantages offered by a nonconvex penalty function. Furthermore, following reconstruction via CPS, a novel automatic line artifacts quantification procedure is proposed, which offers an unsupervised framework for the detection of horizontal (pleural, and either subpleural or A-lines), and vertical (B-lines) line artifacts in LUS measurements of several COVID-19 patients. The performance of the proposed algorithm is compared to the state-of-the-art B-line detection method, PUI [4]. We show B-line detection performance of 87% with a gain of around 8% over PUI [4].
The remainder of this article is organized as follows: the clinical relationship between LUS line artifacts and COVID-19 disease is presented in Section II. The CPS algorithm and the proposed line artifact detection method are presented in detail in Sections III and IV, respectively. Section V presents the LUS data sets of COVID-19 patients, while experimental results and discussions are presented in Section VI. Section VII concludes this article with remarks and future work directions.
II. Line Artifacts and COVID-19
A. Line Artifacts in LUS
LUS, is a noninvasive, easy-to-perform, radiation-free, fast, cheap, and highly reliable technique, which is currently employed for objective monitoring of pulmonary congestion [18]. The technique requires ultrasound scanning of the anterior right and left chest, from the second to the fifth intercostal space, in multiple intercostal spaces [19]. The soft tissues of the chest wall and the aerated lung are separated by a pleural line, which is thin, hyperechoic, and curvilinear.
Due to the presence in the lung of transudates, the air content decreases and the lung density increases. When this happens, the acoustic difference between the lung and the surrounding tissues is reduced, and the ultrasound beam is reflected multiple times at higher depths. This phenomenon creates discrete vertical hyperechoic reverberation artifacts (B-lines), that arise from the pleural line [20]. The presence of a few scattered B-lines can be normal, and is sometimes encountered in healthy subjects, especially in the lower intercostal spaces. Multiple B-lines are considered sonographic sign of lung interstitial syndrome, and their number increases along with decreasing air content and increase in lung density [21]. It is noted that the B-lines are counted as one if they originate from the same point on the pleural line.
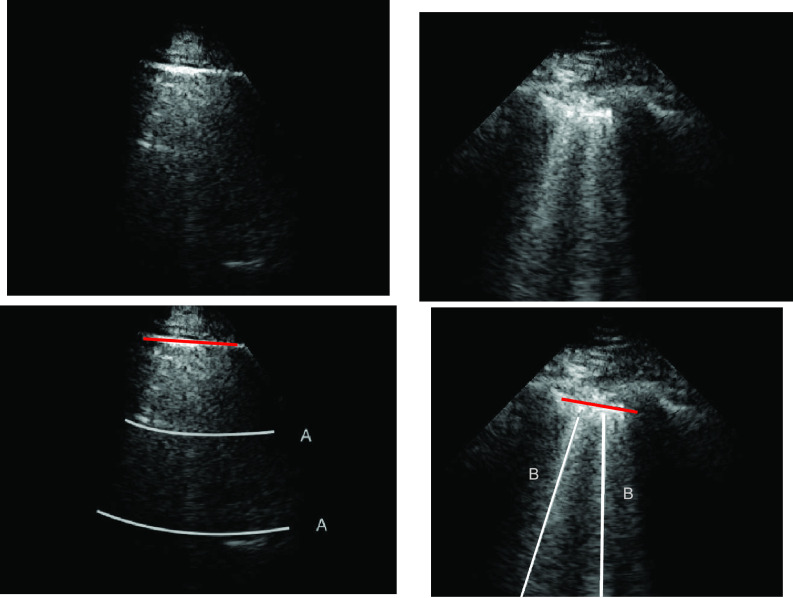
A-line artifacts are repetitive horizontal echoic lines with equidistant intervals, which are also equal to the distance between skin and pleural line [22]. The A-lines indicate subpleural air, which completely reflects the ultrasound beam. The length of an A-line can be roughly the same as the pleural line, but it can also be shorter, or even not visible because of sound beam attenuation through the lung medium. An example depicting the A- and B-lines’ artifacts in LUS is presented in Fig. 1.
Fig. 1.
LUS images (top row) and visible line artifacts overlaid on them (bottom row). There are two A-lines in the image on the left. There are two B-lines in the image on the right whilst corresponding pleural lines are shown as red lines for both of the images.
B. Clinical Significance for COVID-19 Patients
As previously mentioned, line artifacts are highly likely to be observed during SARS-CoV-2 infection in LUS images. Detection of such lines helps to rapidly and repeatedly assess COVID-19 patients at the bedside, in ICU or in emergency services. Due to its efficacy in diagnosing adult respiratory distress syndrome (ARDS) and pneumonia, LUS has been extensively used to evaluate COVID-19 patients [9]. There are several important clinical findings associated with LUS line artifacts in COVID-19 patients, such as:
-
1)
a thick and irregularly shaped pleural line;
-
2)
focal, multifocal, and confluent B-lines;
-
3)
A-lines in the recovery phase.
Specifically, depending on the stage of the disease and severity of the lung injury, line artifacts with different structures are visible in LUS for COVID-19 patients. In early stages and mild cases, focal B-lines are common. In progressive stage and for critically ill patients, one main characteristic is the alveolar interstitial syndrome. Patients with pulmonary fibrosis are most likely to have a thickened pleural line and uneven B-line artifacts. A-lines are generally observed in patients during the recovery stage [9].
III. Nonconvex Regularization for Line Artifacts Detection
A. Line Artifacts and the LUS Image Formation Model
The LUS image formation model involving line artifacts can be expressed as [4]
 |
where
 is the ultrasound image,
 is additive white Gaussian noise (AWGN) and
 is the inverse Radon transform operator.
 refers to lines as a distance
 from the center of
 , and an orientation
 from the horizontal axis of
 .
.
In image-processing applications, computing the integral of the intensities of image
 (where
 and
and
 refer to the pixel locations with respect to rows, and columns, respectively) over the hyperplane perpendicular to
 corresponds to the Radon transform
 of the given image
 . It can also be defined as a projection of the image along the angles,
 . Hence, for a given image
 , the general form of the Radon transform (
 ) is
) is
 |
where
 is the Dirac-delta function.
The inverse Radon transform (
 ) of the projected image
 can be obtained from the filtered back-projection [23] algorithm as
 |
where
 is the radius in Fourier transform, and
 and
and
 refer to forward and inverse Fourier transforms, respectively. In this work, discrete operators
 and
and
 are used as described in [24].
B. Nonconvex Regularization With a Cauchy Penalty
In this section, we propose the use of the Cauchy distribution in the form of a nonconvex penalty function for the purpose of inverting the image formation model given in (1). The Cauchy distribution is one of the special members of the
 -stable distribution family which is known to be heavy-tailed and to promote sparsity in various applications [25]–[27]. It thus fits our problem of detecting a few lines in an image well. Contrary to the general
 -stable family, it has a closed-form probability density function, which is given by [17]
 |
where
 is the scale (or the dispersion) parameter, which controls the spread of the distribution.
Considering the model in (1) with the Cauchy prior given in (5), based on a maximum a posteriori estimation formulation, the proposed method reconstructs
 via [17]
 |
The function to be minimized is composed of two terms. The first is an
 -norm data fidelity term resulting from the AWGN assumption. The second is the nonconvex Cauchy-based penalty function originally proposed in [17]
 |
To solve the minimization problem in (6) using proximal algorithms such as the forward-backward (FB) or the alternating direction method of multipliers (ADMM), the proximal operator of the Cauchy-based penalty function should be defined. In the related recent publication [17], we proposed a closed-form expression for the proximal operator of the Cauchy-based penalty function (7)
 |
The solution to this minimization problem can be obtained by taking the first derivative of (8) in terms of
 and setting it to zero. Hence we have
 |
The solution to the cubic function given in (9) can be obtained through Cardano’s method as [17]
 |
where
 is the solution to
 .
.
C. Cauchy Proximal Splitting
The use of a proximal operator corresponding to the proposed penalty function would enable the use of a proximal splitting algorithm to solve the optimization problem in (6). In particular, an optimization problem of the form
 |
can be solved via the FB algorithm. From the definition [28], provided
 is
is
 -Lipchitz differentiable with Lipchitz constant
 and
and
 , then (15) can be solved iteratively as
 |
where the step size
 is set within the interval
 . In our case, the function
 is the data fidelity term and takes the form of
 from (6) while the function
 corresponds to the Cauchy-based penalty function
 , proven in [17] to be twice continuously differentiable.
Observing (6), it can be easily deduced that since the penalty function
 is nonconvex, the overall cost function is also nonconvex in general. Hence, to avoid local minimum point estimates, one should ensure convergence of the proximal splitting algorithm employed. To this effect, we have formulated the following theorem in [17], which we recall here for completeness.
Theorem 1:
Let the twice continuously differentiable and nonconvex regularization function
be the function
and the
-Lipchitz differentiable data fidelity term
be the function
. The iterative FB subsolution to the optimization problem in (6) is
where
. If the condition
holds, then the subsolution of the FB algorithm is strictly convex, and the FB iteration in (17) converges to the global minimum.
For the proof of the theorem, we refer the reader to [17]. To comply with the condition imposed by the theorem, two approaches are possible: 1) the step size
 can be set following estimation of
 directly from the observations and 2) the scale parameter
 can be set, for cases when the Lipchitz constant
 is computed or if estimating
 requires computationally expensive calculations. In this article, we follow the second option, that is (calculate
 )
)
 [set
[set
 ]
]
 [set
[set
 ].
].
Based on Theorem 1, Algorithm 1 presents the proposed CPS algorithm for solving (6).
Algorithm 1 CPS Algorithm
-
1:
Input:

-
2:
Input:

-
3:
Output:

-
4:
Set:

-
5:
do
-
6:

- 7:
-
8:

-
9:
while

IV. Line Artifact Quantification
The proposed line artifact detection method in this article comprises of three main stages with seven different steps within. Fig. 2 depicts the proposed algorithm, in which colored boxes represent stages: 1) preprocessing and nonconvex regularization (red box); 2) detecting line artifacts (orange box); and 3) validation (green box). We discuss each stage in detail in the sequel.
Fig. 2.
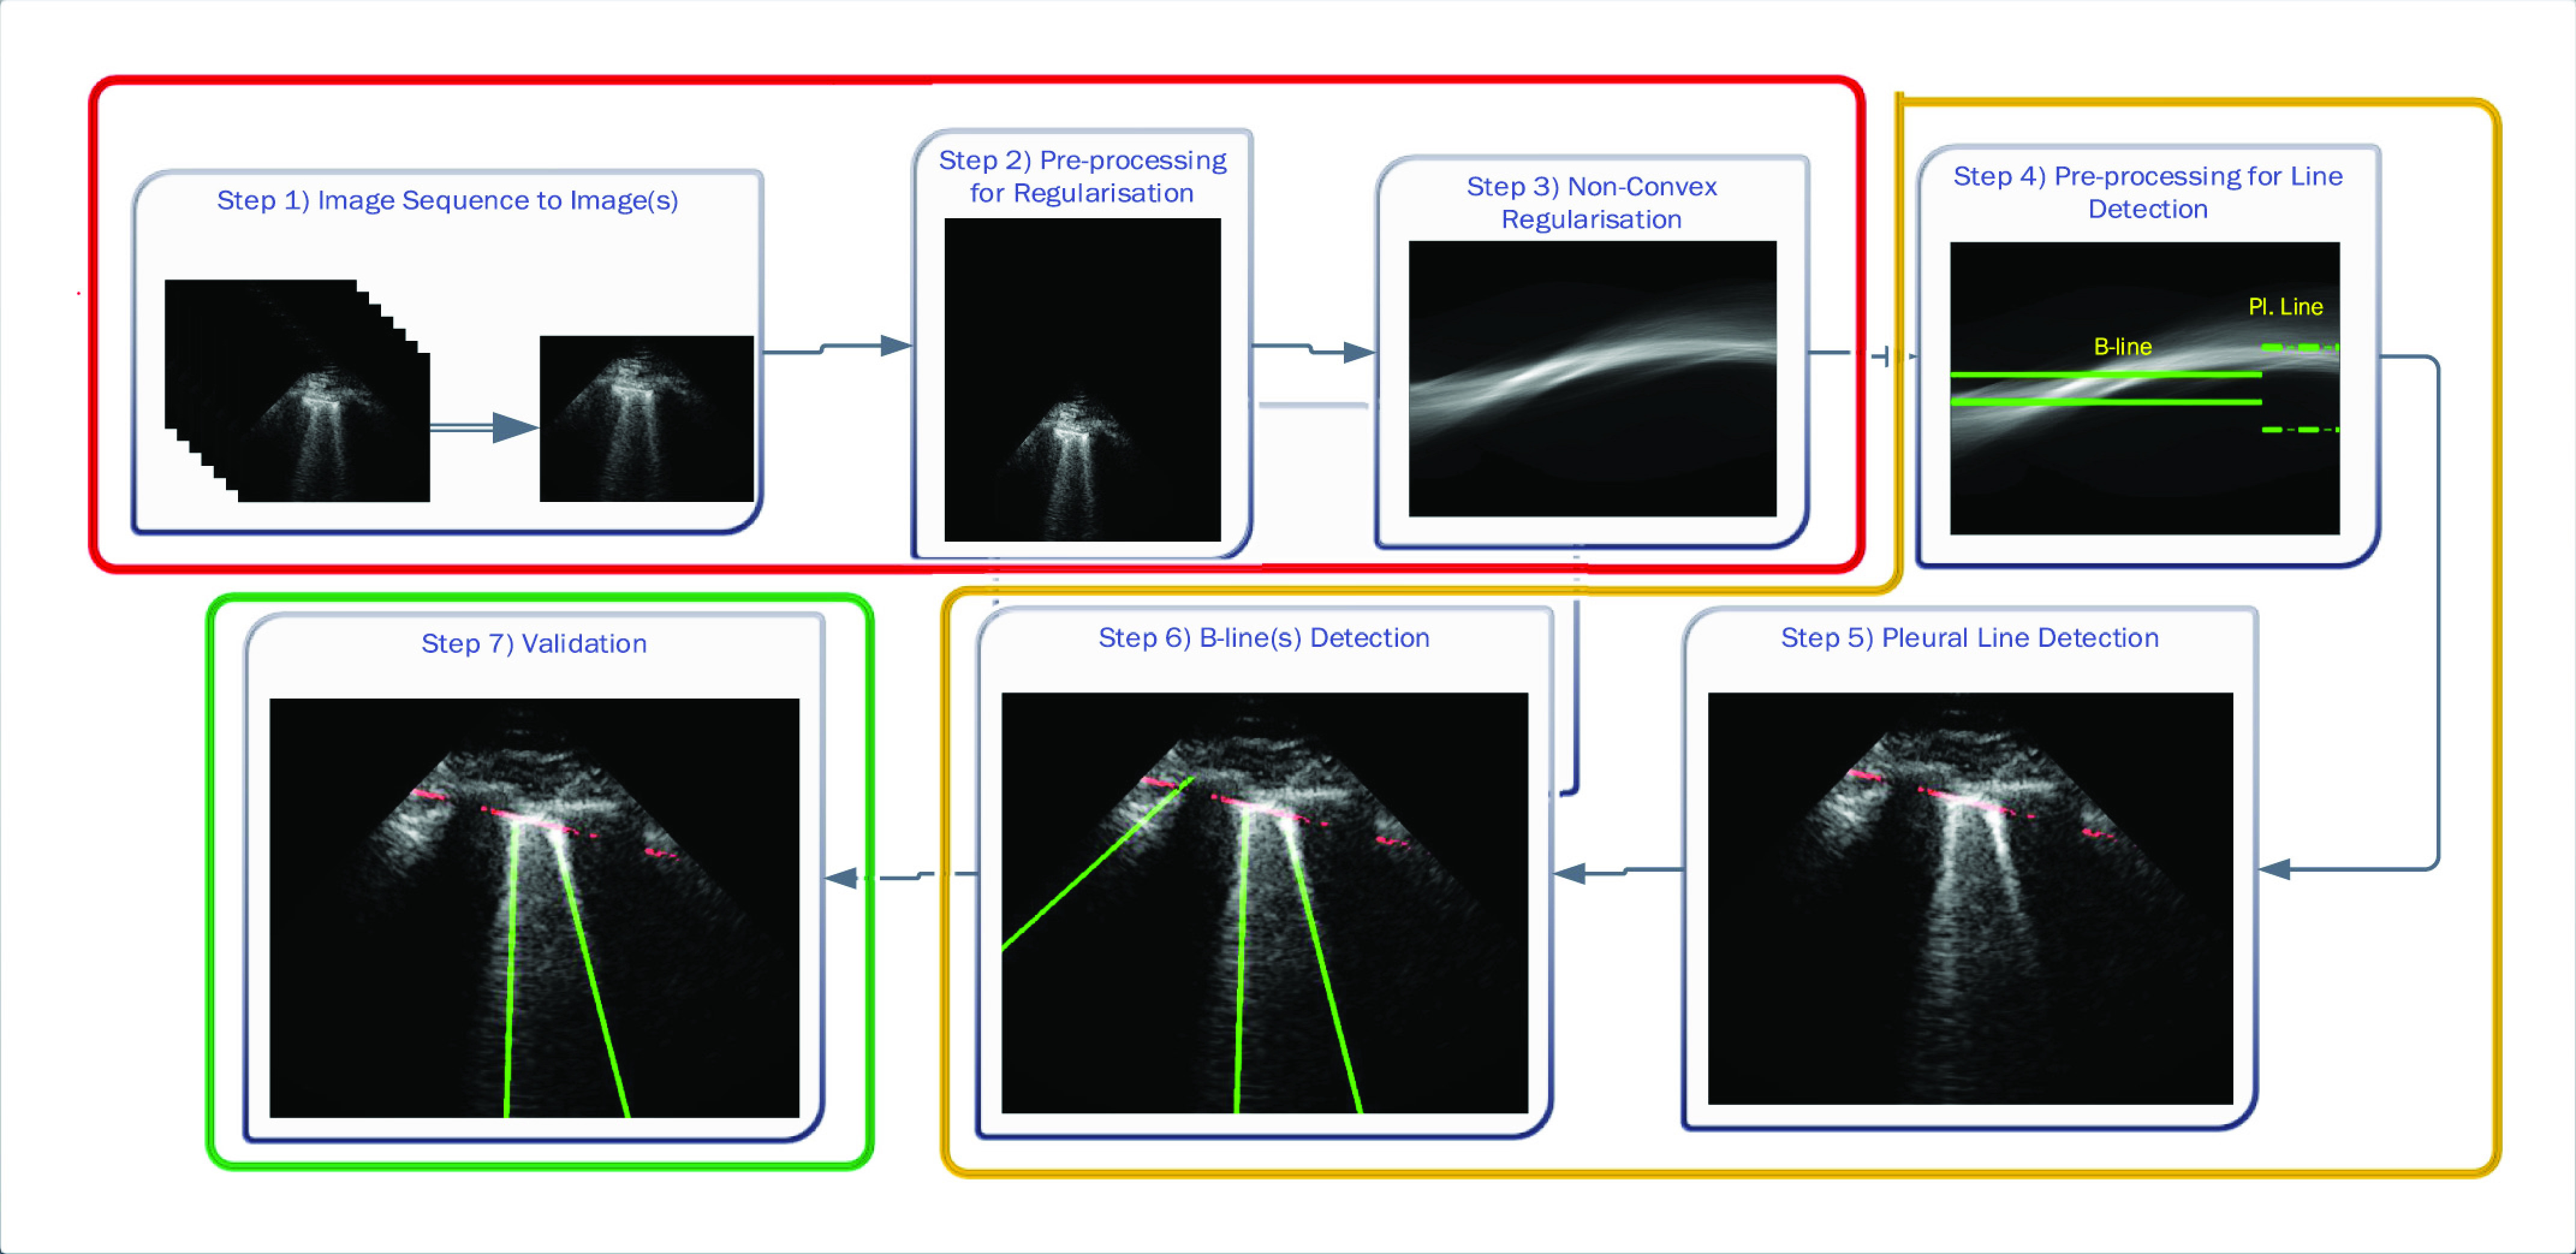
Schematic of the proposed line artifact quantification algorithm.
A. Preprocessing and Nonconvex Regularization
The first stage of the detection method is the preprocessing and nonconvex regularization, which covers the first three steps.
1). Step 1: Image Sequence to Image(s):
The given LUS image sequence is decomposed into image frames to be processed. If the image sequence includes some informing text or other scanner-related information, all these are removed, so that only ultrasound can be processed by the following steps.
2). Step 2: Preprocessing for Regularization:
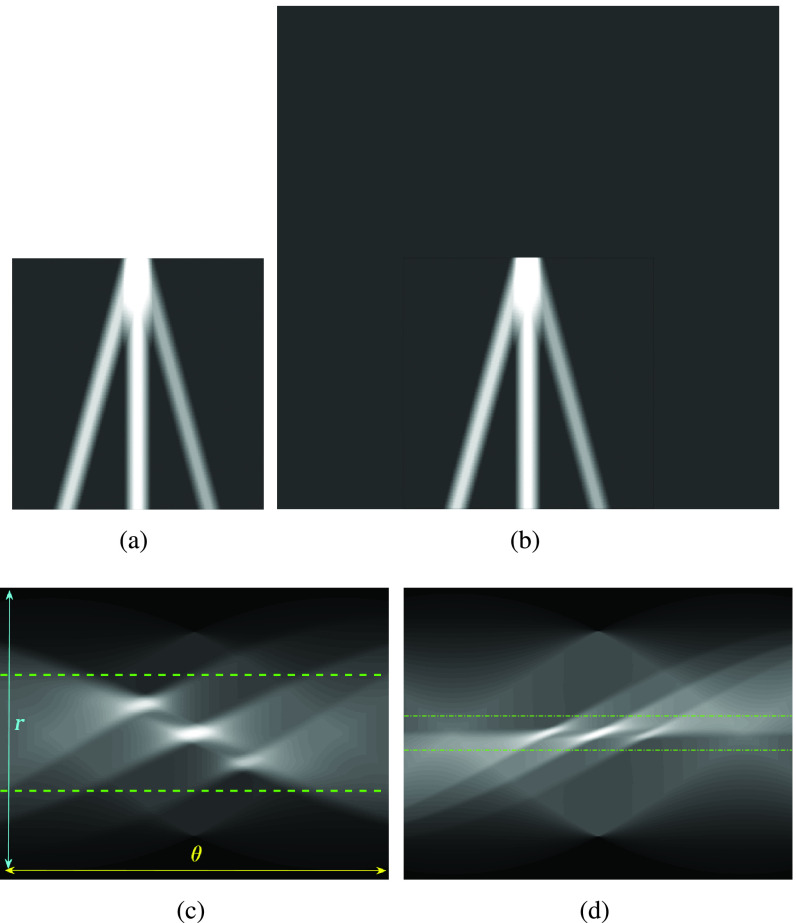
A preprocessing step is then applied to each image frame before employing the nonconvex regularization algorithm. Specifically, the preprocessing procedure includes a transformation in the image domain, which creates a “probe centred” image. An example of this procedure is presented in Fig. 3. An image frame extracted from an image sequence (set of frames or video) is first considered. Then, the probe center of the considered image frame is located in the center of a new template image. In Fig. 3(b), the probe centered image corresponding to the image frame in Fig. 3(a) is shown. The reason behind this operation is coming from a process we apply for detecting candidate B-lines in Radon transform domain. It is noted that a similar idea has been proven to be successful in an application of ship wake detection of synthetic aperture radar imaging of the sea surface in [29] and [30]. An example for the effect of the procedure in this step in Radon space is also shown in Fig. 3(c) and (d). As it can be clearly seen from Fig. 3(d), the corresponding peak points in Radon domain (corresponding to candidate B-lines in image domain) for probe centered image are located in the middle of the vertical Radon domain axis, whilst they cover a larger area in Fig. 3(c). This helps to limit the search area in Radon domain to a smaller useful range, which increases the detection accuracy and reduces the number of false detection because of noisy peak points in Radon domain. Although this procedure doubles the input image size, which causes a higher computational load, this is counterbalanced by a significant increase in detection performance.
Fig. 3.
Visual representation of step 2 in the proposed line artifact detection algorithm. (a) Simulated US image. (b) Simulated “probe centred” image. (c) Radon transform of (a). (d) Radon transform of (b). Dotted lines in (c) and (d) refer to search area limitation performed in step 4. In (c), Radon space components
 and
and
 are also shown.
3). Step 3: Nonconvex Regularization:
The probe centered image obtained in step 2 is subsequently fed as the input LUS image
 of the model in (1). Thence, the proposed nonconvex regularization with the Cauchy-based penalty function in (6) is performed to promote sparsity of the linear structures in the Radon domain. The output of the third step in the first stage of the algorithm consists in the reconstructed Radon space information of the linear structures,
 .
.
B. Detecting Line Artifacts
The second stage in the line artifact detection algorithm is the detection of all horizontal and vertical lines in Radon domain, which includes the steps from 4 to 6 in Fig. 2.
1). Step 4: Preprocessing for Line Detection in Radon Domain:
Following on from step 2, Radon space information reconstructed via the CPS algorithm is then used to detect candidate horizontal (pleural, subpleural or A) and vertical (B) lines. The preprocessing step consists of limiting search areas in Radon domain for both horizontal and vertical linear structures. It is noted that all the detected peak points in this stage are first considered as “candidate lines,” since a thresholding/validation procedure is performed in the following steps. Furthermore, all detected B-lines become final only after the validation process performed in step 7.
Deciding upper and lower borders for search areas has a crucial importance in the detection process. Selecting a large value increases the searching area, which simultaneously increases not only the number of possible candidate linear structures, but also the possibility of false detection of noisy peaks. Conversely, selecting small values may cause lines to fall outside of the search area, leading to an increase of the number of missed detections. Hence, we use borders of the search areas defined as
 |
where
 is the size of the probe centered LUS image
 (
(
 ). These borders were experimentally set to lead to the best detection results. Since the vertical lines generally start from the probe center, the search area for vertical lines become naturally smaller than the horizontal ones.
2). Step 5: Pleural (Horizontal) Line Detection:
As mentioned above, the second stage of the line artifact quantification method proposed in this study addresses the identification of several linear structures, corresponding to both horizontal lines (pleural, and either subpleural or A-lines) and vertical B-lines. The method first detects the pleural line to locate the lung space where line artifacts occur. Since the pleural line is generally horizontal, we limit the searching angle
 within the range [60°, 90°]. Then, the horizontal search area given above is scanned for detecting the local peaks of the reconstructed Radon information. All detected local peak points are candidate horizontal lines. First, we select the maximum intensity local peak, which is the closest to the Radon domain vertical axis center. The corresponding peak point is set as the detected pleural line. Following the pleural detection, the proposed method then searches
 more horizontal lines without classifying them yet as subpleural or A-lines. The user-defined value
 refers to the number of horizontal lines (except the pleural line) to be searched. The same detection procedure is then employed for detecting
 other horizontal lines.
3). Step 6: B-Line Detection:
Following the detection of horizontal lines, the procedure for B-line identification starts with detecting the vertical lines in the image by limiting the search angle
 within the range [−60°, 60°]. This is done by first searching for local peaks and adopting them as candidate B-lines. At this point, there is a high number of candidate B-lines, most of which are just local peaks not corresponding to true B-lines. Hence, to eliminate potential false detections, a thresholding operation is needed. Similar to [4], the proposed method uses the following threshold procedure:
 |
where
 and
and
 are the detected peak coordinates in Radon space, and
 refers to the distance between the pleural line and the bottom of the image. Although the definition of B-lines assumes that they extend to the bottom of the ultrasound image, in some cases this might not be true because of amplitude attenuation, which is not compensated perfectly. Hence, selecting the threshold as
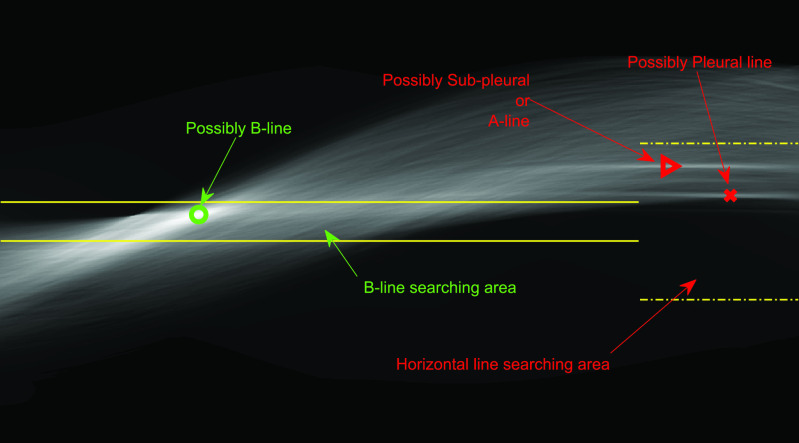
 has proven to be adequate in [4]. Following the thresholding operation, we reduce the number of candidate B-lines and the final detected number of B-lines is decided after the validation process in step 7. An example of Radon domain processing for steps 4–6 in Stage-2 of the proposed line artifact method is shown in Fig. 4.
Fig. 4.
Example of Radon domain processing for Stage-2 of the proposed line artifact method.
C. Validation
The third and last stage of the line artifact quantification method is the validation, which consists of step 7 in Fig. 2.
1). Step 7: Validation:
Even though we use a thresholding operation to eliminate erroneous peak detections in Radon space, to reduce the number of false detection of B-lines, we perform another validation step, this time in the image domain. Specifically, the validation of the candidate B-lines starts by calculating a measure index
 , which is given by
 |
where
 is the average intensity over the detected candidate B-line, and
 is the average image intensity. The
 index quantifies linear structures in the image domain, and results in higher values for brighter linear structures and lower values for less visible ones, and possibly false detections. Therefore, deciding a margin will help to reduce the possibility of false confirmations. Hence, candidate B-lines which do not follow:
 |
are discarded, whereas the remaining B-lines are validated as the final detection results. To this end, please note that setting a high
 value might lead to discarding correct linear structures (missed detection), whilst a lower
 value might increase the number of false detections. On the other hand, since every single LUS image has different levels of intensity, they have different
 values. Therefore, to create a fair margin, we should take into account the average image intensity in calculating the decision criterion. Hence, the corresponding margin is subsequently assumed to be between 25% and 50% after a trial-error procedure, according to
 |
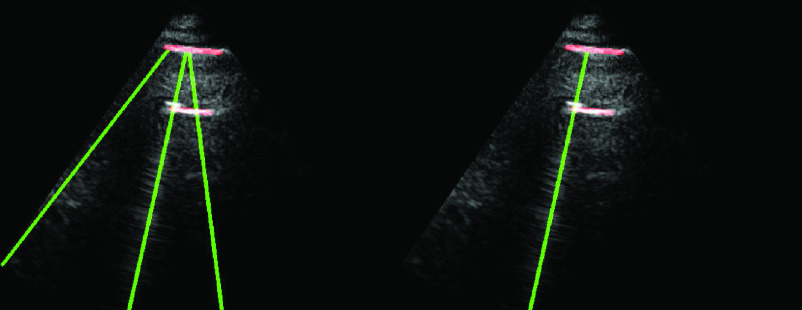
An example demonstration of the validation step is depicted in Fig. 5. From the figure, it can be clearly seen that even though a thresholding operation is performed in Radon space in step 6 [see (21)], there are still three detected candidate B-lines, two of which are clearly false detections. However, applying the validation operation in this step helps to discard these two false positives as illustrated in the right-hand side subfigure.
Fig. 5.
Example demonstrating the validation procedure in step 7. Figure on the left refers to the detection result without validation, whilst the right one is with the validation. The
 index values for the detected B-lines from left to right are −0.235, 0.677, and 0.198, respectively. The corresponding validation criterion
 is 0.25 for this example.
V. Data Set
The data sets employed in this study correspond to nine COVID-19 patients, with clinical details provided in Table I. In particular, we examined six male and three female patients aged between 51 and 79 years old. All patients were admitted to ICU and eight of them required mechanical ventilation support.
TABLE I. Clinical Characteristics of COVID-19 Patients.
| Patient No | Sex | Age (years) | BMI (kg/m2) | COVID-19 first symptoms | ICU admission | LUS acquisition | Mechanical Ventilation | PaO2/FiO2 (mmHg) |
|---|---|---|---|---|---|---|---|---|
| 1 | M | 68 | 28 | 15/03/2020 | 19/03/2020 | 06/04/2020 | Yes | 42 |
| 2 | M | 51 | 26.9 | 18/03/2020 | 25/03/2020 | 06/04/2020 | Yes | 340 |
| 3 | M | 77 | 25.3 | 16/03/2020 | 18/03/2020 | 06/04/2020 | Yes | 207 |
| 4 | M | 68 | 24.9 | 26/03/2020 | 01/04/2020 | 06/04/2020 | Yes | 87 |
| 5 | F | 58 | 34.5 | 03/04/2020 | 08/04/2020 | 08/04/2020 | No | 161 |
| 6 | F | 67 | 36.5 | 03/04/2020 | 08/04/2020 | 08/04/2020 | Yes | 184 |
| 7 | M | 61 | 23.4 | 25/03/2020 | 09/04/2020 | 09/04/2020 | Yes | 85 |
| 8 | M | 54 | 32.1 | 26/03/2020 | 07/04/2020 | 09/04/2020 | Yes | 230 |
| 9 | F | 79 | 40.8 | 08/04/2020 | 16/04/2020 | 16/04/2020 | Yes | 113 |
All patients underwent LUS assessment by investigators who did not take part in their clinical management. Investigators used standardized criteria and followed a pattern analysis. LUS was performed with a Philips CX-50 general imaging ultrasound machine (Koninklijke Philips, Amsterdam, Netherlands) and a 1- to 5-MHz bandwidth convex probe. The exploration depth was set at 13 cm. All patients were investigated in the semirecumbent position.
The anterior chest wall was delineated from the clavicles to the diaphragm and from the sternum to the anterior axillary lines. The lateral chest was delineated from the axillary zone to the diaphragm and from the anterior to the posterior axillary line. Each chest wall was divided into three lung regions. The pleural line was defined as a horizontal hyperechoic line visible 0.5 cm below the rib line. A normal pattern was defined as the presence, in every lung region, of a lung sliding with A lines (A profile). Losses of aeration were described as B-profile. Alveolar consolidation was defined as the presence of poorly defined, wedge-shaped hypoechoic tissue structures (C profile). Each of the 12 lung regions examined per patient was classified in one of these profiles to define specific quadrants.
VI. Results and Discussion
We consider the experimental part of this article from two separate angles. First, we evaluated the proposed line artifacts quantification method on LUS images of several COVID-19 patients, described in detail in Section V. We also compared our method to the state-of-the-art B-line identification method PUI [4]. Second, we highlight the image sequence processing capability of the proposed method for LUS measurements corresponding to five patients.
The first example demonstrates the use of the nonconvex Cauchy-based penalty function and the proposed line artifacts quantification method for 100 different LUS images of nine COVID-19 patients. The B-line detection performance was measured using several metrics regrouped in Table II.
TABLE II. Descriptions of Performance Comparison Metrics.
| Expression | Description |
|---|---|
| True Positive (TP) | Correct confirmation of B-lines. |
| True Negative (TN) | Correct discard of invisible lines |
| False Positive (FP) | False detection |
| False Negative (FN) | Missed detection |
| Recall | TP/(TP+FN) |
| Precision | TP/(TP+FP) |
| Specificity | TN/(TN + FP) |
| True Positive Rate (TPR) | Equivalent to Recall |
| False Positive Rate (FPR) | (1 - Specificity) |
| % Detection Accuracy | 100(TP+TN)/(TP+FP+TN+FN) |
| % Missed Detection | 100(FN)/(TP+FP+TN+FN) |
| % False Detection | 100(FP)/(TP+FP+TN+FN) |
 |
(1 +
 )Precision )Precision
 Recall/( Recall/(
 Precision + Recall) Precision + Recall) |
| Positive Likelihood | Recall/(1-Specificity) |
| Ratio (LR+) |
Table III presents the B-line quantification results for the proposed method and PUI [4] in terms of the metrics given in Table II, based on manual detections given by two clinical doctors experts in LUS. These quantitative results reveal that the proposed method improves B-line identification performance by 8% when compared to PUI. Both methods had the same false detection performance while the missed detection performance of the proposed method is around 8% less then PUI. The main important reason for this performance can be expressed via the proposed validation mechanism in the proposed methodology (step 7), which is not performed in PUI. As illustrated in Fig. 5, our approach successfully discards non-B-line detections and reduces the percentage of missed detections by up to 5%. Furthermore,
 metric clearly demonstrates that the proposed method is better for three different weighting performed for recall and precision metrics.
TABLE III. Performance Metrics for B-Line Quantification.
| Performance Metric | The Proposed Method | PUI [4] |
|---|---|---|
| % Detection Accuracy | 87.349% | 78.916% |
| % Missed Detection | 5.422% | 13.855% |
| % False Detection | 7.229% | 7.229% |
| Specificity | 7.692% | 14.286% |
| Recall | 94.118% | 84.868% |
| Precision | 92.308% | 91.489% |
 Index Index |
0.932 | 0.881 |
 Index Index |
0.938 | 0.861 |
 Index Index |
0.927 | 0.901 |
| LR+ | 1.020 | 0.990 |
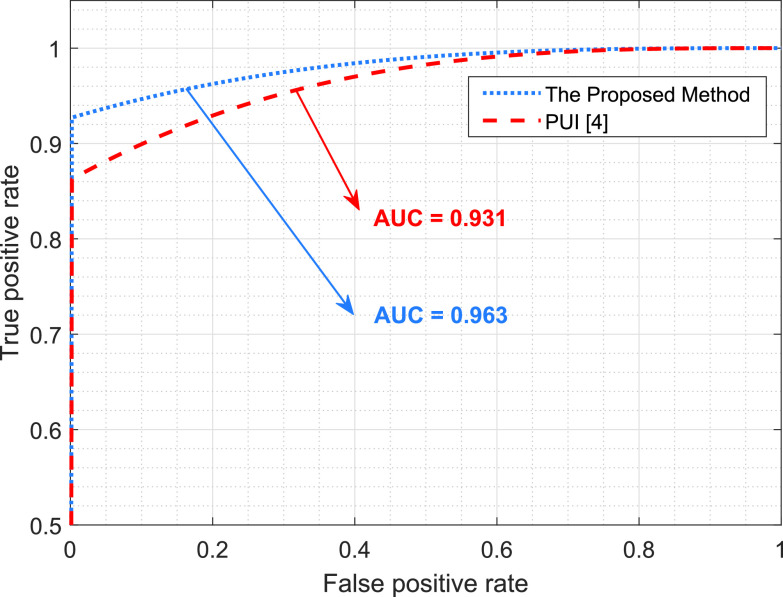
| Area under curve (AUC) | 0.963 | 0.931 |
| The average number of B-lines (Ground Truth) = 1.520 | ||
| Average Detected B-lines | 1.550 | 1.410 |
| NMSE of number of detected B-lines | 0.151 | 0.243 |
Fig. 6 shows a receiver operating characteristic (ROC) curve, which illustrates the performances of the B-line identification methods via TPR and FPR. We considered the existence of B-lines and the nonexistence of B-lines as positive and negative classes, respectively. The ROC curve shows that the proposed method significantly outperforms PUI. This also confirms the robust characteristics of the proposed approach since it achieves high recall (sensitivity) and area under curve (AUC) values.
Fig. 6.
Performance comparison of the B-line identification methods through a ROC curve.
Fig. 7 shows the line artifact quantification results for various frames captured for different patients. The detected horizontal lines were drawn on the LUS images with red colored lines, while vertical lines were drawn with green (yellow for ground truth annotations) colored lines. Each row in Fig. 7 represents the original, the expert annotated detection results, and PUI results, respectively. When examining each example LUS image along with the detection results, we can state that for the LUS images in Fig. 7(a)–(c), and (e) the proposed method detects all correct B-lines and pleural lines correctly. The performance of PUI is better than the proposed method for LUS image in Fig. 7(d), whilst it includes few missed detections for LUS images in Fig. 7(b) and (e).
Fig. 7.
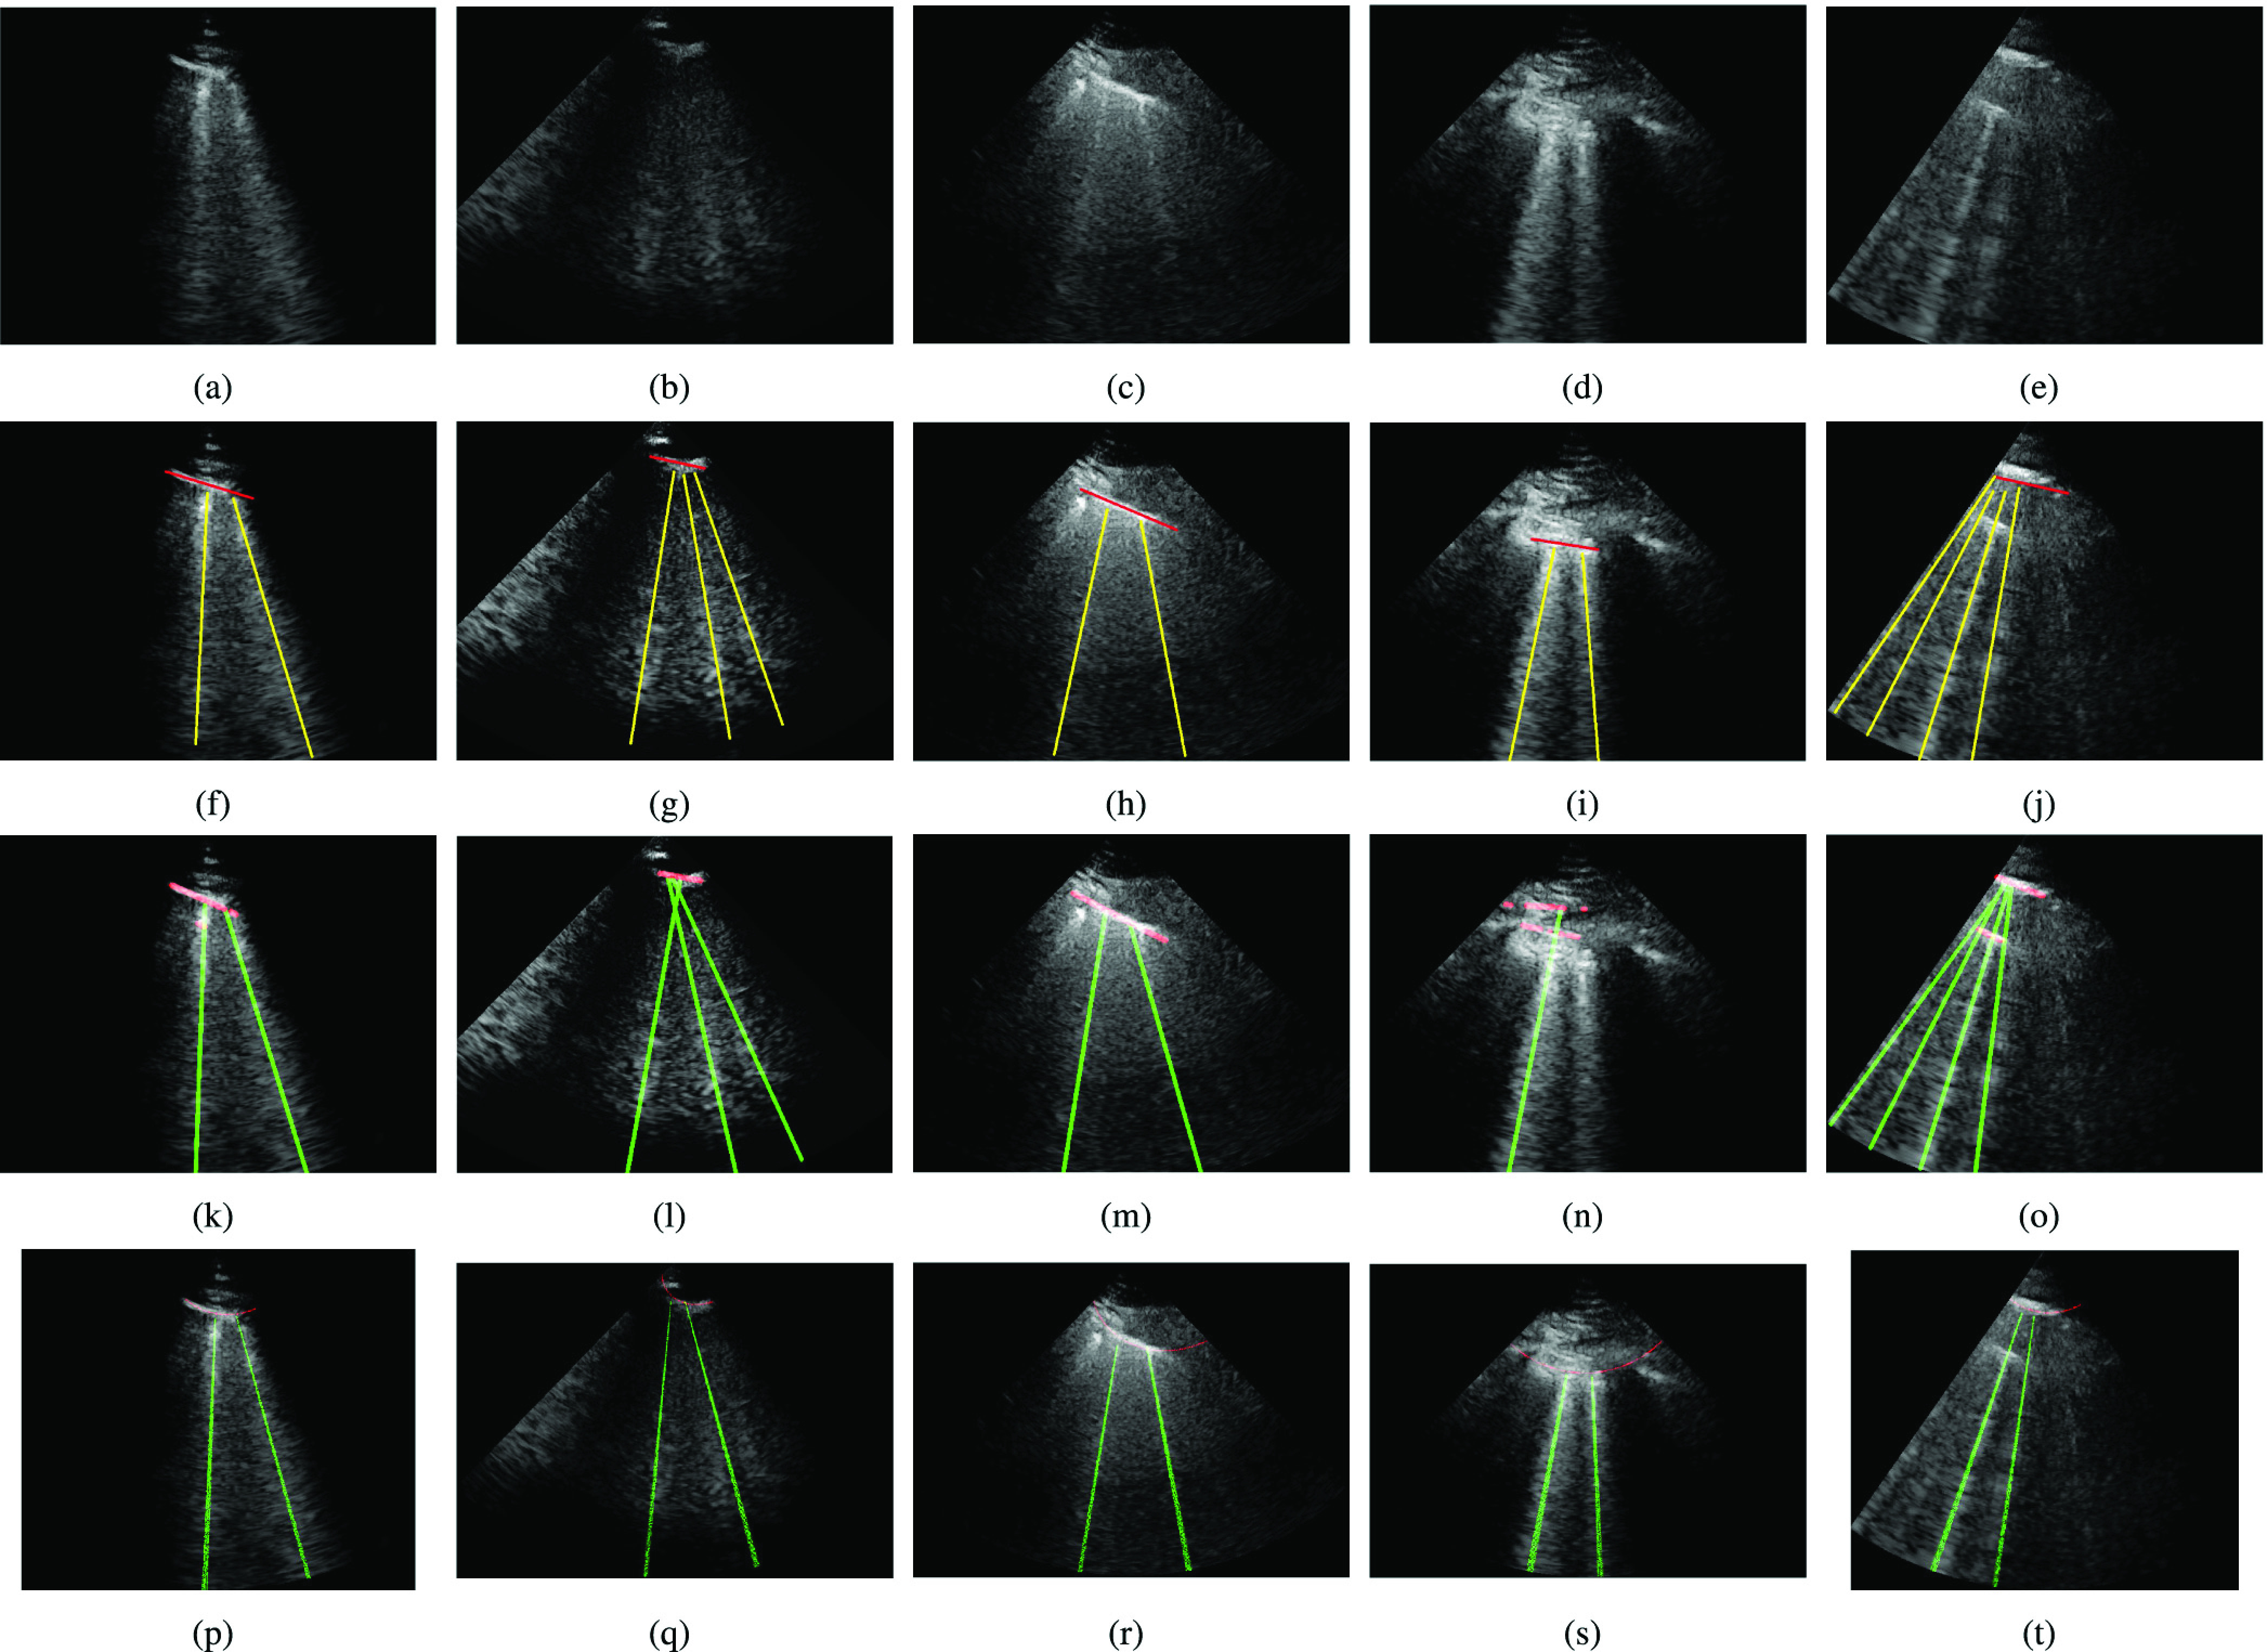
Detection results. (a)–(e) Original images. (f)–(j) Ground truth. (k)–(o) Proposed method. (p)–(t) PUI [4].
Another important metric shown in Table III is the average number of detected B-lines over all the 100 LUS images. One can observe that the proposed method’s average B-line value is closer to the correct number of average B-lines with a normalized mean square error (NMSE) of 0.151, whilst PUI has an NMSE of 0.243. Among all 100 LUS images utilized in this study, the maximum number of B-lines in a single frame is 4 [see Fig. 7(e)]. The proposed method detects all of these correctly whereas PUI achieves a maximum of 3 correctly detected B-lines in a single frame.
Finally, we tested the merits of the proposed method in processing LUS image sequences. Specifically, we fed the algorithm with a sequence of frames (201 frames for each sequence), the line detection method was run on a frame by frame basis, and an image sequence was generated including the detected line artifacts. For this test, we used five out of nine patients. Specifically, for each patient, we used a single lung region measurement. An example detection result for ten randomly selected LUS frames is given in Fig. 8 along with the expert annotated ground truth results. When examining the results, we can clearly see that for all 10 randomly selected frames, the proposed method detects B-lines and pleural lines with 100% accuracy.
Fig. 8.
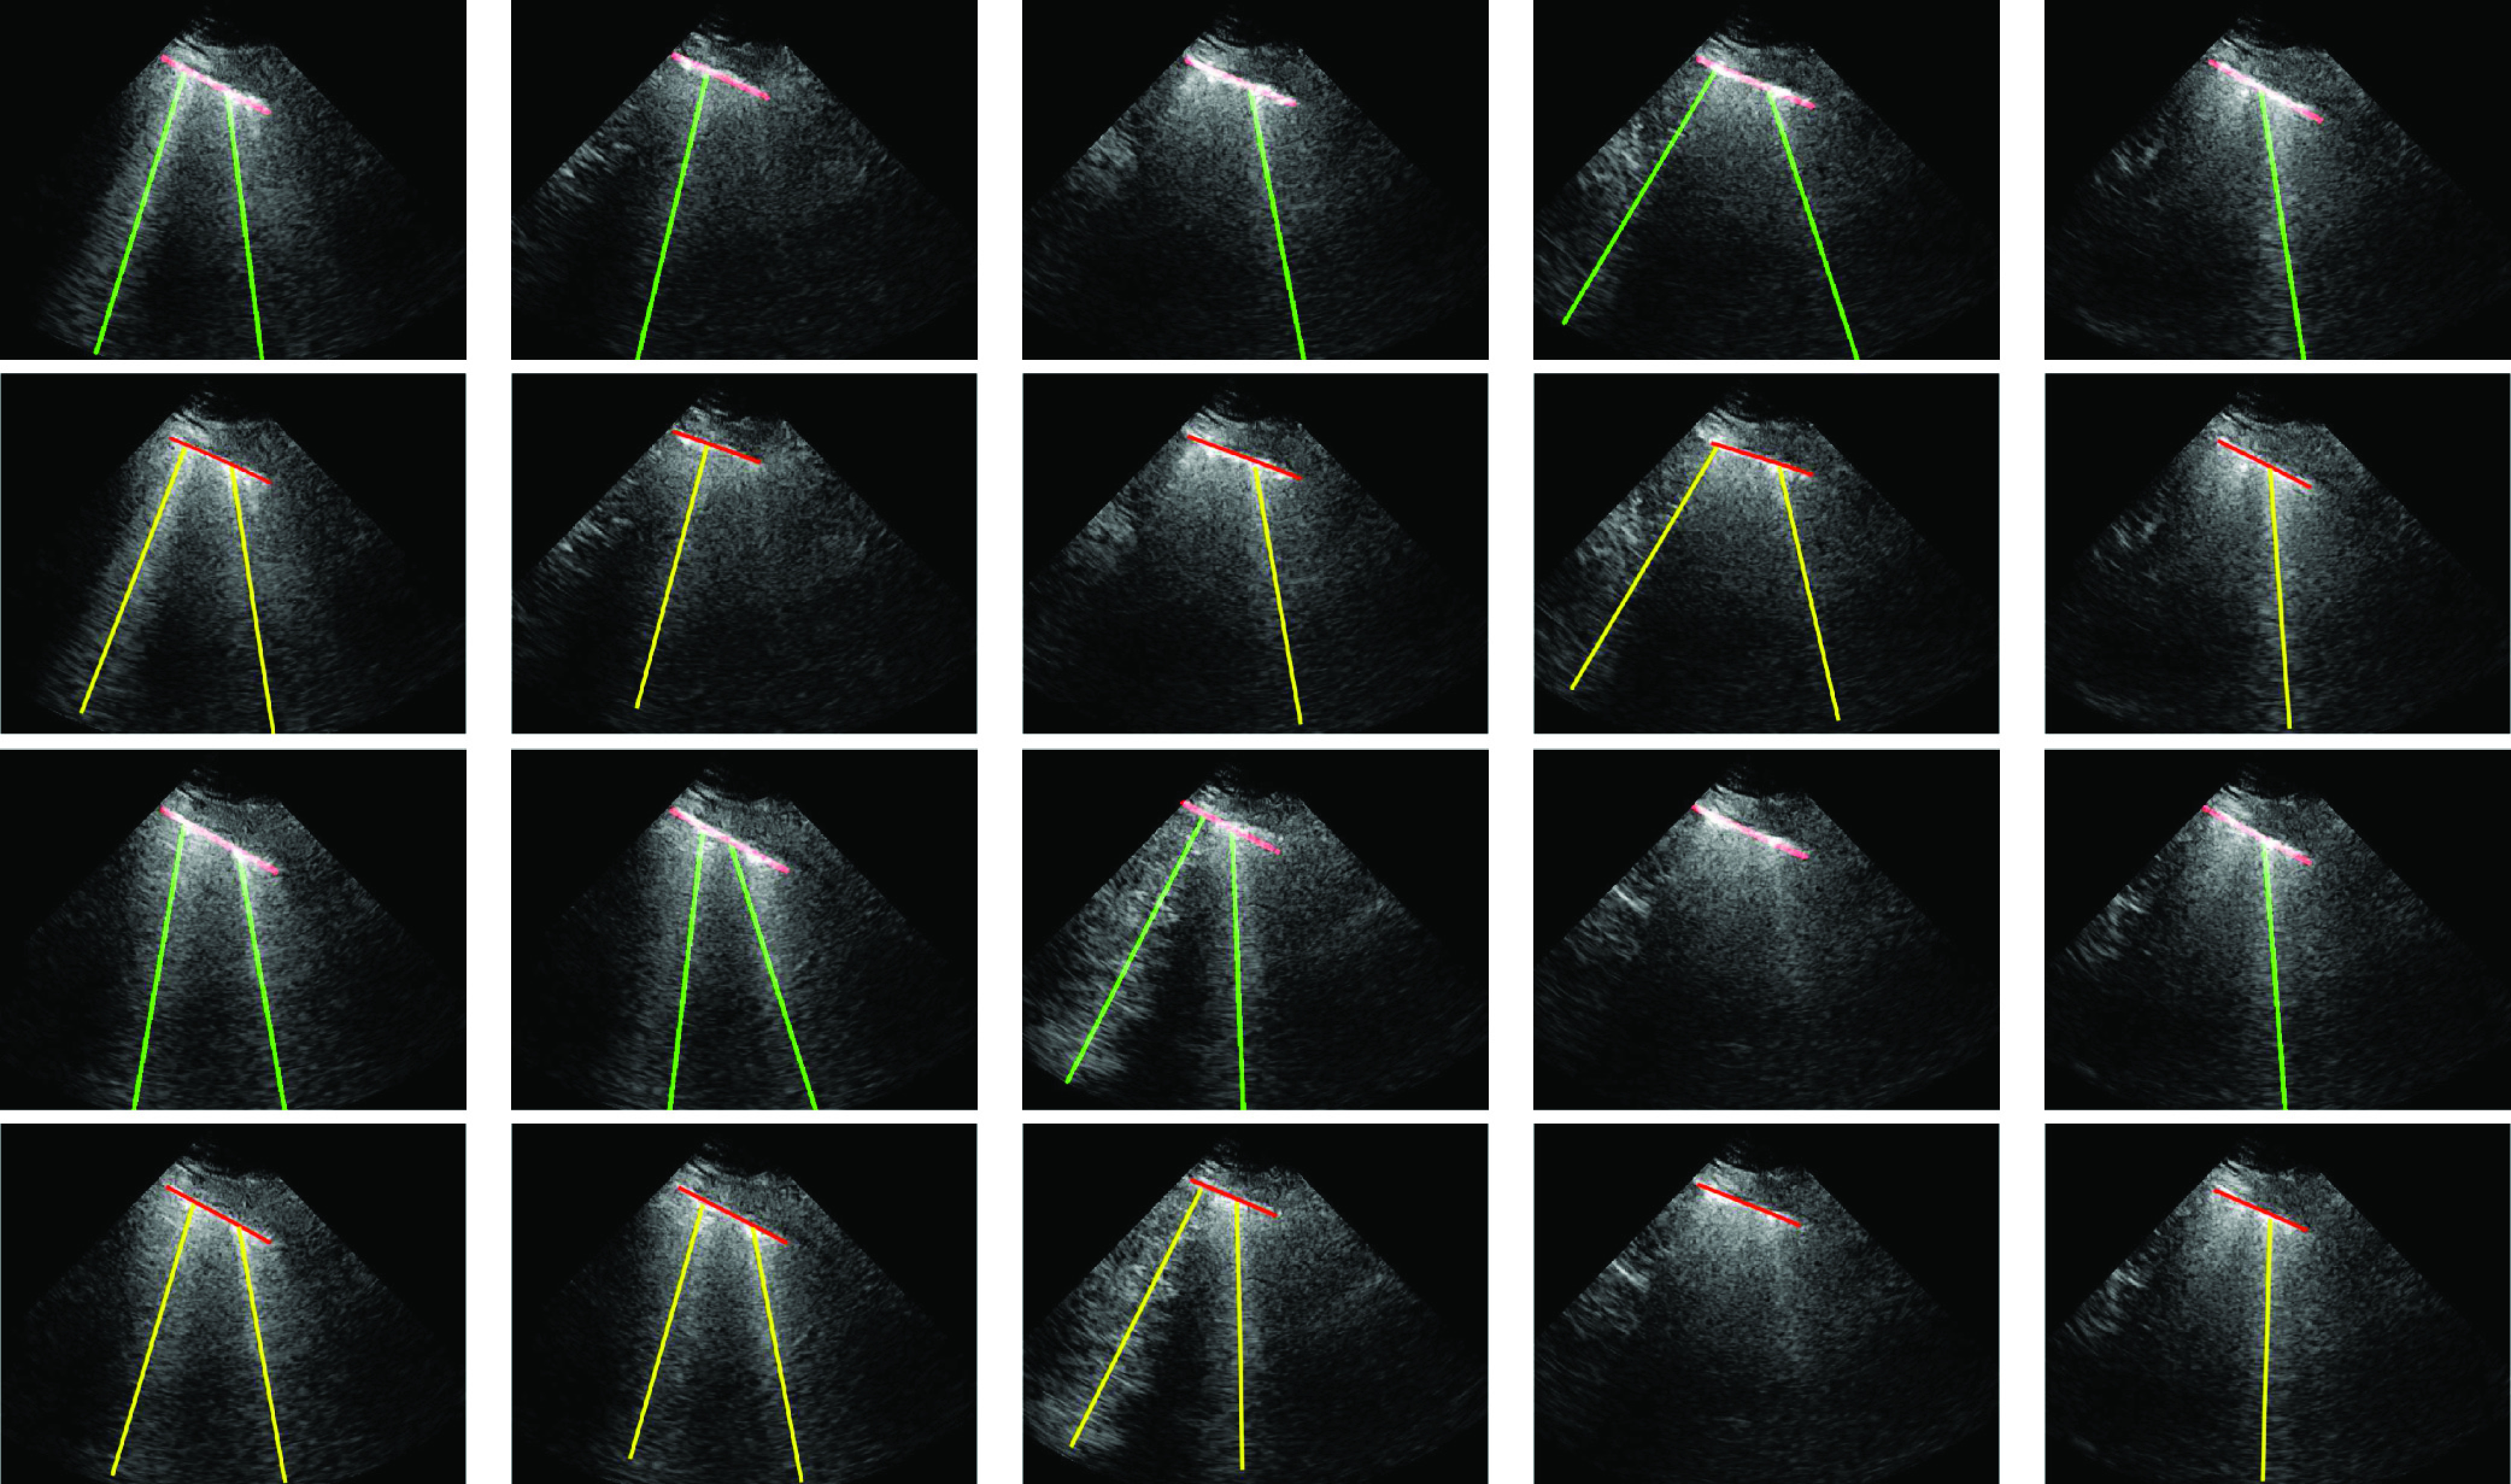
Proposed image sequence processing results for a single patient, for selected ten example frames. The first and third rows refer to the proposed method results, whilst second and fourth rows are ground truth annotated results by an expert. Specifically, from left to right at the first two rows, frames numbers are 35, 53, 82, 87, and 110 whilst the last two rows refer to frames 121, 160, 172, 186, and 201.
Despite being based on the optimization of a nonconvex cost function, the advantage of the proposed methodology in processing image sequences is its guaranteed convergence, which is achieved with a reasonably low computational cost. In Fig. 9(a), we show the mean processing time per frame for all five image sequences we utilized in this study. On examining Fig. 9(a), one can clearly see that the processing time for a single frame is around 11–13 s. The method is implemented in MATLAB R2019a on a laptop computer (Intel i7-2.7-GHz processor with 16-GB RAM). It is noted that the relatively long computational time could be hugely reduced following code optimization and eventual parallelization.
Fig. 9.

Image sequence processing results. Running mean plots for (a) processing time per frame and (b) detected number of B-lines.
Fig. 9(b) shows the mean of the detected B-lines per frame for all five patients. From this figure, one can see that the average number of B-lines for different COVID-19 patients is generally around 1–1.5, which is correlated with the average number of correct B-lines (1.520) over all 100 LUS images employed in the previous experiment.
VII. Conclusion
Along with other medical imaging modalities, including CT and X-ray, LUS imaging has played an ever increasing role in confirming positive COVID-19 patients. Indeed, due to its applicability at the bedside and real-time capability in assessing lungs status, LUS has quickly become a modality of choice during the SARS-CoV-2 outbreak. Line artifacts in LUS provide vital information on the stage and progression of COVID-19. Hence, automating the detection of B-lines will widen the applicability of LUS while reducing the need for expert interpretation and will benefit doctors, nurses, patients, and their families alike.
In this article, we proposed a novel nonconvex regularization based line artifacts quantification method with applications in LUS evaluation of COVID-19 patients. The proposed method poses line detection as an inverse problem and exploits Radon space information for promoting linear structures. We utilized a nonconvex Cauchy-based penalty function, which guarantees convergence to global minima when using the CPS algorithm.
Experimental results demonstrate an excellent line detection performance for 100 LUS images showing several B-line structures, observed in nine COVID-19 patients. The performance evaluation of the proposed algorithm was conducted in comparison to the state-of-the-art PUI method in [4]. Objective results demonstrate that the proposed method outperforms PUI by around 8% in terms of B-line detection accuracy. It is also important to note that the proposed method is completely unsupervised. On the assumption that annotated data are not available freely, an unsupervised method such as the proposed one will always have advantages over (weakly, semi-, or fully) supervised methods.
Despite our current unoptimized MATLAB implementation, the proven convergence properties of the proposed algorithm enable the computation of a single LUS frame in around 12 s. This determines the processing of LUS image sequences in a reasonable amount of time with a very good performance. Further optimization of our algorithms for achieving real-time performance and their implementation on mobile platforms, and further evaluations in other acquisition settings are part of our current research endeavors.
Acknowledgment
The authors would like to thank Dr. Hélène Vinour, Dr. Sihem Bouharaoua, and Dr. Béatrice Riu for their help with data collection. They would also like to thank Prof. Olivier Lairez from Toulouse University Hospital, Toulouse, France, who facilitated the initiation of this collaborative effort.
Biographies

Oktay Karakuş (Member, IEEE) received the B.Sc. degree (Hons.) in electronics engineering from Istanbul Kültür University, Istanbul, Turkey, in 2009, and the M.Sc. and Ph.D. degrees in electronics and communication engineering from the İzmir Institute of Technology (IZTECH), Urla, Turkey, in 2012 and 2018, respectively.
From October 2009 to January 2018, he was associated with the Department of Electrical and Electronics Engineering, Yaşar University, Bornova, Turkey, and the Department of Electronics and Communication Engineering, IZTECH, as a Research Assistant. He was a Visiting Scholar with the Institute of Information Science and Technologies (ISTI-CNR), Pisa, Italy, in 2017. Since March 2018, he has been working as a Research Associate in image processing with the Visual Information Laboratory, Department of Electrical and Electronic Engineering, University of Bristol, Bristol, U.K. His research interests include statistical/Bayesian signal and image processing and inverse problems with applications on SAR and ultrasound imagery, heavy tailed data modeling, telecommunications, and energy.

Nantheera Anantrasirichai (Member, IEEE) received the B.E. degree in electrical engineering from Chulalongkorn University, Bangkok, Thailand, in 2000, and the Ph.D. degree in electrical and electronic engineering from the University of Bristol, Bristol, U.K., in 2007.
She is currently a Research Fellow with the Visual Information Laboratory, University of Bristol. Her current research interests include image and video coding, image analysis and enhancement, image fusion, medical imaging, texture-based image analysis, and remote sensing.
Amazigh Aguersif received the medical degree from Toulouse III Paul Sabatier University, Toulouse, France, in 2019, with a thesis in Anesthesiology and Critical Care. His research interests are chest imaging of respiratory viral infections, pleuropulmonary and cardiac ultrasound, invasive mechanical ventilation optimization, and hemodynamic monitoring in the context of intensive care.

Adrian Basarab (Senior Member, IEEE) received the M.S. and Ph.D. degrees in signal and image processing from the National Institute of Applied Sciences, Lyon, France, in 2005 and 2008, respectively.
Since 2009 (respectively 2016), he has been an Assistant (respectively Associate) Professor with the University Paul Sabatier–Toulouse III, Toulouse, France, where he is also a member of the IRIT Laboratory (UMR CNRS 5505). Since 2018, he has been the Head of Computational Imaging and Vision Group, IRIT Laboratory, University of Toulouse, Toulouse. His research interests include medical imaging and more particularly inverse problems (deconvolution, super-resolution, compressive sampling, beamforming, image registration, and fusion) applied to ultrasound image formation, ultrasound elastography, cardiac ultrasound, quantitative acoustic microscopy, computed tomography, and magnetic resonance imaging.
Dr. Basarab was a member of the French National Council of Universities Section 61—Computer Sciences, Automatic Control and Signal Processing from 2010 to 2015. In 2017, he was a Guest Co-Editor of the IEEE Transactions on Ultrasonics, Ferroelectrics, and Frequency Control (TUFFC) Special Issue on Sparsity Driven Methods in Medical Ultrasound. Since 2019, he has been a member of the EURASIP Technical Area Committee Biomedical Image and Signal Analytics. Since 2020, he has been a member of the IEEE Ultrasonics Symposium TPC. He is currently an Associate Editor of Digital Signal Processing.

Alin Achim (Senior Member, IEEE) received the B.Sc. and M.Sc. degrees in electrical engineering from the Politehnica University of Bucharest, Bucharest, Romania, in 1995 and 1996, respectively, and the Ph.D. degree in biomedical engineering from the University of Patras, Patras, Greece, in 2003.
He then obtained European Research Consortium for Informatics and Mathematics (ERCIM) Postdoctoral Fellowship which he spent with the Institute of Information Science and Technologies (ISTI-CNR), Pisa, Italy, and the French National Institute for Research in Computer Science and Control (INRIA), Sophia Antipolis, France. In October 2004, he joined the Department of Electrical and Electronic Engineering, University of Bristol, Bristol, U.K., as a Lecturer, where he became a Senior Lecturer (an Associate Professor) in 2010 and a Reader in biomedical image computing in 2015. Since August 2018, he has been holding the Chair in computational imaging with the University of Bristol. From 2019 to 2020, he was a Leverhulme Trust Research Fellow with the Laboratoire I3S, Université of Côte d’Azur, Nice, France. He has coauthored over 140 scientific publications, including 40 journal articles. His research interests include statistical signal and image and video processing with a particular emphasis on the use of sparse distributions within sparse domains and with applications in both biomedical imaging and remote sensing.
Dr. Achim is an Editorial Board Member of the MDPI’s Remote Sensing. He was/is an Elected Member of the Bio Imaging and Signal Processing Technical Committee of the IEEE Signal Processing Society, an Affiliated Member (invited) of the same Society’s Signal Processing Theory and Methods Technical Committee, and a member of the IEEE Geoscience and Remote Sensing Society’s Image Analysis and Data Fusion Technical Committee. He is a Senior Area Editor of the IEEE Transactions on Image Processing and an Associate Editor of the IEEE Transactions on Computational Imaging.
Stein Silva, photograph and biography not available at the time of publication.
Funding Statement
This work was supported in part by the U.K. Engineering and Physical Sciences Research Council (EPSRC) under Grant EP/R009260/1 and in part by the EPSRC Impact Acceleration Award (IAA) from the University of Bristol. The work of Alin Achim was supported in part by the Leverhulme Trust Research Fellowship (INFHER).
Contributor Information
Oktay Karakuş, Email: o.karakus@bristol.ac.uk.
Nantheera Anantrasirichai, Email: n.anantrasirichai@bristol.ac.uk.
Amazigh Aguersif, Email: amazighaguersif@gmail.com.
Stein Silva, Email: silvastein@me.com.
Adrian Basarab, Email: adrian.basarab@irit.fr.
Alin Achim, Email: alin.achim@bristol.ac.uk.
References
- [1].Thomas A., Haljan G., and Mitra A., “Lung ultrasound findings in a 64-year-old woman with COVID-19,” Can. Med. Assoc. J., vol. 192, no. 15, p. E399, Apr. 2020. [DOI] [PMC free article] [PubMed] [Google Scholar]
- [2].Silva S.et al. , “Combined thoracic ultrasound assessment during a successful weaning trial predicts postextubation distress,” Anesthesiology, vol. 127, no. 4, pp. 666–674, Oct. 2017. [DOI] [PubMed] [Google Scholar]
- [3].Bataille B.et al. , “Accuracy of ultrasound B-lines score and E/Ea ratio to estimate extravascular lung water and its variations in patients with acute respiratory distress syndrome,” J. Clin. Monitor. Comput., vol. 29, no. 1, pp. 169–176, Feb. 2015. [DOI] [PubMed] [Google Scholar]
- [4].Anantrasirichai N., Hayes W., Allinovi M., Bull D., and Achim A., “Line detection as an inverse problem: Application to lung ultrasound imaging,” IEEE Trans. Med. Imag., vol. 36, no. 10, pp. 2045–2056, Oct. 2017. [DOI] [PMC free article] [PubMed] [Google Scholar]
- [5].Dietrich C. F.et al. , “Lung B-line artefacts and their use,” J. Thoracic Disease, vol. 8, no. 6, p. 1356, 2016. [DOI] [PMC free article] [PubMed] [Google Scholar]
- [6].Soldati G., Demi M., Inchingolo R., Smargiassi A., and Demi L., “On the physical basis of pulmonary sonographic interstitial syndrome,” J. Ultrasound Med., vol. 35, no. 10, pp. 2075–2086, Oct. 2016. [DOI] [PubMed] [Google Scholar]
- [7].Soldati G.et al. , “Proposal for international standardization of the use of lung ultrasound for patients with COVID-19: A simple, quantitative, reproducible method,” J. Ultrasound Med., vol. 3, no. 7, pp. 1413–1419, 2020. [DOI] [PMC free article] [PubMed] [Google Scholar]
- [8].Buonsenso D., Piano A., Raffaelli F., Bonadia N., Donati K. D. G., and Franceschi F., “Novel coronavirus disease-19 pnemoniae: A case report and potential applications during COVID-19 outbreak,” Eur. Rev. Med. Pharmacol. Sci., vol. 24, pp. 2776–2780, May 2020. [DOI] [PubMed] [Google Scholar]
- [9].Peng Q.-Y.et al. , “Findings of lung ultrasonography of novel corona virus pneumonia during the 2019–2020 epidemic,” Intensive Care Med., to be published. [DOI] [PMC free article] [PubMed]
- [10].Vetrugno L.et al. , “Our Italian experience using lung ultrasound for identification, grading and serial follow-up of severity of lung involvement for management of patients with COVID-19,” Echocardiography, vol. 37, no. 4, pp. 625–627, 2020. [DOI] [PMC free article] [PubMed] [Google Scholar]
- [11].Brattain L. J., Telfer B. A., Liteplo A. S., and Noble V. E., “Automated B-Line scoring on thoracic sonography,” J. Ultrasound Med., vol. 32, no. 12, pp. 2185–2190, Dec. 2013. [DOI] [PubMed] [Google Scholar]
- [12].Moshavegh R.et al. , “Novel automatic detection of pleura and B-lines (comet-tail artifacts) on in vivo lung ultrasound scans,” Med. Imag. 2016: Ultrason. Imag. Tomogr., vol. 9790, Apr. 2016, Art. no. 97900K. [Google Scholar]
- [13].Weitzel W. F.et al. , “Quantitative lung ultrasound comet measurement: Method and initial clinical results,” Blood Purification, vol. 39, nos. 1–3, pp. 37–44, Jun. 2015. [DOI] [PubMed] [Google Scholar]
- [14].Moshavegh R., Hansen K. L., Møller-Sørensen H., Nielsen M. B., and Jensen J. A., “Automatic detection of B-lines in In Vivo lung ultrasound,” IEEE Trans. Ultrason., Ferroelectr., Freq. Control, vol. 66, no. 2, pp. 309–317, Feb. 2019. [DOI] [PubMed] [Google Scholar]
- [15].van Sloun R. J. and Demi L., “Localizing B-lines in lung ultrasonography by weakly supervised deep learning, In-Vivo results,” IEEE J. Biomed. Health Inform., vol. 24, no. 4, pp. 957–964, Apr. 2020. [DOI] [PubMed] [Google Scholar]
- [16].Wang X., Burzynski J. S., Hamilton J., Rao P. S., Weitzel W. F., and Bull J. L., “Quantifying lung ultrasound comets with a convolutional neural network: Initial clinical results,” Comput. Biol. Med., vol. 107, pp. 39–46, Apr. 2019. [DOI] [PubMed] [Google Scholar]
- [17].Karakus O., Mayo P., and Achim A., “Convergence guarantees for non-convex optimisation with cauchy-based penalties,” 2020, arXiv:2003.04798. [Online]. Available: http://arxiv.org/abs/2003.04798
- [18].Sherman R. A., “Crackles and comets: Lung ultrasound to detect pulmonary congestion in patients on dialysis is coming of age,” Clin. J. Amer. Soc. Nephrol., vol. 11, no. 11, pp. 1924–1926, 2016, doi: 10.2215/CJN.09140816. [DOI] [PMC free article] [PubMed] [Google Scholar]
- [19].Jambrik Z.et al. , “Usefulness of ultrasound lung comets as a nonradiologic sign of extravascular lung water,” Amer. J. Cardiol., vol. 93, no. 10, pp. 1265–1270, May 2004. [DOI] [PubMed] [Google Scholar]
- [20].Gargani L. and Volpicelli G., “How i do it: Lung ultrasound,” Cardiovascular Ultrasound, vol. 12, no. 1, p. 25, Dec. 2014. [DOI] [PMC free article] [PubMed] [Google Scholar]
- [21].Trezzi M.et al. , “Lung ultrasonography for the assessment of rapid extravascular water variation: Evidence from hemodialysis patients,” Internal Emergency Med., vol. 8, no. 5, pp. 409–415, Aug. 2013. [DOI] [PubMed] [Google Scholar]
- [22].Lichtenstein D. A., Mezière G. A., Lagoueyte J.-F., Biderman P., Goldstein I., and Gepner A., “A-lines and B-lines: Lung ultrasound as a bedside tool for predicting pulmonary artery occlusion pressure in the critically ill,” Chest, vol. 136, no. 4, pp. 1014–1020, 2009. [DOI] [PubMed] [Google Scholar]
- [23].Kak A. C. and Slaney M., Principles of Computerized Tomographic Imaging. New York, NY, USA: IEEE Press, 1988. [Google Scholar]
- [24].Kelley B. T. and Madisetti V. K., “The fast discrete radon transform. I. theory,” IEEE Trans. Image Process., vol. 2, no. 3, pp. 382–400, Jul. 1993. [DOI] [PubMed] [Google Scholar]
- [25].Wan T., Canagarajah N., and Achim A., “Segmentation of noisy colour images using Cauchy distribution in the complex wavelet domain,” IET Image Process., vol. 5, no. 2, pp. 159–170, 2011. [Google Scholar]
- [26].Yang T., Karakuş O., and Achim A., “Detection of ship wakes in SAR imagery using cauchy regularisation,” 2020, arXiv:2002.04744. [Online]. Available: http://arxiv.org/abs/2002.04744
- [27].Karakuş O. and Achim A., “On solving SAR imaging inverse problems using nonconvex regularization with a Cauchy-based penalty,” IEEE Trans. Geosci. Remote Sens., early access, Aug. 6, 2020, doi: 10.1109/TGRS.2020.3011631. [DOI]
- [28].Combettes P. L. and Pesquet J.-C., “Proximal splitting methods in signal processing,” in Fixed-Point Algorithms for Inverse Problems in Science and Engineering. New York, NY, USA: Springer, 2011, pp. 185–212. [Google Scholar]
- [29].Karakus O., Rizaev I., and Achim A., “Ship wake detection in SAR images via sparse regularization,” IEEE Trans. Geosci. Remote Sens., vol. 58, no. 3, pp. 1665–1677, Mar. 2020, doi: 10.1109/TGRS.2019.2947360. [DOI] [Google Scholar]
- [30].Graziano M., D’Errico M., and Rufino G., “Wake component detection in X-Band SAR images for ship heading and velocity estimation,” Remote Sens., vol. 8, no. 6, p. 498, Jun. 2016. [Google Scholar]


