

Abstract
Scarcity of annotated images hampers the building of automated solution for reliable COVID-19 diagnosis and evaluation from CT. To alleviate the burden of data annotation, we herein present a label-free approach for segmenting COVID-19 lesions in CT via voxel-level anomaly modeling that mines out the relevant knowledge from normal CT lung scans. Our modeling is inspired by the observation that the parts of tracheae and vessels, which lay in the high-intensity range where lesions belong to, exhibit strong patterns. To facilitate the learning of such patterns at a voxel level, we synthesize ‘lesions’ using a set of simple operations and insert the synthesized ‘lesions’ into normal CT lung scans to form training pairs, from which we learn a normalcy-recognizing network (NormNet) that recognizes normal tissues and separate them from possible COVID-19 lesions. Our experiments on three different public datasets validate the effectiveness of NormNet, which conspicuously outperforms a variety of unsupervised anomaly detection (UAD) methods.
Keywords: COVID-19, label-free lesion segmentation, voxel-level anomaly modeling
I. Introduction
The world has been facing a global pandemic caused by a novel Coronavirus Disease (COVID-19) since December 2019 [1], [2]. According to the report from World Health Organization, COVID-19 has infected over 62 millions people including more than half a million deaths up to November 30 [3]. In clinics, real-time reverse-transcription–polymerase-chainreaction (RT-PCR) [4], [5] and the radiological imaging techniques, e.g., X-ray and computed tomography (CT), play a key role in COVID-19 diagnosis and evaluation [2], [6].
Due to the high spatial resolution and the unique relationship between CT density and lung air content [7]–[10], CT is widely preferred to recognize and segment the typical signs of COVID-19 infection [11]. Furthermore, segmentation of COVID-19 lesions provides crucial information for quantitative measurement and follow-up assessment [12]. As it is time-consuming for experts to go through the 3D CT volumes slice by slice, automatic segmentation is highly desirable in clinical practice [2], [13]. Recently, deep learning based methods have been proposed for COVID-19 lesion screening [2] and some of them are proved successful for COVID-19 segmentation [11]–[13].
Despite such success, they all rely on large-scale well-labeled datasets. However, obtaining such datasets is very difficult due to two related concerns. On the one hand, labeling a 3D CT volume is costly and time-consuming. Often it needs experienced radiologists, who are busy fighting the COVID-19 pandemic and hence lack time for lesion labeling. On the other hand, the COVID-19 lesions not only have a variety of complex appearances such as Ground-Glass Opacity (GGO), reticulation, and consolidation [5], but also have high variations in texture, size, and position. Those diversities raise a great demand for rich annotated datasets. Accordingly, large-scale well-labeled COVID-19 datasets are scarce, which limits the use of Artificial Intelligence (AI) to help fight against COVID-19. As reported in Table I, most of the public COVID-19 datasets focus on diagnosis which only have classification information, while only a few of them provide semantic segmentation labels. While research attempts [14]–[16] have been made to address the challenges, these works, nevertheless, still need annotated images for training purpose. In this paper, we present a label-free approach, requiring no lesion annotation.
TABLE I. A Summary of Public COVID-19 Datasets. The Quantity is Specific to the Cases of COVID-19.
| Dataset | Modality | Quantity | Task |
|---|---|---|---|
| COVID-CT [17] | CT image | 342 | Diagnosis |
| SIRM-COVID [18] | 2D CT image | 340 | Diagnosis |
| SIRM-Seg [18], [19] | CT image | 110 | Segmentation |
| Radiopedia [19], [20] | CT volume | 9 | Segmentation |
| Coronacase [21], [22] | CT volume | 20 | Segmentation |
| Mosmed [23] | CT volume | 50 | Diagnosis |
| BIMCV [24] | CT / X-rays | 5381 | Diagnosis |
| UESTC [15] | CT volume | 120 | Segmentation |
Although it is very difficult to build a large well-labeled COVID-19 dataset, collecting a large-scale normal CT volume dataset is much easier. It is also interesting to notice that the patterns of normal lungs are regular and easy to be modeled. The thorax of a normal person consists of large areas of air and a few tissues (such as tracheae and vessels [7]), which can be clearly distinguished by CT intensity [7]. As shown in Fig. 1(a), the air region is usually displayed as black background, with its Hounsfield unit (HU) value around -1000 [7]. Meanwhile, the tissue (with its HU > −500 [7]) has its intensity values similar to those of lesions, but it exhibits a regular pattern, which makes it amenable for modeling say by a deep network. This fact motivates us to formulate lesion segmentation as a voxel-level anomaly modeling problem.
Fig. 1.
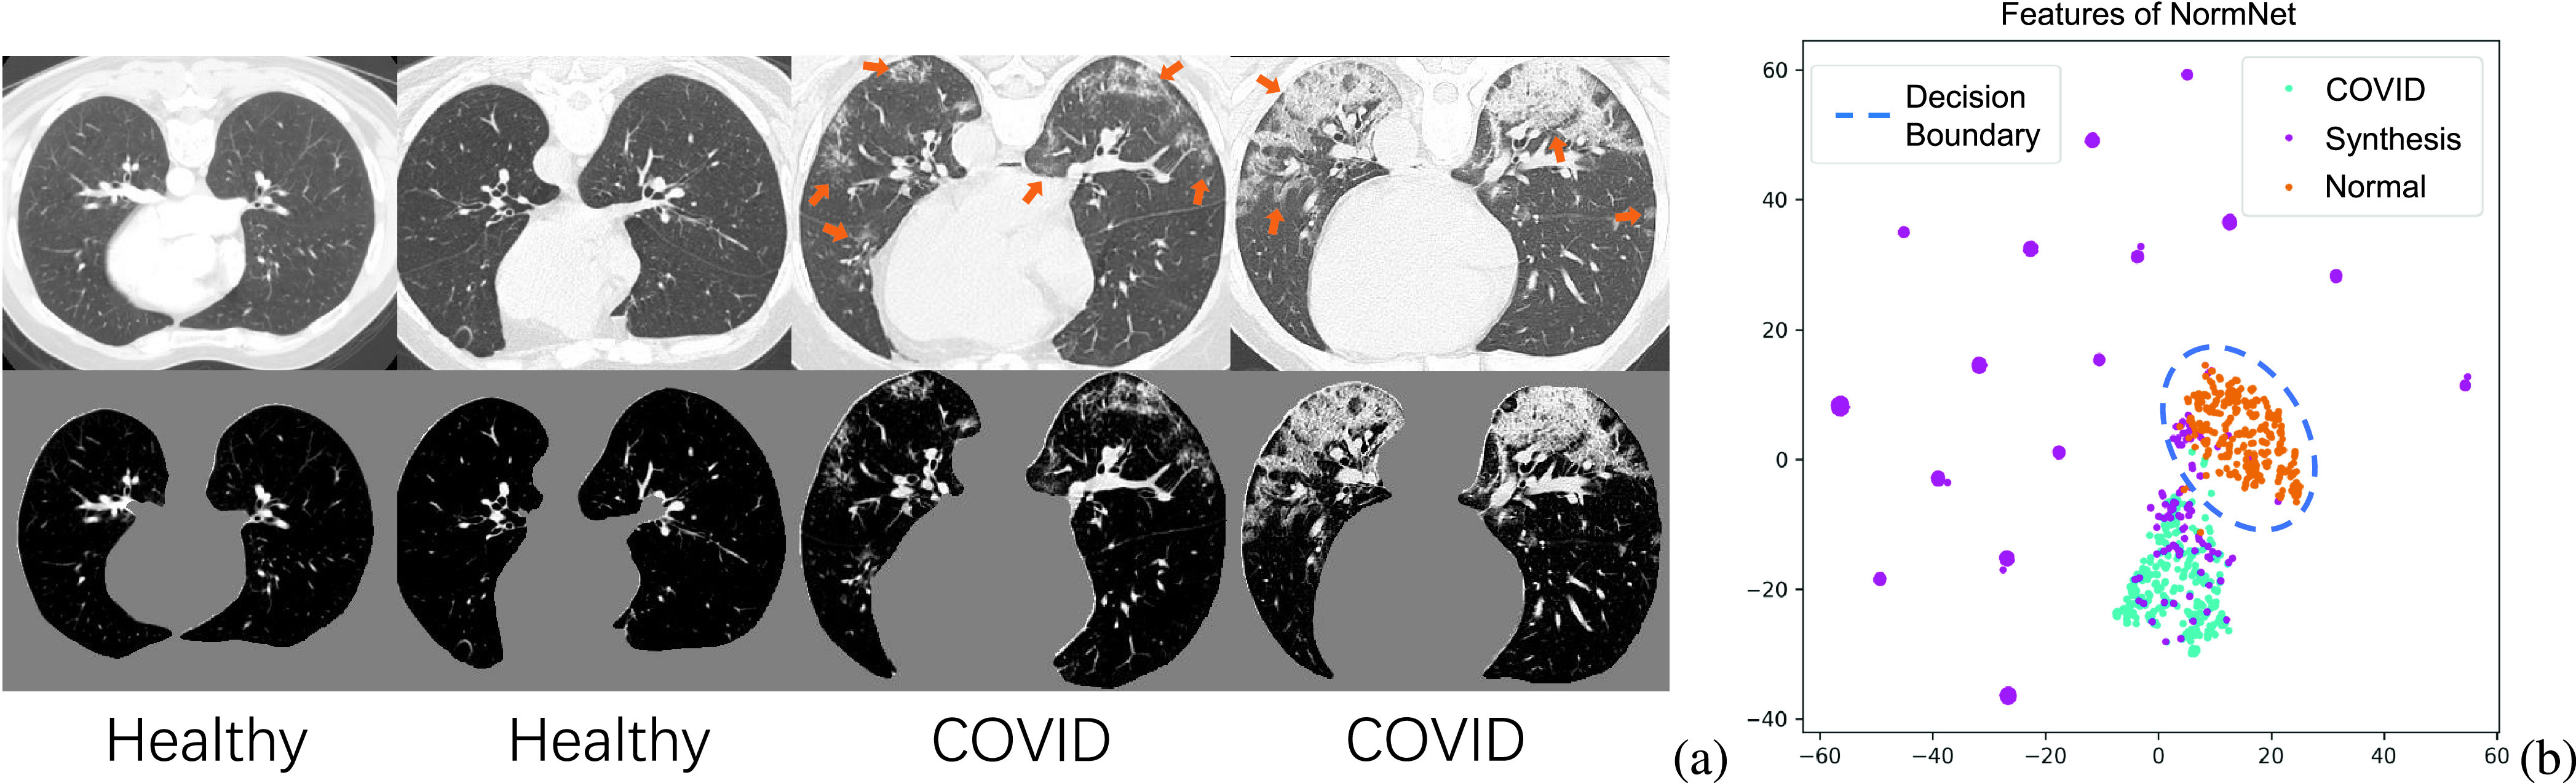
(a) Healthy and COVID-19 lung CT images (top) and its corresponding thorax area (bottom), clipped with an Hounsfield unit (HU) range of [−800, 100] and scaled to [0, 1]. (b) The visualization of 2D t-SNE of the features from the last layer of NormNet for COVID-19 lesions, synthetic ‘lesions’ and normal contexts. We build a rich synthetic ‘lesion’ library, which serves as a superset relative to the COVID-19 lesions. The NormNet learns a tight decision boundary between normal textures and the diverse ‘lesions’, which can further be used to segment COVID-19 lesions.
We hypothesize that if all the normal signals are captured at a voxel level, then the remaining abnormal voxels are localized automatically, which are grouped together as lesions. To facilitate voxel-level anomaly modeling, we design a novel proxy task. Firstly, we manually produce anomalies as synthetic ‘lesions’ and insert them into normal CT images, forming pairs of normal and ‘abnormal’ images for training. The ‘lesion’ synthesis procedure constitutes a few simple operations, such as random shape generation, random noise generation within the shape and traditional filtering. Then using these training pairs, we learn a deep image-to-image network that recognizes normal textures from synthetic anomalies images. The state-of-the-art 3D image segmentation model, 3D U-Net [25], is adopted as our deep network, which we call as a normalcy-recognizing network (NormNet).
In practice, we increase the difficulty of the proxy task by building a ‘lesion’ library as rich as possible, which serves as a superset relative to the COVID-19 lesions. To distinguish normal contexts from these various anomalies, the NormNet is learned to be highly sensitive to the normal contexts, resulting in a tight decision boundary around the distribution of normal tissues. Finally, as shown in Fig. 1(b), this boundary can also be used to segment COVID-19 lesions. We validate the effectiveness of NormNet on three different public datasets. Experimentally, it clearly outperforms various competing label-free approaches and its performances are even comparable to those of supervised method by some metrics.
It should be noted that our approach differs from a research line called unsupervised anomaly detection (UAD) [26]–[29], which aims to detect the out-of-distribution (OOD) data by memorizing and integrating anomaly-free training data and has been successfully applied in many instance-level holistic classification scenarios. Further, our method differs from those methods in the inpainting [30] task, whose images in both training and testing sets are contaminated by the masks (noises) from the same domain. Finally, our method is different from synthetic data augmentation [31], which manually generates lesions according to the features generated from labeled lesion area. In contrast, we do not need any image with labeled COVID-19 lesions.
In summary, we make the following contributions:
-
•
We propose the NormNet, a voxel-level anomaly modeling network, to distinguish healthy tissues from the COVID-19 lesion in the thorax area. This training procedure only needs a large-scale healthy CT lung dataset, without any labeled COVID-19 lesions.
-
•
We design an effective strategy for generating synthetic ‘lesions’ using only three simple operations: random shape, noise generation, and image filtering.
-
•
The experiments show that our NormNet achieves better performances than various competing label-free methods on three different COVID-19 datasets.
II. Related Work
A. COVID-19 Screening and Segmentation for Chest CT
Deep learning based methods for chest CT greatly help COVID-19 diagnosis and evaluation [2], [6]. Wang et al. [32] proposed a weakly-supervised framework for COVID-19 classification at the beginning of the pandemic, which achieved high performance. Wang et al. [33] exploited prior-attention residual learning for more discriminative COVID-19 diagnosis. Ouyang et al. [34] solved the imbalanced problem of COVID-19 diagnosis by a dual-sampling attention network. However, it is more difficult for the COVID-19 segmentation task due to the lack of well-labeled data [16], lesion diversities [5] and noisy labels [15]. Researchers have made attempts to address the above challenges. For example, to tackle the problem of labeled data scarcity, Ma et al. [22] annotated 20 CT volumes from coronacases [21] and radiopedia [20]. Fan et al. [16] proposed a semi-supervised framework called Inf-Net. Zhou et al. [14] solved the same issue by fitting the dynamic change of real patients’ data measured at different time points. However, all of these models depended on data with semantic labels. In this work, we propose an unsupervised anomaly modeling method called NormNet, which achieves comparable performances, but with no need of labeled data.
B. Anomaly Detection
Anomaly detection or outlier detection is a lasting yet active research area in machine learning [35]–[37], which is a key technique to overcome the data bottleneck [38]. A natural choice for handling this problem is one-class classification methods, such as OC-SVM [39], SVDD [40], Deep SVDD [41] and 1-NN. These methods detect anomaly by clustering a discriminate hyper-lane surrounding the normal samples in the embedding space.
In medical image analysis, there was another line of research which successfully detected anomaly in instance-level by finding the abnormal area [42]. Recently, CNN-based generative models such as Generative Adversarial Networks (GAN) [43], and Variational Auto-encoders (VAE) [44] have been proved essential for unsupervised anomaly segmentation [45]. These methods first captured the normal distribution by learning a mapping between the normal data and a low-dimensional latent space by reconstruction loss. They assumed that if this process is only trained with normal distributions, a lesion area with abnormal shape and context can not be correctly mapped and reconstructed, resulting in high reconstruction error, which helped to localize the lesion area. The f-AnoGAN method [46] learned the projection by solving an optimization problem, while VAE [44] tackled the same problem by penalizing the evidence lower bound (ELBO). Several extensions such as context encoder [47], constrained VAE [48], adversarial autoencoder [48], GMVAE [49], Bayesian VAE [50] and anoVAEGAN [51] improved the accuracy of the projection. Based on the pretrained projection, You et al. [49] restored the lesion area by involving an optimization on the latent manifold, while Zimmerer et al. [38] located the anomaly with a term derived from the Kullback-Leibler (KL)-divergence.
Different from classification, lesion segmentation usually depends on locally fine-grained texture information. Unluckily, the decoder may loose some detailed texture information [52], which limited the accuracy of the reconstruction and caused false-positives. To make matters worse, as shown in Fig. 1(a), healthy textures in Lung CT are fine-grained and need a more precise reconstruction. On the other hand, the calibrated likelihood of the decoder may not be precise enough [53]. The out-of-distribution data had some possibilities to be successfully reconstructed [54], which raised false-negatives.
NormNet is designed to alleviate such issues by modeling the normal tiussue at a voxel level. Specifically, we propose a proxy task of separating healthy tissues from diverse synthetic anomalies. Firstly, we choose a 3D U-Net [25] as backbone, which uses the skip connection to alleviate the loss of information. Next, we make the appearance of synthetic ‘lesions’ as diverse as possible to encourage our NormNet to be highly sensitive to normal textures. As a consequence, a tight decision boundary around normal tissues can be used to recognize healthy tissues and to segment COVID-19 lesions.
III. Method
In this section, we firstly introduce the overall framework of our NormNet. Then we illustrate how to generate diverse ‘lesions’ in the given lung mask. Finally, we clarify how to post-process the healthy voxels predicted by our NormNet to obtain the final lesion mask for an unseen test image.
A. Overall Framework
Let
 be a set of
 healthy lung CT images. We clip the raw image
 with an HU range of [−800, 100] and scale the clipped image to [0, 1], obtaining
 . As shown in Fig. 2, our method firstly use nnUnet [55] to obtain the lung masks
 and the thorax areas
 with
with
 , where
 stands for voxel-wise multiplication. It is worth noting that because no segmentation model can achieve 100% accuracy, and there are always some edges caused by segmentation errors left in the thorax area
 , we introduce a simple pre-processing step (in Section III-B) to remove erroneous edges and generate a new lung mask
 . Finally the thorax areas are updated to
 with
with
 .
.
Fig. 2.
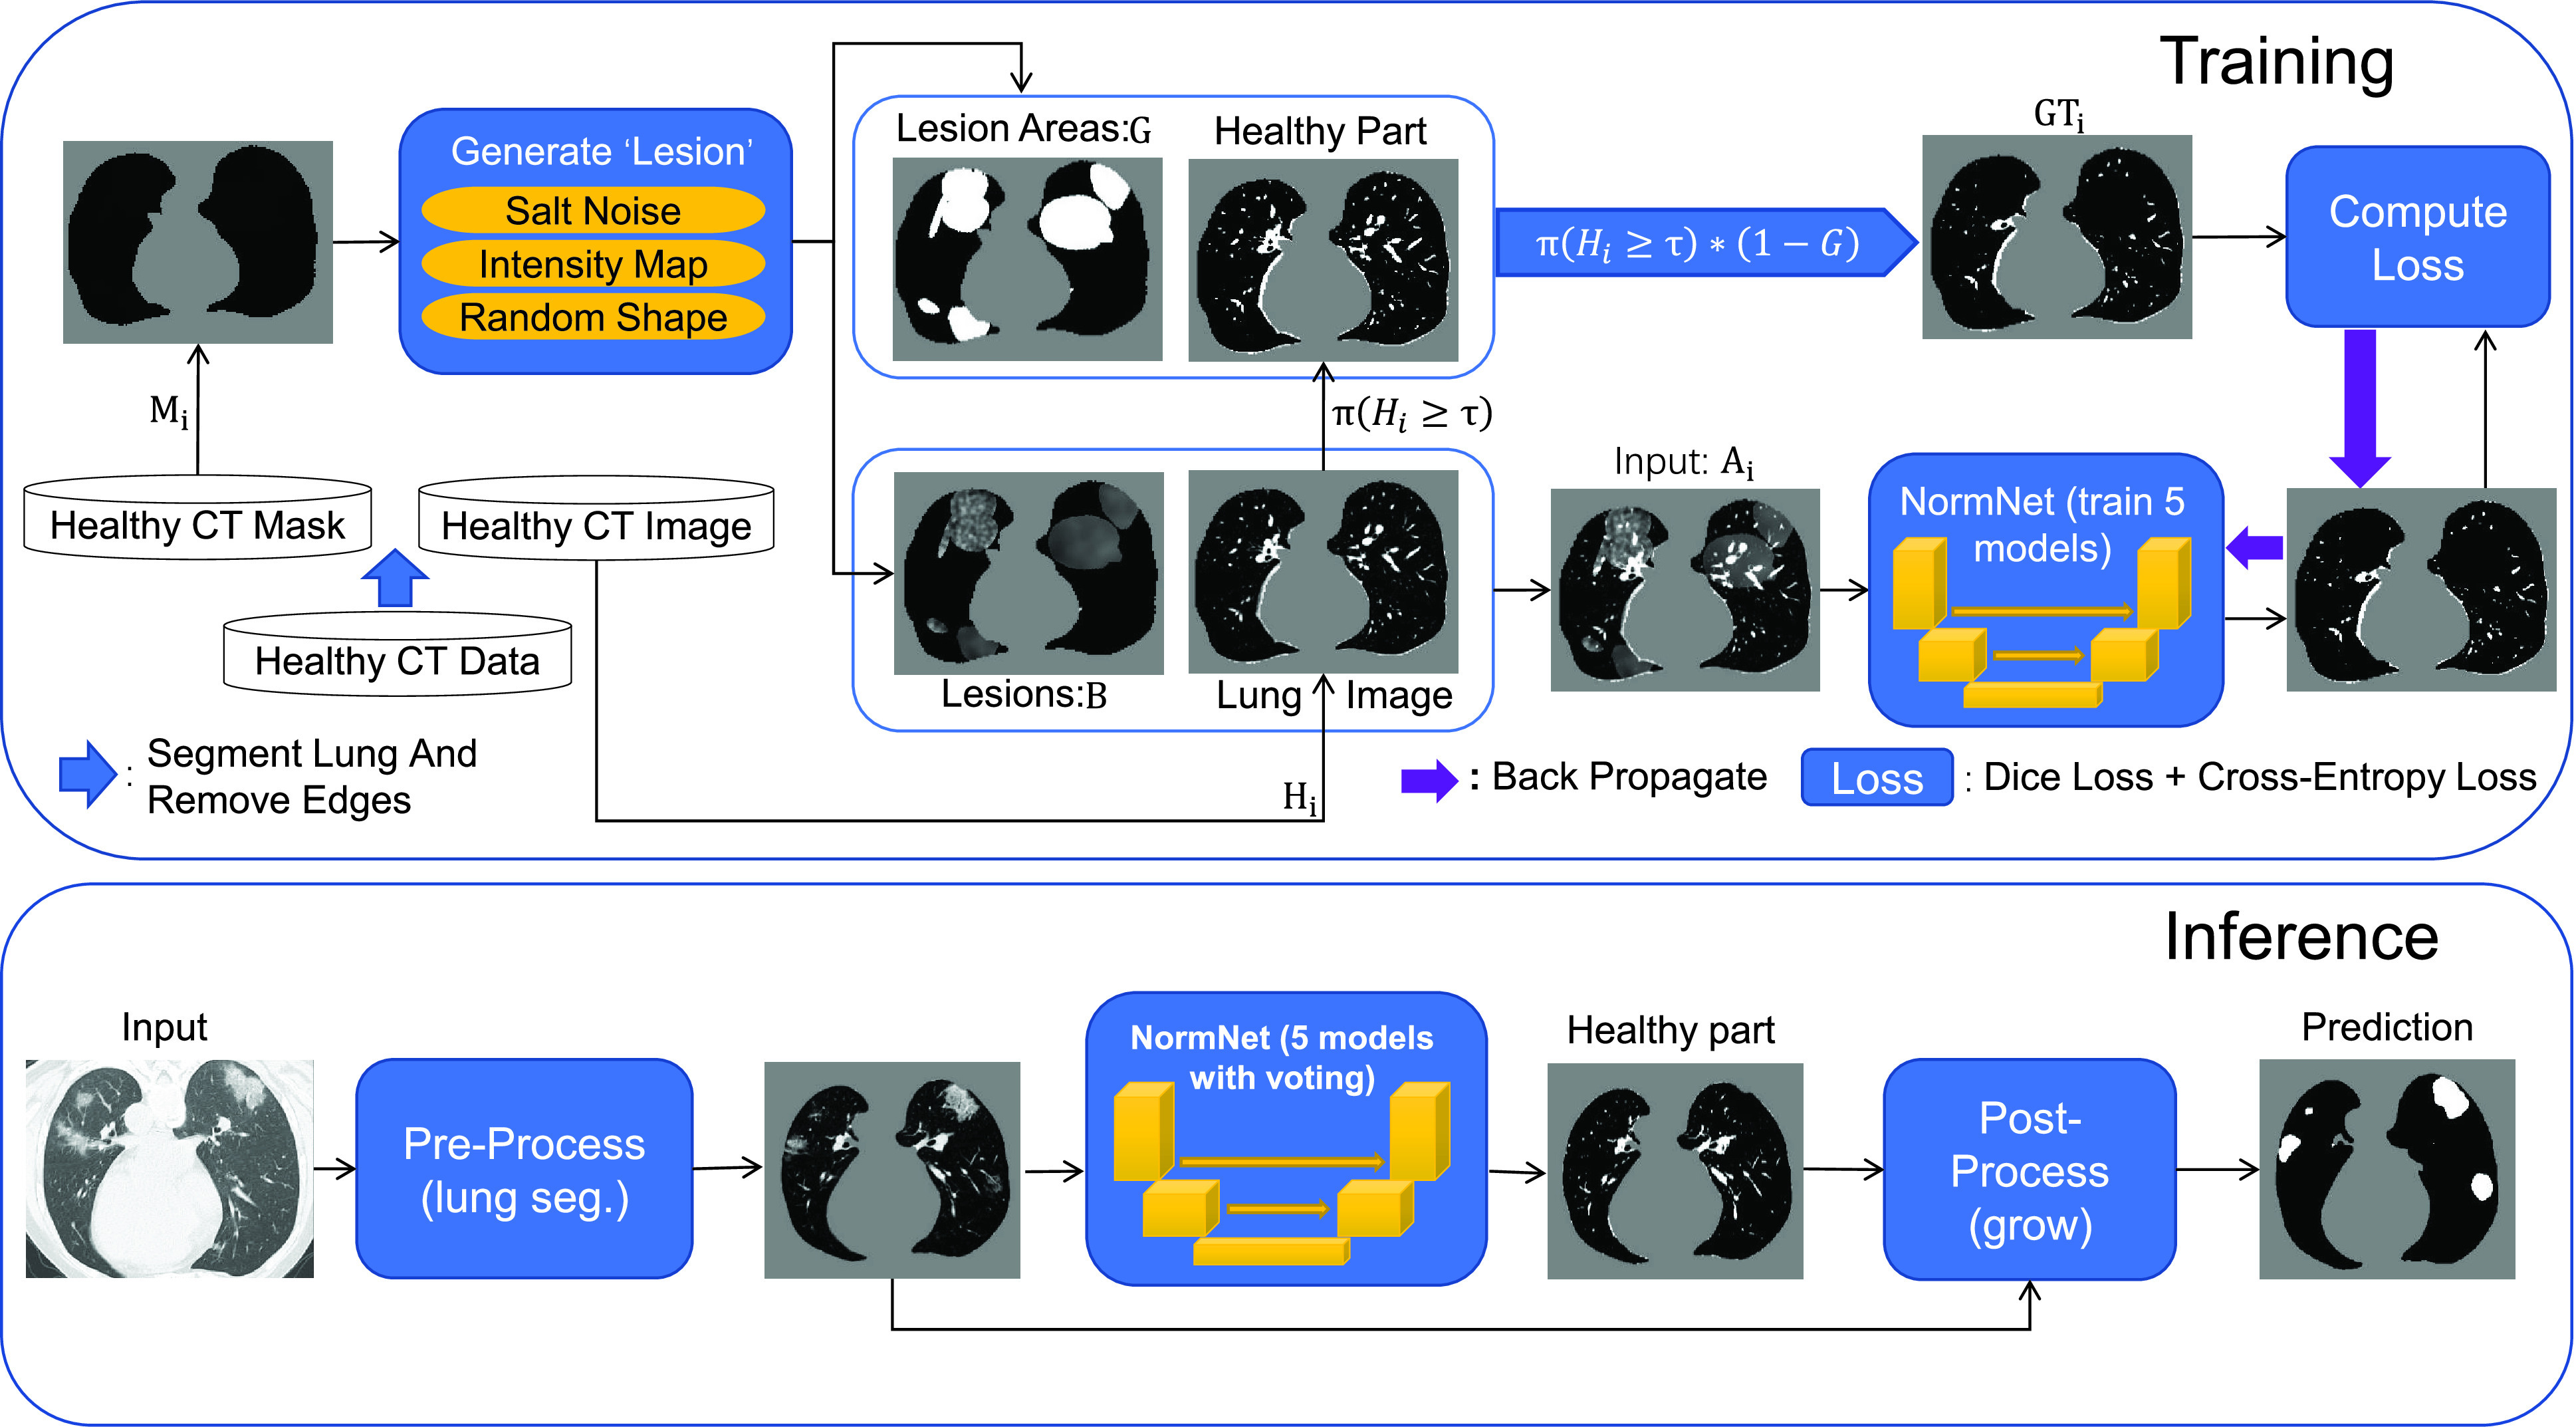
The overall framework of proposed NormNet. We first insert random noises (fake ‘lesions’)
 to the healthy lung area
 . Then we train the NormNet to segment the healthy tissues in the healthy area
 and high intensity range (
 ). In the inference time, the NormNet segment healthy tissues precisely and treat the remaining COVID-19 lesions as anomalies.
Then we use the synthetic ‘lesion’ generator described in Section III-C to synthesize various ‘lesions’
 within the lung masks
 with diverse shapes
 and textures, and inject them into the thorax area
 to form the input
 . Because the healthy voxels in the high-intensity range (say HU
 with the threshold
 ) have regular patterns and meaningful clinical content (tracheae and vessels [7]), we concentrate on segmenting normal patterns within high intensity range and normal areas. Accordingly, we compute ground truth as
 |
where
 is an indicator function that produces a binary mask. Note that the value of
 in
in
 is equivalent to the HU threshold; for example,
 means
means
 . Our NormNet is learned to predict the healthy part from
 via encouraging it to be close to
 (aka minimizing Dice loss and cross-entropy loss). In this procedure, our NormNet learns to capture the context of healthy tissues quickly and precisely.
When our NormNet is applied to an unseen COVID-19 CT volume, it recognizes the healthy part of the volume with a high confidence and the lesion part of the volume with a low confidence. The confidence scores thus can be used as a decision boundary to predict the healthy parts and lesions. Because our training process is random, we form an ensemble by learning five random models under the same setting. A majority-vote for healthy parts is conducted as the final prediction.
At last, we design a post-processing procedure in Section III-D to obtain the final prediction. As NormNet is trained to segment the voxels with HU
 , a small number of lesion voxels whose HU
 are not taken into consideration and might get missed. So, we grow the localized lesion areas (in high-intensity range) to bring them back.
B. Removing Erroneous Edges
As mentioned above, this step is to separate the wrong edges caused by segmentation errors from lung mask
 . For a pair of inputs
 , we select all the connected areas [56] in thorax area
 with most of the voxels lying on the edges of the lung segmentation mask
 , and mark them as the wrong edges
 . To avoid injecting noise into those edges, we use the lung mask without those edges, formulated as
 . Note that we only launch this process in the training phase, leveraging the fact that no lesion occurs inside a healthy volume.
C. Synthetic ‘Lesion’ Generator
As shown in Fig. 3, the generator constitutes a set of simple operations, following the two steps: (i) generating lesion-like shapes; (ii) generating lesion-like textures. It is worth noting that all of the parameters are chosen for one purpose: generate diverse anomalies evenly. The visualization of each step can be found in Supplementary Material. Below, we elaborate each step.
Fig. 3.
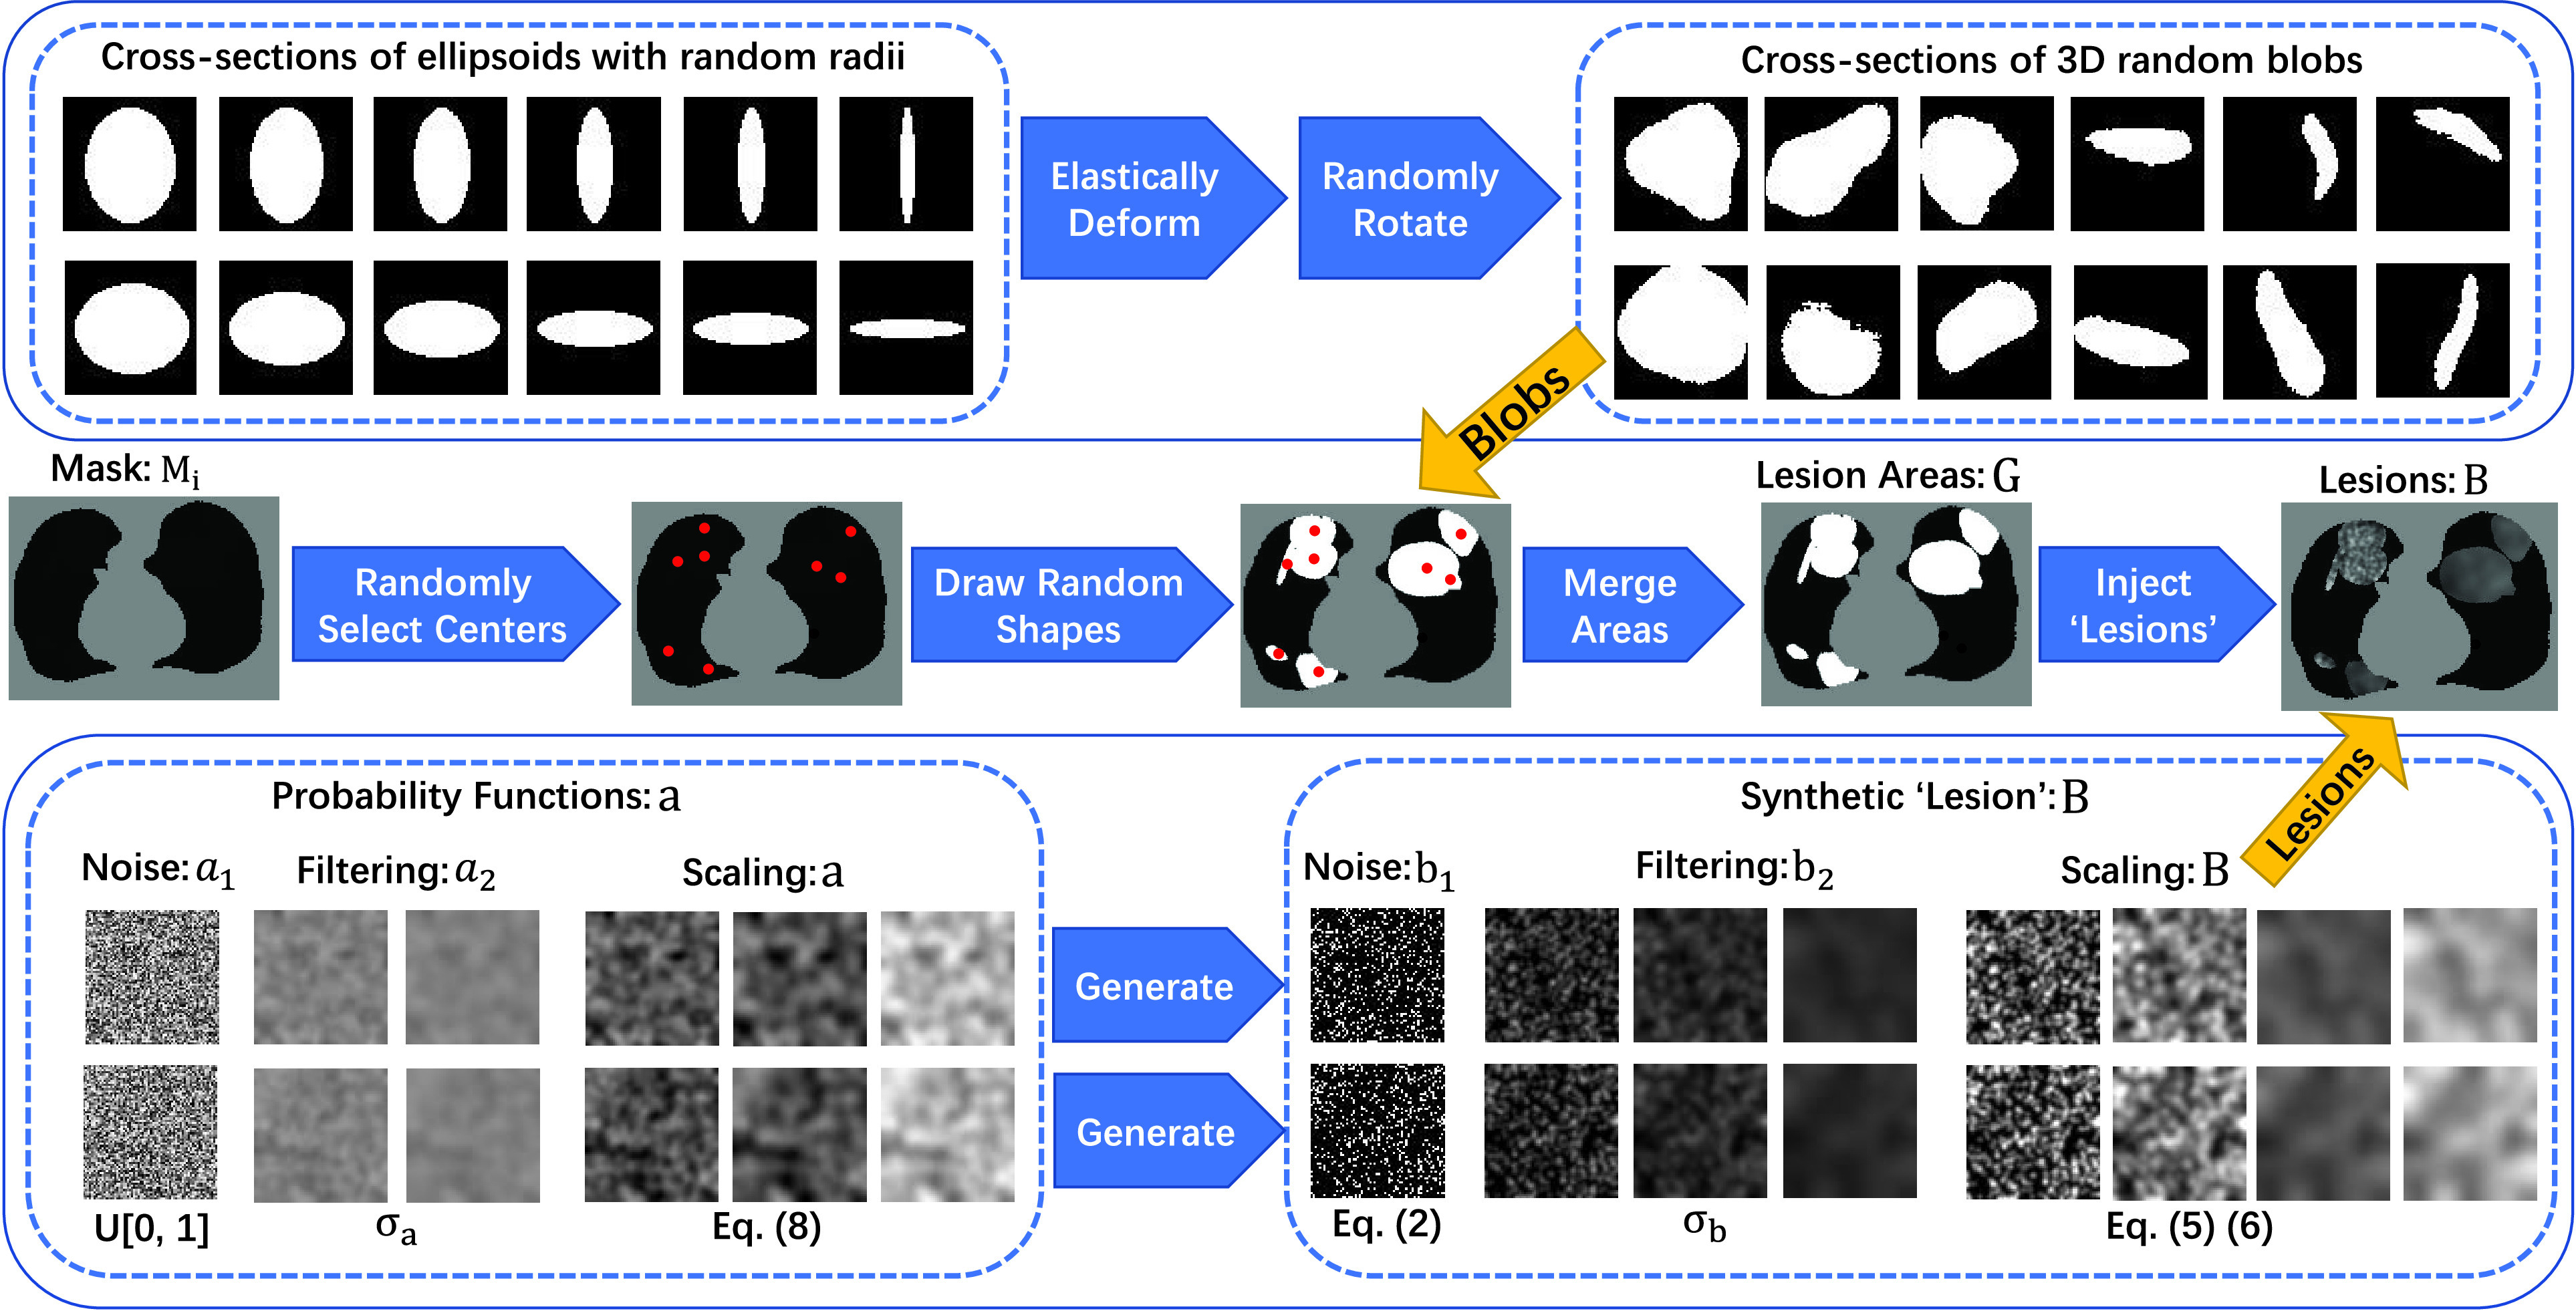
The schematic diagram of the proposed noise generator. We generate several diverse shapes and fill the connected areas with various filtered and scaled salt noises.
1). Generating Lesion-Like Shapes:
Multiple COVID-19 lesions may exist in a CT scan and they have various shapes. To obtain multiple lesion-like shapes with a CT, we propose the following pipeline. Below,
 denotes a continuous uniform distribution within the range
 , while
 denotes a discrete uniform distribution.
-
•
For each lung mask
 with a shape of size [32, 512, 512], compute a factor
 to make sure that smaller masks generate fewer ellipsoids, where
 is the biggest mask in training set.
 -
•
Create several ellipsoids as follows: (1) Sample a number
 and then generate
 small-size ellipsoids with the principal semi-axes of each ellipsoid randomly selected from
 ; (2) Sample a number
 and then generate
 medium-size ellipsoids with the principal semi-axes of each ellipsoid randomly selected from
 ; and (3) Generate a large size ellipsoid with a probability of
 and with its principal semi-axes
 .
. -
•
For each generated ellipsoid, deform it using elastic transformation [57] with random parameters and rotate it to align with random axes, yielding a blob
 . Then position this blob at a random center inside the lung
 .
.
At this stage, we have a set of blobs
 . Then we merge connected blobs and obtain several non-adjacent blobs
 with varying shapes. For each blob
 , we synthesize a patch of ‘lesion’
 by the following steps.
2). Generating Lesion-Like Textures:
The texture pattern of lesions varies1.; thus it is challenging to generate lesion-like textures. Below we outline our attempt of doing so using a set of simple operations. It should be noted that our method still has room for optimization, but it is already empirically effective.
We follow a series of three steps, namely noise generation, filtering [58], and scaling/clipping operations, to generate the lesion-like textures.
-
•Noise generation. For each voxel denoted by
 , generate salt noise

where the voxel-dependent probability function
 will be defined later.
 -
•Filtering [58]. Filter the noise image
 to obtain
 using a Gaussian filter
 with a standard deviation
 .
.
where
 is the standard image filtering operator. The standard deviation
 is randomly sampled as follows:
-
•Scaling and clipping. This yields the lesion-like pattern
 .
.
with
 being the scaling factor that is obtained by
where
 and
and
 is the mean intensity of the image
 that passes the threshold
 .
.
Now, we describe how to obtain the voxel-dependent probability function
 , again using a series of noise generation, filtering [58], and scaling operations.
-
•
Noise generation. For each voxel
 , independently sample the uniform probability
 to get a noise image
 .
. -
•Filtering. Filter the noise image
 to obtain
 using a Gaussian filter
 with a standard deviation
 .
.
where the standard deviation
 .
. -
•Scaling. This yields the desired function
 .
.
where
 ,
,
 and
and
 .
.
Finally, we inject the synthetic lesions
 into the various blobs
 , and place these blobs at random centers inside the lung area
 . Mathematically, the image
 with synthetic ‘lesions’ is generated by finding the maximum value of the lung area
 and the synthetic lesions
 at each voxel point:
 |
Our goal is to learn a network that takes
 as input and outputs
 .
.
D. Post Processing
A post processing procedure is designed to obtain the final lesion prediction based on difference between the original CT volume and predicted healthy areas. As illustrated in Fig. 4, the final prediction is obtained with the following steps:
-
•
Compute the lung mask (Fig. 4(b)) and predict the healthy part by NormNet (Fig. 4(c));
-
•
Compute the lesion region by subtracting the predicted healthy part from lung mask to get Fig. 4(d). Considering that only bright voxels
 are in the lung mask, the full-voxel raw lesion areas (Fig. 4(f)) is calculated, aiming to ‘recover’ less bright lesions;
 -
•
Mean filtering
 with kernel size
 is then applied to Figs. 4(d) and 4(f) to smooth the lesion region (with kernel sizes of
 and
and
 ) and then to remove the background noise via thresholding (with thresholds of
 and
and
 ), which yields the results in Fig. 4(e) and 4(g), respectively;
 -
•Binary dilation [59] is used to grow the lesion regions of Fig. 4(e) to bring the missing voxels in the low intensity range (HU < T) back. Then, we remove the voxels out of the full lesion regions defined by Fig. 4(g) to prevent over-growing.
where
 is the prediction in Fig. 4;
 is Fig. 4(e), and
 is Fig. 4(g).
Fig. 4.

The illustration of the post-processing process.This step removes the healthy part from the COVID-19 CT volume and generate final prediction by mean filtering and growing.
IV. Experiments
Below we firstly provide a brief description of the various CT lung datasets used in our experiments. Then we present our experimental settings and the baseline approaches we implement and compare. Finally, we show our main experimental results, hyper-parameter analyses and an ablation study.
A. Datasets
One distinguishing feature of the paper lies in unleashing the power embedded in existing datasets. Rather than using a single dataset, we seamlessly integrate multiple CT lung datasets for three different tasks of healthy lung modeling, COVID-19 lesion segmentation, and general-purpose lung segmentation into one working solution.
1). CT Datasets for Healthy Lung Modeling:
LUNA16 [60] is a grand-challenge on lung nodule analysis. The images are collected from The Lung Image Database Consortium image collection (LIDC-IDRI) [61], [62], [64], and each image is labeled by 4 experienced radiologists. As half of the images are healthy and clean except for those containing nodule areas, we select 453 CT volumes from LUNA16 and remove the slices with nodules to formulate our healthy lung CT dataset.
2). CT Datasets for COVID-19 Lesion Segmentation:
To measure the performance of our methods towards COVID-19 segmentation, we choose two public COVID-19 CT segmentation datasets in Table I and one UESTC with semantic labels. It is worth noting that our method segments the COVID-19 lesions under the unsupervised setting, and thus the labeled datasets are only used for testing.
-
•
Coronacases: There are 10 public CT volumes in the [21] uploaded from the patients diagnosed with COVID-19. These volumes are firstly delineated by junior annotators,2 and then refined by two radiologists with 5 years experience, and finally, all the annotations are verified and refined by a senior radiologist with more than 10 years experience in chest radiology diagnosis [22].
-
•
Radiopedia: Another 8 axial volumetric CTs are released from Radiopaedia [20] and have been evaluated by a radiologist as positive with voxel-wise labeling on lesion regions [19].
-
•
UESTC: A large-scale well labeled datasets [63] containing 120 CT volumes, of which 50 are labeled by experts and 70 by non-experts.
3). CT Datasets for General Purpose Lung Segmentation:
To obtain the accurate lung area in the CT volume, we choose nnU-Net [55] as our lung segmentation method, which is proved to be state-of-the-art segmentation framework in medical imaging analysis. We use three lung CT datasets with semantic labels for the lung region:
-
•
NSCLC left and right lung segmentation: This dataset consists of lung volume segmentation collected on 402 CT scans from The Cancer Imaging Archive NSCLC Radiomics [64]–[66].
-
•
StructSeg lung organ segmentation: This dataset consists of 50 lung cancer patient CT scans with lung organ segmentation. The dataset served as a segmentation challenge during MICCAI 2019 [67].
-
•
MSD Lung tumor segmentation This dataset consists of 63 labelled CT scans, which served as a segmentation challenge during MICCAI 2018 [68]. The lung regions are labeled by Ma et al. [22].
We choose 2D U-Net as the backbone. The model is trained by nnU-Net [55] in 5-fold cross-validation, which segments the lung region very precisely with Dice scores larger than 0.98 in both Coronacases and Radiopedia datasets.
B. Experimental Settings
1). Evaluation Metrics:
We use several metrics widely used to measure the performance of segmentation models in medical imaging analysis, including precision score (PSC), sensitivity (SEN) and Dice coefficient (DSC), which are formulated as follows:
 |
where
 ,
,
 and
and
 refer to the true positive, false positive and false negative respectively.
2). Pre-Processing:
All of the images in the training and testing sets are segmented for the lung region at first. Then we unify their spacing to
 1
1
 , as well as orientation. Next, all of the images are clipped with window range [−800, 100] and normalized to [0, 1]. Finally, the lung regions are centralized and padded to
 with 0.
3). Training and Inference Details:
We choose 3D U-Net [25] as backbone for NormNet, implemented by MONAI [69]. As all of the volumes in both training and testing phases are well aligned, no more augmentation is needed. The NormNet is trained on a TITAN RTX GPU and optimized by the Adam optimizer [70] with default settings. We train our network for 2000 iterations with a batch size of 8, and set the learning rate to 3e-4. For the testing phase, as the contexts of healthy signals are precisely captured by our NormNet, these signals are predicted with high probability. Therefore, we select those voxels with probability > 0.95 as healthy parts in the COVID-19 CT volume. For the mean filtering in the post processing, we set kernel sizes (
 ) to (9, 7) and thresholds (
 ) to (0.2, 0.15) 3 for lesion parts with bright voxels (Fig. 4d) and full voxels (Fig. 4f), respectively. We obtain these values according to the hyperparameter search, which are fixed to all of three COVID-19 datasets.
C. Baselines
We compare our methods with existing deep learning based methods4. in medical imaging analysis for unsupervised anomaly detection (UAD) methods to evaluate the effectiveness of our approach. To eliminate the influence of irrelevant factors, we use the images with only lung regions as training and testing sets for all of the experiments (except for VAE Original). These encoder-decoder based methods are trained with a learning rate of 3e-4 and a batch size of 16 for 6000 iterations. To obtain the best performance for each method, we perform a greedy search up to two decimals to get the threshold with best Dice score for each COVID-19 dataset.
-
•
AE: An Autoencoder with a dense bottleneck to learn a mapping between latent space
 and input space
 , which assumes that only normal input can be successfully reconstructed.
 -
•
VAE [44]: Different to AE, VAE use KL-divergence and resampling to constrain the latent space. As the reconstruction is more difficult for lung CT images, so we set
 for KL loss as 1e-6.
 -
•
VAE Spatial [51]: A VAE with a spatial (fully-convolutional) bottleneck, which learns a mapping between latent space
 and
and
 .
. -
•
VAE Original: A VAE trained with the full lung CT images, instead of lung regions (after lung segmentation).
-
•
Context VAE [47]: An expansion of VAE, which forces the encoder of VAE to capture more information by reconstructing a input image with cropped patches.
-
•
Constrained VAE [48]: An expansion of VAE, which uses the encoder to map the reconstructed image to the same point as the input in the latent space.
-
•
GMVAE [49]: An expansion of VAE, which replaces the mono-modal prior of the VAE with a Gaussian mixture.
-
•
Bayesian VAE [50]: An expansion of VAE, which aggregates a consensus reconstruction by Monte-Carlo dropout.
-
•
KL Grad [38]: Use the gradient map derived from KL loss to segment anomalies.
-
•
VAE restoration [49]: Restore the abnormal input to decrease the evidence lower bound (ELBO). The restoration part is marked as the detected abnormal area.
-
•
f-AnoGAN [45]: Different from VAE, f-AnoGAN learns such a mapping by solving an optimization problem. To keep the training process of f-Anogan stable, we resize the lung image to [64, 64] after center crop.
In order to reveal the top-line for each dataset, we train nnU-Net [55] in 5-fold cross-validation.5 Furthermore, to test the performance of the supervised model when inferring unseen datasets, we train nnU-Net on two COVID-19 datasets and test on the remaining one, called nnU-Net-Unseen. At last, we test the pretrained models6 of two (semi-)supervised methods of COPLE-Net [15] and Inf-Net [16] on the same datasets.
D. Segmentation Results
As shown in Fig. 6, NormNet is much more sensitive to the contexts of healthy voxels than possible anomalies (COVID-19 lesions our work). To validate the ability of our NormNet to recognize healthy voxels from anomalies, we collect all bright voxels with
 of the CT volumes. As in Table II, our method successfully recognizes healthy voxels from the COVID-19 lesion voxels with AUC larger than 85%. The high specificity ensures that most of the lesions are treated as anomaly. Our NormNet firstly votes for the healthy tissues from the CT volumes with COVID-19 lesions. Then, the post-processing procedure grows the lesion area to contain more lesions with less bright voxels (
 ). We also use mean filtering in the post-processing to remove the isolated healthy voxels that are segmented as anomaly, as shown in Fig. 5c.
Fig. 6.

The heatmap from the first down-sampling block of the NormNet. The NormNet captures the contexts of healthy tissues precisely.
TABLE II. The Results of Segmentation Performances of Bright Voxels.
| Dataset | Precision | Sensitivity | Specificity | AUC |
|---|---|---|---|---|
| Coronacases | 90.5 | 78.6 | 81.2 | 87.0 |
| Radiopedia | 93.1 | 70.9 | 86.9 | 89.7 |
| UESTC | 92.1 | 77.6 | 84.7 | 88.4 |
Fig. 5.
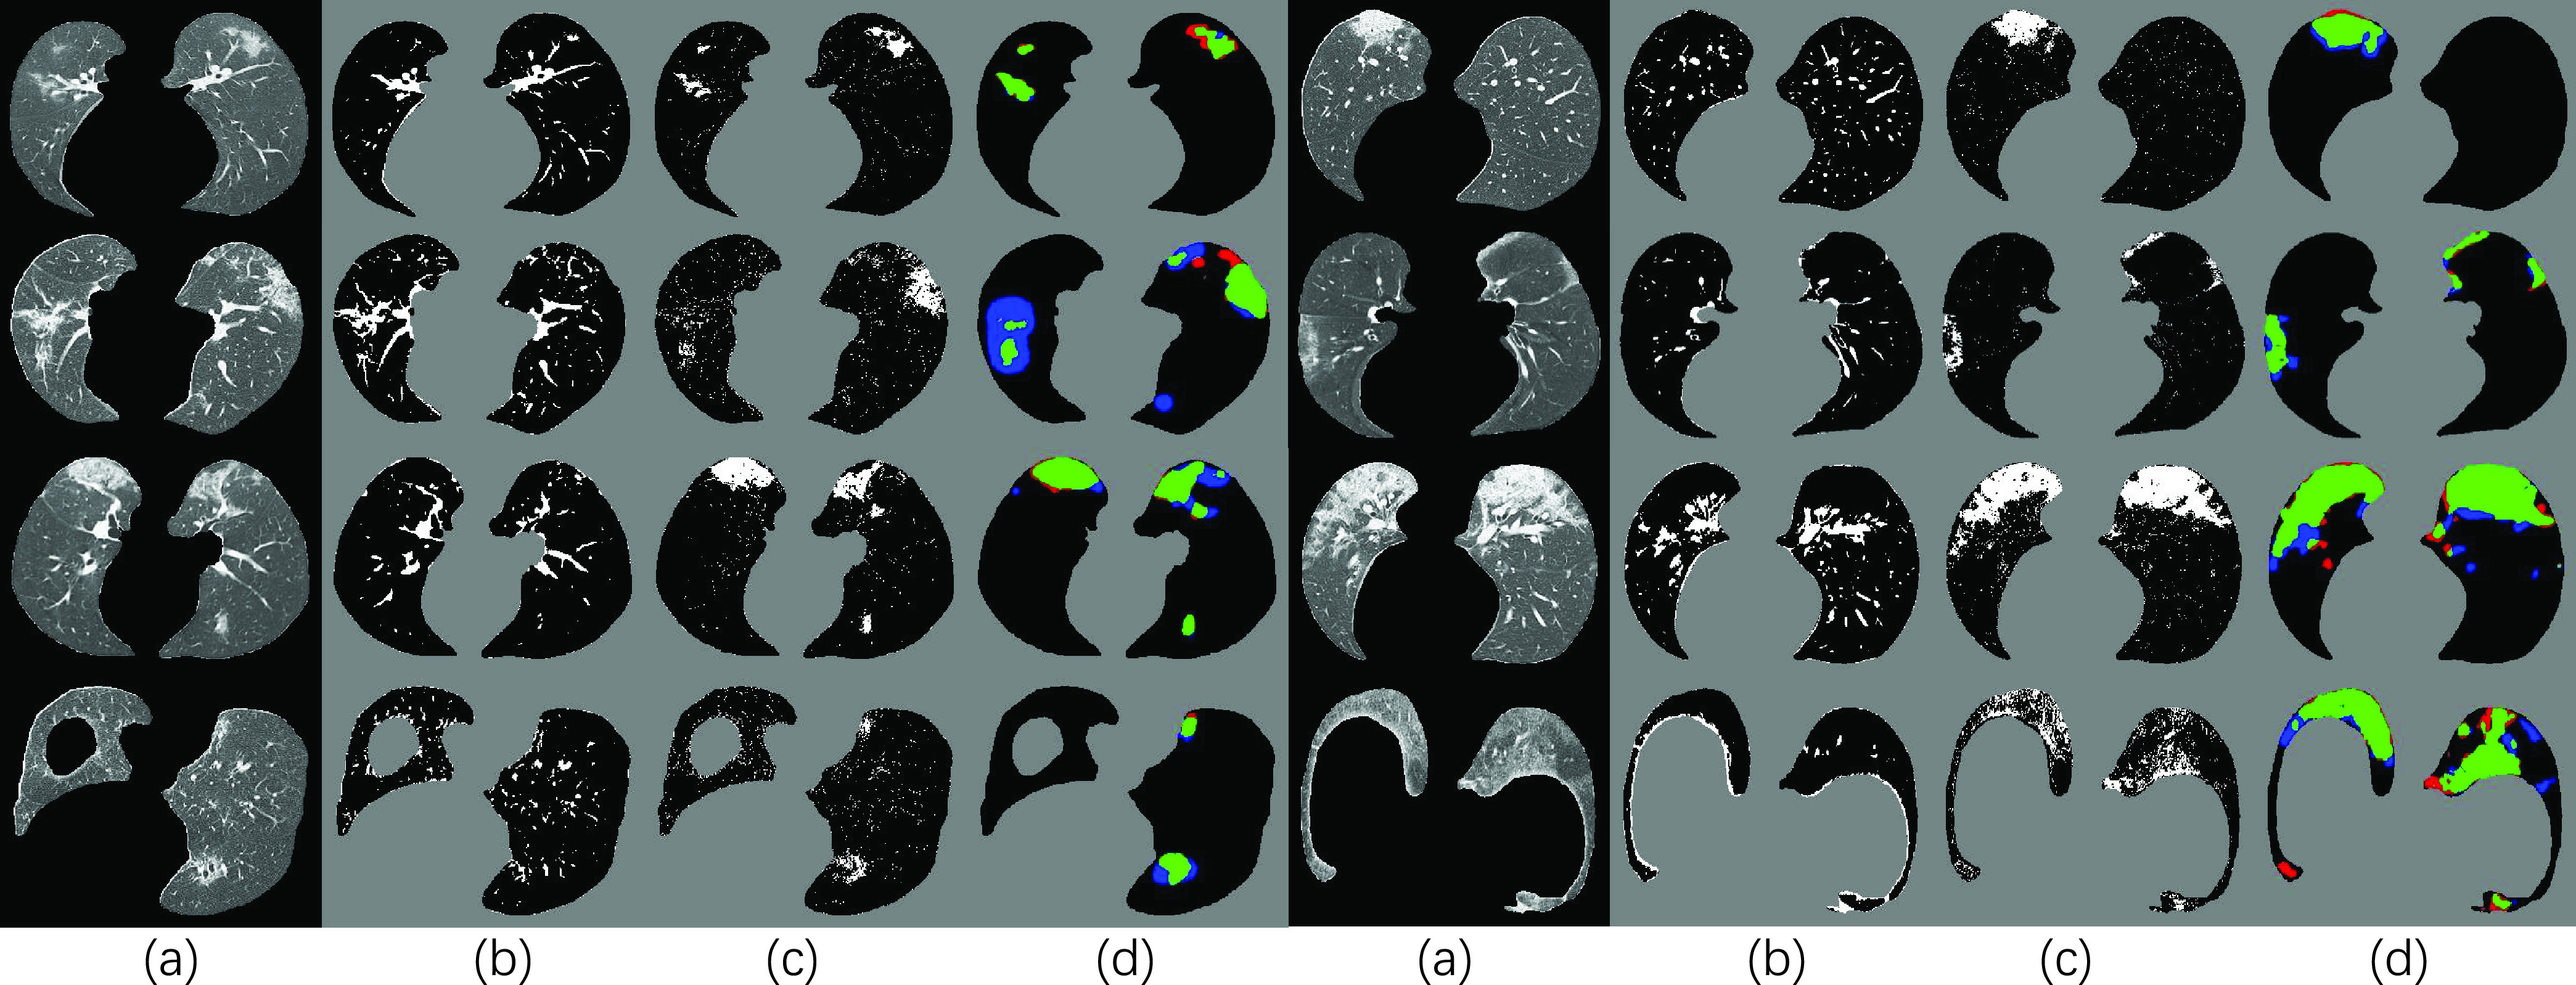
Visual results of our NormNet for COVID-19 segmentation. (a), (b), (c) and (d) represents input (after lung segmentation), healthy tissues (predicted from our NormNet), lesion parts, and final segmentation, respectively. The green, blue, and red areas in (d) refer to true positive, false negative, and false positive, respectively.
Therefore, our method reaches the Dice scores of 69.8%, 59.3%7 and 61.4%8 (shown in Table III) in the three different COVID-19 datasets respectively. The visual results shown in Fig. 5 reveal that most of the COVID-19 lesions are successfully (green area) segmented by our NormNet. Furthermore, without the expensive annotations, our NormNet achieves competitive performances on the three public datasets against these (semi-)supervised models. The performance of Inf-Net [16], which is overall similar to that of our NormNet, is rather stable across the three datasets as it is trained based on a different dataset. However, on the largest dataset (UESTC), NormNet still has performance gaps (the Dice scores of 10.2%, 17.4% and 20.2%), compared to the supervised methods. Specifically NormNet has precision gaps on Radiopedia (18.7%) and UESTC (21.7%), as well as sensitivity gaps on Coronacases (16.1%) and Radiopedia (14.9%).
TABLE III. The Quantitative Results of Our Method Compared to Other UAD Methods and nnU-Net. For Each Column, the
 , Second and Third Values are Highlighted.
| Methods | Coronacases | Radiopedia | UESTC | ||||||
|---|---|---|---|---|---|---|---|---|---|
| DSC (%) | PSC (%) | SEN (%) | DSC (%) | PSC (%) | SEN (%) | DSC (%) | PSC (%) | SEN (%) | |
| nnU-Net [55] | 80.1±6.73 | 80.2±12.4 | 82.3±9.30 | 76.7±5.81 | 77.1±14.0 | 80.5±13.1 | 81.6±9.43 | 83.0±11.7 | 81.7±11.6 |
| nnU-Net-Unseen | 78.1±12.0 | 79.0±13.6 | 78.9±13.5 | 68.0±19.8 | 60.9±22.9 | 87.6±9.72 | 79.3±8.19 | 82.8±12.8 | 77.6±8.71 |
| COPLE-Net [15] | 68.2±10.8 | 77.3±9.57 | 63.4±16.9 | 59.3±17.7 | 57.9±16.0 | 63.3±23.0 | 83.9±9.47 | 84.8±10.5 | 84.6±12.0 |
| Inf-Net [16] | 66.9±14.0 | 74.5±15.6 | 63.3±16.5 | 67.8±13.3 | 65.2±17.1 | 75.9±13.4 | 63.9±11.8 | 70.4±17.9 | 62.2±12.8 |
| AE | 28.3±15.5 | 21.5±15.3 | 52.1±11.3 | 30.3±17.7 | 24.4±19.0 | 58.9±6.2 | 21.1±22.5 | 21.9±25.7 | 44.0±11.1 |
| VAE [44] | 26.4±14.5 | 19.8±14.0 | 50.1±9.8 | 28.1±17.5 | 21.6±17.6 | 62.3±5.7 | 21.3±20.4 | 16.7±20.1 | 44.6±11.7 |
| VAE Spatial [51] | 27.4±16.5 | 21.0±16.4 | 49.9±11.9 | 30.7±19.8 | 24.8±20.7 | 59.2±8.0 | 25.4±22.2 | 18.3±26.4 | 42.7±13.5 |
| VAE Original | 10.9±8.0 | 6.9±6.1 | 41.3±8.2 | 12.3±10.5 | 8.5±8.9 | 44.9±4.9 | 10.2±10.4 | 5.2±11.6 | 31.9±4.7 |
| Context VAE [47] | 29.7±16.0 | 21.8±15.6 | 61.0±9.8 | 32.3±21.3 | 24.3±20.6 | 72.2±6.0 | 27.2±26.7 | 19.2±25.8 | 52.2±9.4 |
| Constrained VAE [48] | 27.9±14.8 | 21.0±14.7 | 53.2±10.5 | 29.2±17.7 | 22.9±18.3 | 61.3±5.6 | 22.2±17.3 | 17.8±20.4 | 39.3±7.4 |
| GMVAE [49] | 25.7±16.4 | 20.2±14.4 | 51.0±12.6 | 28.6±17.7 | 22.3±19.5 | 63.3±7.2 | 24.7±20.3 | 18.8±26.4 | 40.9±11.8 |
| Bayesian VAE [50] | 27.5±15.0 | 20.8±14.7 | 50.9±11.4 | 29.6±16.8 | 23.5±17.6 | 58.2±6.8 | 22.0±17.2 | 15.7±16.0 | 40.1±12.3 |
| KL Grad [38] | 9.5±8.2 | 5.5±5.2 | 65.5±19.7 | 10.2±14.2 | 6.7±10.3 | 39.1±20.3 | 7.9±12.8 | 6.2±9.4 | 56.7±19.5 |
| VAE Restoration [49] | 12.8±4.5 | 16.3±10.1 | 12.1±2.5 | 9.1±3.7 | 16.5±16.0 | 8.8±1.6 | 6.4±2.8 | 13.1±14.3 | 7.0±1.0 |
| f-AnoGAN [45] | 15.4±12.6 | 10.8±10.8 | 38.3±13.2 | 19.7±17.3 | 14.2±14.9 | 55.2±8.9 | 12.1±11.8 | 8.7±13.1 | 40.3±8.2 |
| Proposed w/o growing | 67.1±17.7 | 85.7±6.89 | 60.0±22.5 | 54.6±17.4 | 59.2±18.6 | 54.4±17.7 | 61.5±18.3 | 68.1±25.2 | 69.1±21.1 |
| Proposed | 69.8±15.2 | 82.1±8.92 | 66.2±22.2 | 59.3±16.9 | 58.3±18.0 | 65.6±18.7 | 61.4±19.4 | 61.3±26.1 | 77.6±19.6 |
On the other hand, the other unsupervised anomaly detection methods have limited power to segment COVID-19 lesion. As shown in Fig. 7, due to the inaccurate reconstructions, the reconstruction-based methods such as VAE [44] and f-AnoGAN [45] can not reconstruct the healthy tissues precisely. On the other hand, the encoder can not make sure to treat the COVID-19 lesion as anomaly, and suppress the lesion in the reconstruction results. These two serious shortcomings result in low COVID-19 segmentation performances, reported in Table III. Compared to other UAD methods, NormNet captures the healthy signals and segments anomalies more precisely.
Fig. 7.

Visual results of various UAD methods. (a), and (d) refer to input (after pre-processing), and final results, respectively. The image (b) in the “KL Grad” method means the gradient map of KL loss, while it in the other methods means reconstruction or restoration results. The image (c) of the methods (except for ’KL Grad’) means difference map.
E. Ablation Study
1). Voting:
To explore the effects of randomness in the training process, we evaluate the performances of the 5 models and thier voting results with different number of iterations. As shown in Table V, the performances of the 5 models oscillate as the iteration increases, while the NormNet alleviates this problem through the voting mechanism of 5 models.
TABLE V. The Dice Scores of Five Models and Voting Performance With Different Number of Iterations on Coronacases.
| Iterations | model1 | model2 | model3 | model4 | model5 | voting |
|---|---|---|---|---|---|---|
| 1500 | 68.5 | 69.4 | 63.9 | 70.5 | 69.8 | 68.9 |
| 2000 | 70.2 | 70.0 | 69.8 | 68.8 | 66.1 | 69.8 |
| 2500 | 68.0 | 63.4 | 71.4 | 66.7 | 69.9 | 69.2 |
2). Modules of Synthetic ‘Lesion’ Generator:
The steps of synthetic ‘lesion’ generator can be roughly divided into three parts: Generate shapes (
 in Section III-C.1), probability maps (
 in (8)), and salt noises (
 in (6)). To investigate the influence of each part, we train a new NormNet without the corresponding diversity:
-
•
Fixed shapes (
 ): Generate 5 ellipsoids with radius = 12 for any lung area
 without any deformation.
 -
•
Fixed probability maps (
 ): Set
 .
. -
•
Fixed salt noises (
 ): Set
 and
and
 for synthetic salt noises with the same texture.
As shown in Table IV, the loss of diversities affects the accuracy of the decision boundary and the segmentation performance. Especially, the biggest performance drop in ‘Fixed
 ’ prompts that the diverse salt noises make the largest contributions to encourage NormNet to learn tight decision boundary around the normal tissues.
TABLE IV. The Ablation Study for Modules of ‘Lesion’ Generator, Threshold
 , Hyper-Parameters of ‘Lesion’ Generator and Post-Processing. The Dice Score is Used as Metrics.
| Dataset | Hyper-parameters of ‘lesion’ generator | NormNet | |||||||||||||
|---|---|---|---|---|---|---|---|---|---|---|---|---|---|---|---|
| i | ii | iii | iv | v | vi | vii | viii | ix | x | xi | xii | xiii | xiv | ||
| Coronacases | 68.8 | 68.0 | 70.5 | 70.8 | 69.1 | 69.5 | 68.5 | 66.5 | 66.9 | 70.6 | 66.2 | 68.2 | 66.5 | 64.1 | 69.8 |
| Radiopedia | 60.8 | 61.0 | 60.4 | 55.0 | 57.0 | 58.9 | 57.3 | 59.1 | 60.7 | 58.4 | 58.3 | 60.3 | 54.6 | 53.2 | 59.3 |
| UESTC | 61.2 | 61.3 | 61.6 | 60.3 | 63.0 | 61.4 | 60.7 | 60.9 | 62.2 | 62.2 | 60.5 | 62.7 | 59.9 | 60.8 | 61.4 |
| Dataset | Param of post-processing | Threashold

|
Modules of generator | Other strategies | NormNet | ||||||||||
 |
 |
 |
 |
−700 | −600 | −400 | −300 |
 |
 |
 |
Edge | Areas | Lesions | ||
| Coronacases | 70.0 | 69.8 | 70.1 | 67.1 | 57.6 | 67.3 | 69.7 | 60.7 | 37.9 | 64.5 | 51.9 | 68.7 | 45.3 | 55.2 | 69.8 |
| Radiopedia | 59.7 | 60.0 | 60.0 | 58.9 | 52.2 | 59.7 | 55.7 | 54.0 | 40.8 | 55.6 | 55.1 | 52.6 | 44.5 | 55.3 | 59.3 |
| UESTC | 61.0 | 61.2 | 60.7 | 61.4 | 51.9 | 62.4 | 60.2 | 54.9 | 38.4 | 56.9 | 47.3 | 57.1 | 35.2 | 55.4 | 61.4 |
3). Hyparameter Analysis:
a). The Threshold of HU:
 is important in our method, since it filters the background noises while trying to keep the pattern complexity at a level that can be effectively managed by the network. On the one hand, if the threshold is too high, our NormNet only segments healthy voxels in a small-scale set, which causes more abnormal voxels missing. On the other hand, if the threshold is too small, some noisy voxels with complex contexts (as shown in Fig. 8) weaken the ability of NormNet to correctly model the normal voxels. As shown in Table IV, the performance drops rapidly when the HU threshold
 .
.
Fig. 8.

The visualization of masks under different HU thresholds. Many noisy voxels with complex contexts occur when setting the threshold as
 . We use a colormap for better visualization of the nuances.
b). Hyper-Parameters of ‘Lesion’ Generator:
For the sensitivity analyses, we change the choice of parameters separately9:
-
•
Shape of ellipsoids: Turn off the elastic-deformation10 (i) and rotation (ii), respectively.
-
•
Number of ellipsoids: (iii) Generate fewer ellipsoids by changing
 to
to
 and
and
 from
from
 to
to
 . (iv) Generate more ellipsoids by setting
 to
to
 and
and
 .
. -
•
Size of ellipsoids: (v) Select the principal semi-axes of large-size and small-size ellipsoids from
 and
and
 to
to
 and
and
 , respectively.
 -
•
Filtering
 : Select the standard deviation
 from (vi)
 and (vii)
 , respectively.
 -
•
Scaling
 : Set the range of
 from
from
 to (viii)
 and (ix)
 , respectively.
 -
•
Filtering
 : (x) Change the probability values of 0.7 and 0.3 in Eq. (4) to 0.5 and 0.5, respectively; (xi) Change
 in Eq. (4) to
 ; and (xii) Change
 in Eq. (4) to
 .
. -
•
Scaling
 : Set the range of
 from
from
 to (xiii)
 and (ix)
 , respectively.
As shown in Table IV, the performances of most experiments are stable and greatly outperform other UAD methods. This confirms that there is a wide of range of parameter choices for the ‘lesion’ generator as long as it can produce diverse ‘lesions’ with a balanced probability, forming a rich ‘lesion’ database. Therefore, the decision boundary of the learned NormNet can separate out the distribution of normal tissue, thereby segmenting COVID-19 lesions from normal tissues.
c). Hyper-Parameters of Post-Processing:
Here, we set up four experiments by individually changing the kernel sizes
 and threshold
 for both Fig. 4(d) and Fig. 4(f):
 ,
,
 ,
,
 ,
,
 . When the hyperparameter makes a small fluctuation, all of the performances are stable.
7). Other Training Strategies: 11
a). Without Removing Erroneous Edges (‘Edge’ in Table IV):
Use
 as lung mask in Section III-B. Despite our lung-segmenting nnU-Net achieves a high performance in lung segmentation, there are still some false positives around the edge of lung, which appear random and noisy. These noisy textures without consistent patterns confuse the NormNet to capture regular normal textures, which cause the performance drop in Table IV.
b). Directly Segmenting Healthy Areas Instead of Healthy Tissues (‘Areas’ in Table IV):
There are three types of voxels in the lung area: 1) Plenty of ‘air’ voxels [7], whose intensities are around 0 after clipping with a Hounsfield unit (HU) range of [−800, 100] and scaled to [0, 1]; 2) Healthy tissues; and 3) COVID-19 or synthetic lesions. Here, we redefine the ground-truth
 in Eq. (1) as
 , which represents ‘healthy areas’ instead of the original ‘healthy tissues’. In this setting, the NormNet is trained to segment too many low-intensity voxels (voxels of ‘air’) as healthy voxels, rather than focus on healthy tissues whose voxels lie in the high-intensity range. This imbalance limits the power of precisely recognizing those healthy tissues in high intensities range from various anomalies (lesions). Thus, false-positives occur when segmenting COVID-19 CT volumes.
c). Directly Segmenting Synthetic ‘Lesions’ (‘Lesions’ in Table IV):
Here, we set
 in Eq. (1) to force the NormNet to segment synthetic ‘lesions’ from ‘air’ voxels and healthy tissues directly. However, because there are still differences between synthetic and COVID-19 lesions, the segmentation network has more risk to over-fit the synthetic ‘lesions’. On the contrary, to recognize healthy tissues from plenty of ‘air’ voxels and lesions, the segmentation network must be highly sensitive to healthy tissues. The learned tight decision boundary arising from such sensitivity can be used to segment plenty of anomalies including synthetic and COVID-19 lesions with better generalization, which is the motivation to design the NormNet. The experimental results are shown in Table IV, in which performance drops in Dice coefficient are clearly observed for the model of learning to directly segment synthetic ‘lesions’.
V. Conclusion and Discussions
In this paper, we proposed the NormNet, a voxel-level anomaly modeling network to recognize normal voxels from possible anomalies. A decision boundary for normal contexts of the NormNet was learned by separating healthy tissues from the diverse synthetic ‘lesions’, which can be further used to segment COVID-19 lesions, without training on any labeled data. The experiments on three different COVID-19 datasets validated the effectiveness of the NormNet.
Despite the improvement compared to existing unsupervised anomaly detection methods, there was still a gap between our methods and supervised methods such as nnU-Net [55]. After exploring the failure predictions of our methods, we found that they were divided into three categories:
-
1)
The NormNet segments all anomalies such as pulmonary fibrosis (the first row shown in Fig. 9), rather than COVID-19 lesions only.
-
2)
Gaps between datasets: for example, most of the layer thicknesses in Luna16 dataset are around 1mm. However, in Radiopedia dataset slices were padded together, which generated different contexts. The unseen contexts were treated as anomalies by our NormNet, which resulted in the most of false-positives in Radiopedia.
-
3)
Our NormNet gave up modeling the noisy patterns in low-intensity range. Although most of lesions can be successfully detected, a small part of lesions with their intensity smaller than
 were still missed (as shown in the right column of Fig. 9). Segmenting these small lesions also serves as a difficult problem for both supervised methods [15] and anomaly detection.
Fig. 9.

Samples of failure predictions to show the limitation of our method. The red area means false positive while the blue area indicates false negative.
For a better performance on COVID-19 segmentation, we plan to extend our method to address the above limitations mainly in the following three aspects: 1) Modeling more ‘non-COVID-19’ contexts including other diseases; and 2) Exploring a better way of modeling low-intensity normal voxels as much as possible by mitigating the impact of noise with an array of denoising methods. 3) Creating a more effective synthetic ‘lesions’ generator for network learning by exploring different generation schemes, such as using a deeper hierarchy and a universal generation [71] by investigating cross-anatomy or even cross-modality possibilities. 4) Exploring the idea of metric learning such as Deep SVDD [41] to get tighter decision boundary.
Beyond COVID-19 lesion segmentation in Lung CT, we believe that it is possible to extend the NormNet to other modalities (e.g. MRI) by defining a similar proxy task, such as denoising or inpainting, etc. The NormNet can be learned to ‘recover’ the polluted healthy texture back to normal if the contexts of healthy tissues are sufficiently captured. We are going to investigate this direction in future.
Funding Statement
The work of Li Xiao was supported by the CCF-Tencent Open Fund.
Footnotes
The only prior knowledge we used is that water, tissues, infections have much higher intensities than air in lung CT [7]
Ma et al. provide 20 well-labeled CT volumes, in addition to the 10 volumes of coronacases, the other 10 volumes have been clipped to [0 – 255] without any information about HU, which is not applicable based on our methods.
We use hyper-parameter search for the 4 parameters on 3 CT volumes from the dataset ‘Coronacase’
We follow the experimental setting in [28] and use their source code: https://github.com/StefanDenn3r/unsupervised_anomaly_detection_brain_mri
80% of the data are used in the training set.
Released in their official websites. COPLE-Net: https://github.com/HiLab-git/COPLE-Net; Inf-Net: https://github.com/DengPingFan/Inf-Net
We remove CT volume #6 from the Radiopedia dataset as it has only about 70 positive voxels in 42 slices.
We select the CT volumes with the spacing of z-axis less than 5 mm, since our training set (LUNA16) only contains CT volumes with the spacing of z-axis less than 5 mm.
We mark the experiments with Roman numbers, e.g., (i).
Due to the limitation of computation resources, we turn off elastic-deformation in all of the following experiments.
More analyses and visualizations in both training and inference stages can be found in the supplementary material.
Contributor Information
Qingsong Yao, Email: yaoqingsong19@mails.ucas.edu.cn.
Li Xiao, Email: xiaoli@ict.ac.cn.
Peihang Liu, Email: phliu@bupt.edu.cn.
S. Kevin Zhou, Email: zhoushaohua@ict.ac.cn.
References
- [1].Wang C., Horby P. W., Hayden F. G., and Gao G. F., “A novel coronavirus outbreak of global health concern,” Lancet, vol. 395, no. 10223, pp. 470–473, Feb. 2020. [DOI] [PMC free article] [PubMed] [Google Scholar]
- [2].Shi F.et al. , “Review of artificial intelligence techniques in imaging data acquisition, segmentation, and diagnosis for COVID-19,” IEEE Rev. Biomed. Eng., vol. 14, pp. 4–15, 2020. [DOI] [PubMed] [Google Scholar]
- [3].WHO. 2020. Coronavirus Disease (COVID-19) Situation Report–164. [Online]. Available: https://www.who.int/publications/m/item/weeklyepidemiological-update-24-november-2020
- [4].Zu Z. Y.et al. , “Coronavirus disease 2019 (COVID-19): A perspective from China,” Radiology, vol. 296, no. 2, 2020, Art. no. 200490. [DOI] [PMC free article] [PubMed] [Google Scholar]
- [5].Ng M.-Y.et al. , “Imaging profile of the COVID-19 infection: Radiologic findings and literature review,” Radiol.: Cardiothoracic Imag., vol. 2, no. 1, Feb. 2020, Art. no. e200034. [DOI] [PMC free article] [PubMed] [Google Scholar]
- [6].Rubin G. D.et al. , “The role of chest imaging in patient management during the COVID-19 pandemic: A multinational consensus statement from the Fleischner Society,” Chest, vol. 158, no. 1, pp. 106–116, Jul. 2020. [DOI] [PMC free article] [PubMed] [Google Scholar]
- [7].Simon B. A., Christensen G. E., Low D. A., and Reinhardt J. M., “Computed tomography studies of lung mechanics,” Proc. Amer. Thoracic Soc., vol. 2, no. 6, pp. 507–517, Dec. 2005, doi: 10.1513/pats.200507-076DS. [DOI] [PMC free article] [PubMed] [Google Scholar]
- [8].Zhou S. K., Greenspan H., and Shen D.Eds., Deep Learning for Medicalimage Analysis. New York, NY, USA: Academic, 2017. [Google Scholar]
- [9].Zhou Ed S. K., Medical Image Recognition, Segmentation and Parsing: Machine Learning and Multiple Object Approaches. New York, NY, USA: Academic, 2015. [Google Scholar]
- [10].Kevin Zhou S.et al. , “A review of deep learning in medical imaging: Imaging traits, technology trends, case studies with progress highlights, and future promises,” 2020, arXiv:2008.09104. [Online]. Available: http://arxiv.org/abs/2008.09104 [DOI] [PMC free article] [PubMed]
- [11].Huang L.et al. , “Serial quantitative chest CT assessment of COVID-19: A deep learning approach,” Radiol.: Cardiothoracic Imag., vol. 2, no. 2, 2020, Art. no. e200075. [DOI] [PMC free article] [PubMed] [Google Scholar]
- [12].Shan F.et al. , “Lung infection quantification of COVID-19 in CT images with deep learning,” 2020, arXiv:2003.04655. [Online]. Available: http://arxiv.org/abs/2003.04655
- [13].Cao Y.et al. , “Longitudinal assessment of COVID-19 using a deep learning–based quantitative CT pipeline: Illustration of two cases,” Radiol.: Cardiothoracic Imag., vol. 2, no. 2, 2020, Art. no. e200082. [DOI] [PMC free article] [PubMed] [Google Scholar]
- [14].Zhou L.et al. , “A rapid, accurate and machine-agnostic segmentation and quantification method for CT-based COVID-19 diagnosis,” IEEE Trans. Med. Imag., vol. 39, no. 8, pp. 2638–2652, Aug. 2020. [DOI] [PMC free article] [PubMed] [Google Scholar]
- [15].Wang G.et al. , “A noise-robust framework for automatic segmentation of COVID-19 pneumonia lesions from CT images,” IEEE Trans. Med. Imag., vol. 39, no. 8, pp. 2653–2663, Aug. 2020. [DOI] [PMC free article] [PubMed] [Google Scholar]
- [16].Fan D.-P.et al. , “Inf-net: Automatic COVID-19 lung infection segmentation from CT images,” IEEE Trans. Med. Imag., vol. 39, no. 8, pp. 2626–2637, Aug. 2020. [DOI] [PubMed] [Google Scholar]
- [17].Yang X., He X., Zhao J., Zhang Y., Zhang S., and Xie P., “COVID-CT-dataset: A CT scan dataset about COVID-19,” 2020, arXiv:2003.13865. [Online]. Available: http://arxiv.org/abs/2003.13865
- [18].Italian Society of Medical and Interventional Radiology COVID-19 Dataset. SIRM. Accessed: May 28, 2020. [Online]. Available: https://www.sirm.org/category/senza-categoria/covid-19 [Google Scholar]
- [19].COVID-19 CT Segmentation Dataset. Accessed: Apr. 11, 2020. [Online]. Available: https://medicalsegmentation.com/covid19/
- [20].Radiopedia. Accessed: 2020. [Online]. Available: https://radiopaedia.org/articles/covid-19-4
- [21].Coronacases. Accessed: 2020. [Online]. Available: https://coronacases.org/
- [22].Ma J.et al. , “Towards data-efficient learning: A benchmark for COVID-19 CT lung and infection segmentation,” 2020, arXiv:2004.12537. [Online]. Available: http://arxiv.org/abs/2004.12537 [DOI] [PubMed]
- [23].Mosmed. Accessed: 2020. [Online]. Available: https://mosmed.ai/en/
- [24].de la Iglesia Vayá M.et al. , “BIMCV COVID-19+: A large annotated dataset of RX and CT images from COVID-19 patients,” 2020, arXiv:2006.01174. [Online]. Available: http://arxiv.org/abs/2006.01174
- [25].Çiçek Ö., Abdulkadir A., Lienkamp S.S., Brox T., and Ronneberger O., “3D U-Net: Learning dense volumetric segmentation from sparse annotation,” in Proc. Int. Conf. Med. Image Comput. Comput.-Assist. Intervent. Athens, Greece: Springer, 2016, pp. 424–432. [Google Scholar]
- [26].Chandola V., Banerjee A., and Kumar V., “Anomaly detection: A survey,” ACM Comput. Surv., vol. 41, no. 3, pp. 1–58, Jul. 2009. [Google Scholar]
- [27].Crispi T.et al. , “Anomaly detection in medical image analysis,” in Handbook of Research on Advanced Techniques in Diagnostic Imaging and Biomedical Applications. Hershey, PA, USA: IGI Global, pp. 426–446. [Google Scholar]
- [28].Baur C., Denner S., Wiestler B., Albarqouni S., and Navab N., “Autoencoders for unsupervised anomaly segmentation in brain MR images: A comparative study,” 2020, arXiv:2004.03271. [Online]. Available: http://arxiv.org/abs/2004.03271 [DOI] [PubMed]
- [29].Astarak M., Toma-Dasu I., Smedby Ö., and Wang C., “Normal appearance autoencoder for lung cancer detection and segmentation,” in Proc. Int. Conf. Med. Image Comput. Comput.-Assist. Intervent. Shenzhen, China: Springer, 2019, pp. 249–256. [Google Scholar]
- [30].Pathak D., Krahenbuhl P., Donahue J., Darrell T., and Efros A. A., “Context encoders: Feature learning by inpainting,” in Proc. IEEE Conf. Comput. Vis. Pattern Recognit. (CVPR), Las Vegas, NV, USA, Jun. 2016, pp. 2536–2544. [Google Scholar]
- [31].Frid-Adar M., Klang E., Amitai M., Goldberger J., and Greenspan H., “Synthetic data augmentation using GAN for improved liver lesion classification,” in Proc. IEEE 15th Int. Symp. Biomed. Imag. (ISBI), Washington, DC, USA, Apr. 2018, pp. 289–293. [Google Scholar]
- [32].Wang X.et al. , “A weakly-supervised framework for COVID-19 classification and lesion localization from chest CT,” IEEE Trans. Med. Imag., vol. 39, no. 8, pp. 2615–2625, Aug. 2020. [DOI] [PubMed] [Google Scholar]
- [33].Wang J.et al. , “Prior-attention residual learning for more discriminative COVID-19 screening in CT images,” IEEE Trans. Med. Imag., vol. 39, no. 8, pp. 2572–2583, Aug. 2020. [DOI] [PubMed] [Google Scholar]
- [34].Ouyang X.et al. , “Dual-sampling attention network for diagnosis of COVID-19 from community acquired pneumonia,” IEEE Trans. Med. Imag., vol. 39, no. 8, pp. 2595–2605, Aug. 2020. [DOI] [PubMed] [Google Scholar]
- [35].Pang G., Shen C., Cao L., and van den Hengel A., “Deep learning for anomaly detection: A review,” 2020, arXiv:2007.02500. [Online]. Available: http://arxiv.org/abs/2007.02500
- [36].Pang G., Shen C., and van den Hengel A., “Deep anomaly detection with deviation networks,” in Proc. 25th ACM SIGKDD Int. Conf. Knowl. Discovery Data Mining, Anchorage, AK, USA, Jul. 2019, pp. 353–362. [Google Scholar]
- [37].Zhang J.et al. , “Viral pneumonia screening on chest X-ray images using confidence-aware anomaly detection,” 2020, arXiv:2003.12338. [Online]. Available: http://arxiv.org/abs/2003.12338 [DOI] [PMC free article] [PubMed]
- [38].Zimmerer D., Isensee F., Petersen J., Kohl S., and Maier-Hein K., “Unsupervised anomaly localization using variational auto-encoders,” in Proc. Int. Conf. Med. Image Comput. Comput.-Assist. Intervent. Shenzhen, China: Springer, 2019, pp. 289–297. [Google Scholar]
- [39].Chen Y., Sean Zhou X., and Huang T. S., “One-class SVM for learning in image retrieval,” in Proc. Int. Conf. Image Process., vol. 1. Thessaloniki, Greece, Oct. 2001, pp. 34–37. [Google Scholar]
- [40].Tax D. M. J. and Duin R. P. W., “Support vector data description,” Mach. Learn., vol. 54, no. 1, pp. 45–66, Jan. 2004, doi: 10.1023/B:MACH.0000008084.60811.49. [DOI] [Google Scholar]
- [41].Ruff L.et al. , “Deep one-class classification,” in Proc. Int. Conf. Mach. Learn., Stockholm, Sweden, vol. 80, 2018, pp. 4393–4402. [Google Scholar]
- [42].Seebock P.et al. , “Exploiting epistemic uncertainty of anatomy segmentation for anomaly detection in retinal OCT,” IEEE Trans. Med. Imag., vol. 39, no. 1, pp. 87–98, Jan. 2020, doi: 10.1109/TMI.2019.2919951. [DOI] [PubMed] [Google Scholar]
- [43].Goodfellow I. J.et al. , “Generative adversarial nets,” in Proc. Neural Inf. Process. Syst., vol. 27. Montreal, QC, Canada: Curran Associates, 2014, pp. 2672–2680. [Google Scholar]
- [44].Kingma D. P. and Welling M., “Auto-encoding variational Bayes,” in Proc. Int. Conf. Learn. Represent., Banff, AB, Canada, 2014. [Google Scholar]
- [45].Schlegl T., Seeböck P., Waldstein S. M., Langs G., and Schmidt-Erfurth U., “F-AnoGAN: Fast unsupervised anomaly detection with generative adversarial networks,” Med. Image Anal., vol. 54, pp. 30–44, May 2019. [DOI] [PubMed] [Google Scholar]
- [46].Schlegl T., Seeböck P., Waldstein S. M., Schmidt-Erfurth U., and Langs G., “Unsupervised anomaly detection with generative adversarial networks to guide marker discovery,” in Proc. Int. Conf. Inf. Process. Med. Imag. Boone, NC, USA: Springer, 2017, pp. 146–157. [Google Scholar]
- [47].Zimmerer D., Kohl S. A., Petersen J., Isensee F., and Maier-Hein K. H., “Context-encoding variational autoencoder for unsupervised anomaly detection,” in Proc. Med. Imag. Deep Learn., London, U.K., 2019. [Google Scholar]
- [48].Chen X. and Konukoglu E., “Unsupervised detection of lesions in brain MRI using constrained adversarial auto-encoders,” in Proc. Med. Imag. Deep Learn., Amsterdam, The Netherlands, 2018. [Google Scholar]
- [49].You S., Tezcan K. C., Chen X., and Konukoglu E., “Unsupervised lesion detection via image restoration with a normative prior,” in Proc. Med. Imag. Deep Learn., London, U.K., 2019, pp. 540–556. [DOI] [PubMed] [Google Scholar]
- [50].Pawlowski N.et al. , “Unsupervised lesion detection in brain CT using Bayesian convolutional autoencoders,” in Proc. Med. Imaging Deep Learn., Amsterdam, The Netherlands, 2018, pp. 1–3. [Google Scholar]
- [51].Baur C., Wiestler B., Albarqouni S., and Navab N., “Deep autoencoding models for unsupervised anomaly segmentation in brain MR images,” in Brainlesion: Glioma, Multiple Sclerosis, Stroke and Traumatic Brain Injuries, vol. 11383. Shenzhen, China: Springer, 2019, pp. 161–169. [Google Scholar]
- [52].Bergmann P., Löwe S., Fauser M., Sattlegger D., and Steger C., “Improving unsupervised defect segmentation by applying structural similarity to autoencoders,” in Proc. VISAPP, 2019. [Google Scholar]
- [53].Bergmann P., Fauser M., Sattlegger D., and Steger C., “Uninformed students: Student-teacher anomaly detection with discriminative latent embeddings,” in Proc. IEEE/CVF Conf. Comput. Vis. Pattern Recognit. (CVPR), Jun. 2020, pp. 4183–4192. [Google Scholar]
- [54].Gong D.et al. , “Memorizing normality to detect anomaly: Memory-augmented deep autoencoder for unsupervised anomaly detection,” in Proc. IEEE/CVF Int. Conf. Comput. Vis. (ICCV), Seoul, South Korea, Oct. 2019, pp. 1705–1714. [Google Scholar]
- [55].Isensee F., Jäger P. F., Kohl S. A. A., Petersen J., and Maier-Hein K. H., “Automated design of deep learning methods for biomedical image segmentation,” 2019, arXiv:1904.08128. [Online]. Available: http://arxiv.org/abs/1904.08128 [DOI] [PubMed]
- [56].Samet H. and Tamminen M., “Efficient component labeling of images of arbitrary dimension represented by linear bintrees,” IEEE Trans. Pattern Anal. Mach. Intell., vol. 10, no. 4, pp. 579–586, Jul. 1988. [Google Scholar]
- [57].Ogden R. W., Non-Linear Elastic Deformations. Chelmsford, MA, USA: Courier Corporation, 1997. [Google Scholar]
- [58].Gonzales R. C. and Woods R. E., Digital Image Processing. 2002. [Google Scholar]
- [59].Haralick R. M., Sternberg S. R., and Zhuang X., “Image analysis using mathematical morphology,” IEEE Trans. Pattern Anal. Mach. Intell., vol. PAMI-9, no. 4, pp. 532–550, Jul. 1987. [DOI] [PubMed] [Google Scholar]
- [60].LUNA16. Accessed: 2020. [Online]. Available: https://luna16.grand-challenge.org/Home/
- [61].Armato S. G.et al. , “Data from LIDC-IDRI,” in The Cancer Imaging Archive. 2015, doi: 10.7937/K9/TCIA.2015.LO9QL9SX. [DOI]
- [62].Armato S. G.et al. , “The lung image database consortium (LIDC) and image database resource initiative (IDRI): A completed reference database of lung nodules on CT scans,” Med. Phys., vol. 38, no. 2, pp. 915–931, Jan. 2011, doi: 10.1118/1.3528204. [DOI] [PMC free article] [PubMed] [Google Scholar]
- [63].UESTC-COVID-19. Accessed: 2020. [Online]. Available: http://faculty.uestc.edu.cn/HiLab/en/article/379152/content/3319.htm
- [64].Clark K.et al. , “The cancer imaging archive (TCIA): Maintaining and operating a public information repository,” J. Digit. Imag., vol. 26, no. 6, pp. 1045–1057, Dec. 2013. [DOI] [PMC free article] [PubMed] [Google Scholar]
- [65].Kiser K.et al. , “Data from thethoracic volume and pleural effusion segmentations in diseased lungs for benchmarking chest CT processing pipelines,” in The Cancer Imaging Archive. 2020. [DOI] [PMC free article] [PubMed]
- [66].Aerts H. J. W. L.et al. , “Decoding tumour phenotype by noninvasive imaging using a quantitative radiomics approach,” Nature Commun., vol. 5, no. 1, pp. 1–9, Sep. 2014. [DOI] [PMC free article] [PubMed] [Google Scholar]
- [67].StructSeg. Accessed: 2020. [Online]. Available: https://structseg2019.grand-challenge.org
- [68].Medical Segmentation Decathlon. Accessed: 2020. [Online]. Available: http://medicaldecathlon.com/
- [69].MONAI. Accessed: 2020. [Online]. Available: https://github.com/Project-MONAI/tutorials/blob/master/3d_segmentation/spleen_segmentation_3d.ipynb
- [70].Kiser K.et al. , “Adam: A method for stochastic optimization,” in Proc. Int. Conf. Learn. Represent., San Diego, CA, USA, 2015. [Google Scholar]
- [71].Huang C., Han H., Yao Q., Zhu S., and Zhou S. K., “3D U2-Net: A 3D universal U-Net for multi-domain medical image segmentation,” in Proc. Int. Conf. Med. Image Comput. Comput.-Assist. Intervent. Shenzhen, China: Springer, 2019, pp. 291–299. [Google Scholar]