

Abstract
The recent Coronavirus Infectious Disease 2019 (COVID-19) pandemic has caused an unprecedented impact across the globe. We have also witnessed millions of people with increased mental health issues, such as depression, stress, worry, fear, disgust, sadness, and anxiety, which have become one of the major public health concerns during this severe health crisis. Depression can cause serious emotional, behavioral, and physical health problems with significant consequences, both personal and social costs included. This article studies community depression dynamics due to the COVID-19 pandemic through user-generated content on Twitter. A new approach based on multimodal features from tweets and term frequency-inverse document frequency (TF-IDF) is proposed to build depression classification models. Multimodal features capture depression cues from emotion, topic, and domain-specific perspectives. We study the problem using recently scraped tweets from Twitter users emanating from the state of New South Wales in Australia. Our novel classification model is capable of extracting depression polarities that may be affected by COVID-19 and related events during the COVID-19 period. The results found that people became more depressed after the outbreak of COVID-19. The measures implemented by the government, such as the state lockdown, also increased depression levels.
Keywords: Australia, Coronavirus Infectious Disease 2019 (COVID-19), depression, multimodal features, Twitter
I. Introduction
The outbreak of the novel Coronavirus Infectious Disease 2019 (COVID-19) has caused an unprecedented impact on people’s daily lives around the world. People’s lives are at risk because the virus can easily spread from person to person either by coming in close contact with the infected person or sometimes may even spread through community transmission,1 which then becomes extremely challenging to contain. The infection has now rapidly spread across the world, and there have been more than 10.3 million confirmed cases and more than 505 000 people have died because of the infection until 30 June 2020.2 Almost every country in the world is battling against COVID-19 to prevent it from spreading as much as possible. While some countries, such as New Zealand, have been very successful in containing the spread, others, such as Brazil and India, have not. As a result, this outbreak has caused immense distress among individuals either through infection or through increased mental health issues, such as depression, stress, worry, fear, disgust, sadness, anxiety, and perceived stigmatization [1], [2]. These mental health issues can even occur in people, not at high risk of getting infected. There could be even several people who are exposed to the virus may be unfamiliar with it as they may not follow the news or are completely disconnected from the general population [1].
Consider depression as an example, which is the most common mental health issue among other mental health issues according to the World Health Organisation (WHO), with more than 264 million people suffering from depression worldwide [3]. Australia is one of the top countries where mental health disorders have high proportions over the total disease burden (see Fig. 1). A person can experience several complications as a result of depression. Complications linked to mental health especially depression include unhappiness and decreased enjoyment of life, family conflicts, relationship difficulties, social isolation, problems with tobacco, alcohol and other drugs, self-harm and harm to others (such as suicide or homicide), and weakened immune systems. Furthermore, the consequence of depression goes beyond functioning and the quality of life and extends to somatic health. Depression has been shown to subsequently increase the risk of, for example, cardiovascular, stroke, diabetes, and obesity morbidity. However, the past epidemics can suggest some cues of what to look out for after COVID-19 in the next few months and years. For example, when patients with SARS and MERS were assessed a few months later, 14.9% had depression, and 14.8% had an anxiety disorder [2].
Fig. 1.

World mental health disorders in 2016.3
Meanwhile, to reduce the risk of the virus spreading among people and communities, different countries have taken strict measures, such as locking down the whole city and practicing rigorous social-distancing among people. For example, countries such as China, Italy, Spain, and Australia are fighting the COVID-19 pandemic through nation-wide lockdown or by cordoning off the areas that were suspected of having risks of community spread throughout the pandemic, expecting to “flatten the curve.” However, the long-term social activity restriction policies adopted during the pandemic period may further amplify the mental health issues of people. Therefore, it is important to examine people’s mental health states as a result of COVID-19 and related policies, which can help governments and related agencies to take appropriate measures more objectively if necessary.
On the other hand, we have witnessed increased usage of online social media, such as Twitter, during the lockdown.4 For instance, 40% consumers have spent longer than usual on messaging services and social media during the lockdown. It is mainly because people are eager to publicly express their feelings online given the unprecedented time that they are going through both physically and emotionally. The social media platforms represent a relatively real-time large-scale snapshot of activities, thoughts, and feelings of people’s daily lives and, thereby, reflect their emotional well-being. Every tweet represents a signal of the users’ state of mind and state of being at that moment. Aggregation of such digital traces may make it possible to monitor health behaviors at a large scale, which has become a new growing area of interest in public health and health care research [10].
Since social media is social by its nature, social patterns can be consequently found in Twitter feeds, for instance, thereby revealing key aspects of mental and emotional disorders. As a result, Twitter, recently, has been increasingly used as a viable approach to detect mental disorders of depression in different regions of the world [4]. For example, the research found that the depressed users were less active in posting tweets, doing it more frequently between 23:00 and 6:00. The use of vocabularies could also be an indicator of depression in Twitter, for example, it was found that the use of verbs was more common by depressed users, and the first-person singular pronoun was by far the most used by depressed users [4]. Hence, many research works have been done to extract features, such as user’s social activity behaviors, user profiles, and texts from their social media posts for depression detection using machine learning techniques [5]–[9]. For example, De Choudhury et al. [5] proposed to predict depression for social media users based on Twitter using a support vector machine (SVM) for prediction based on manually labeled training data.
The most recent works using Twitter to analyze mental health issues due to COVID-19 are [10]. These works focus more on public sentiment analysis. Furthermore, little work, [11], classify each tweet into the emotions of anger, anticipation, disgust, fear, joy, sadness, surprise, and trust. The two emotions of sadness and fear are more related to severe negative sentiments, such as depression due to COVID-19. However, little work is done to detect depression dynamics at the state level or even more granular level, such as the suburb level. Such granular-level analysis of depression dynamics not only can help authorities, such as governmental departments, to take corresponding actions more objectively in specific regions if necessary but also allows users to perceive the dynamics of depression over time to learn the effectiveness of policies implemented by the government or negative effects of any big events. The answers to the questions that we wish to find are as follows:
-
1)
How people’s depression is affected by COVID-19 in the time dimension in the state level?
-
2)
How people’s depression is affected by COVID-19 in the time dimension in local government areas (LGAs)?
-
3)
Can we detect the effects of policies/measures implemented by the government during the pandemic on depression?
-
4)
Can we detect the effects of big events on depression during the pandemic?
-
5)
How effective is the model in detecting people’s depression dynamics?
This article aims to examine community depression dynamics due to the COVID-19 pandemic in Australia. A new approach based on multimodal features from tweets and term frequency-inverse document frequency (TF-IDF) is proposed to build a depression classification model. Multimodal features aim to capture depression cues from emotion, topic, and domain-specific perspectives. TF-IDF is simple, scalable, and has proven to be very effective to model a wide-range of lexical data sets, including large and small data sets. In contrast, recent computationally demanding frameworks, such as deep learning, which are usually generated by relying upon large data sets because help gives them faithful co-occurrence statistics, might not be obtained from sparse and short texts from user-generated content, such as tweets. Our approach uses the TF-IDF model that can generalize well in various situations where both small and large data sets can be used leading to a reliable and scalable model. After building the model for depression classification, Twitter data in the state of New South Wales (NSW) in Australia are then collected and input into our depression classification model to extract depression polarities that may be affected by COVID-19 and related events during the COVID-19 period. The contributions of this article primarily include the following.
-
1)
Novel multimodal features, including emotion, topic, and domain-specific features, are extracted to describe depression in a comprehensive approach;
-
2)
A faithful depression classification model based on TF-IDF, which is simple and scalable in generalization, is proposed to detect depressions in short texts, such as tweets.
-
3)
Instead of the depression examination of the whole country, a fine-grained analysis of depression in LGAs of a state in Australia is investigated.
-
4)
The links between the community depression and measures implemented by the government during the COVID-19 pandemic are examined.
To the best of our knowledge, this study is the first work to investigate the community depression dynamics across the COVID-19 pandemic, as well as to conduct the fine-grained analysis of depression and demonstrate the links of depression dynamics with measures implemented by the government and the COVID-19 itself during the pandemic.
II. Related Work
A. Machine Learning-Based Depression Detection
Social media has long been used as the data source for depression detection due to the largely available user-generated text data [12], [13]. The shared text data and the social behavior of the social network users are assumed to contain clues for identifying depressed users. To find the depression pattern for social media users, many works have been done to adopt traditional machine learning models, such as SVM and J48, for depression classification and detection based on different feature engineering techniques. For example, Wang et al. [14] have proposed a binary depression detection model for Chinese Sina microblogs to classify the posts as depressed or nondepressed. Based on the features extracted from the content of the microblog, they have trained the J48 tree, Bayes network, and rule-based decision table as classifiers for depression detection.
De Choudhury et al. [5] have investigated to predict depression for social media users based on Twitter. To get the ground truth of users’ suffered depression history, De Choudhury et al. [5] adopted crowdsourcing to collect Twitter users who have been diagnosed with clinical major depressive disorder (MDD) based on the Center for Epidemiologic Studies Depression Scale (CES-D2) screening test. Then, to link the depression symptoms with the social media data, they extracted several measures, such as user engagement and emotion, egocentric social graph, linguistic style, depressive language user, and the mentions of antidepressant medications from users’ social media history for one year. Finally, they trained SVM as the depression classifier based on the ground truth and the extracted features for the tested Twitter users with prediction accuracy of around 70%. Similarly, Tsugawa et al. [6] have investigated recognizing depression from the Twitter activities. To get the ground truth data of users’ depression degree record, they chose the web-based questionnaire for facts collection. Then, similar features, such as topic features extracted using topic modeling, such as latent Dirichlet allocation (LDA), polarities of words, and tweet frequency, are extracted from the Twitter users’ activity histories for training an SVM classifier.
Later, Yang and Mu [7] have proposed to analyze the spatial patterns of depressed Twitter users based on Geographic Information Systems (GIS) technologies. They first adopted nonnegative matrix factorization (NMF) to identify the depressed tweets from online users. Then, they exploited the geotagged information as the indicator of users’ geographical location and analyzed the spatial patterns of depressed users. Shen et al. [9] have made efforts to explore comprehensive multimodal features for depression detection. They adopted six groups of discriminant depression-oriented features extracted from users’ social network, profile, visual content, tweets’ emotions, tweets’ topics, and domain-specific knowledge, which are used as representations for Twitter users. Then, a dictionary learning model is used to learn from the features, capture the jointly cross-modality relatedness for a fused sparse representation, and train a classifier to predict the depressed users.
Different from these work in feature extraction that may be either impractical, such as using crowdsourcing to manually label each user, or too customized, such as extracting different kinds of social behaviors of users, we propose to combine the robust and simple text feature representation method: TF-IDF with other multimodal features, such as topics and emotions to represent the text data.
B. Depression Detection Due to COVID-19
The impact of COVID-19 on people’s mental health has been recently reported in various studies. For instance, Galea et al. [19] have pointed out that the mental health consequences due to this pandemic are applicable in both the short and long terms. Huang and Zhao [20] have exploited a web-based cross-sectional survey based on the National Internet Survey on Emotional and Mental Health (NISEMH) to investigate people’s mental health status in China by spreading the questionnaire on Wechat (a popular social media platform in China). To infer the depression symptoms for the anonymous participants, they have adopted a predefined epidemiology scale to identify whether participants had depressive symptoms. Similarly, Ni et al. [21] have conducted a survey on the online platform to investigate the mental health of 1577 community-based adults and 214 health professionals during the epidemic and lockdown. The results show that around one-fifth of respondents reported probable anxiety and probable depression. These works are mainly based on questionnaires and predefined mental health scale models for inference. In contrast, our proposed work relies on detecting depression from social media data automatically, which shows advantages in monitoring a large number of people’s mental health states.
III. Data
A. Study Location
In this study, a case study for analyzing depression dynamics during the COVID-19 pandemic in the state of NSW in Australia is conducted. NSW has a large population of around 8.1 million people according to the census in September 2019 from the Australian Bureau of Statistics.5 The NSW’s capital city Sydney is Australia’s most populated city with a population of over 5.3 million people. The LGAs are the third tier of government in the Australian state (the three tiers are federal, state, and local government).
B. Data Collection
To analyze the dynamics of depression during the COVID-19 pandemic period at a fine-grained level, we collected tweets from Twitter users who live in different LGAs of NSW in Australia. The time span of the collected tweets is from January 1, 2020, to May 22, 2020, which covers dates that the first confirmed case of coronavirus was reported in NSW (25 January 2020) and the first time that the NSW premier announced the relaxing for the lockdown policy (March 10, 2020). There are 128 LGAs in NSW. In this study, Twitter data were collected for each LGA separately so that the depression dynamics can be analyzed and compared for LGAs. Twitter data were collected through the user timeline crawling API user_timeline6 in Tweepy that is a python wrapper for the official Twitter API.7 Table I shows the summary of the collected tweet data set. In summary, 94 707 264 tweets were collected with an average of 739 901 tweets for each LGA during the study period. Data sets of COVID-19 tests and confirmed cases in NSW during the study period were collected from DATA.NSW.8
TABLE I. Summary of the Collected Twitter Data Set.
| Description | Size |
|---|---|
| Total Twitter users | 183,104 |
| Average Twitter user per LGA | 1,430.5 |
| Average tweets per LGA | 739,900.5 |
| Total tweets | 94,707,264 |
Fig. 2 shows the overview of the number of tests (polylines with dots) and confirmed cases (bars) of COVID-19 in NSW over the study period. It shows that the outbreak peak of COVID-19 in NSW was on March 26, 2020, and tests were significantly increased after April 13, 2020. It also shows that most of the confirmed cases were originally related to overseas.
Fig. 2.

Tests and confirmed cases of COVID-19 in NSW until May 22, 2020.
C. Data Set for Depression Model Training
In order to detect depression at the tweet level, we created two labeled data sets for both depressed and nondepressed tweets.
-
1)
Positive Tweets (Depressed): We used a previous work data set from [9]. Shen et al. [9] published around 300k tweets with 1400 depressed users. In order to have a better performance, we increased the number of positive tweets by crawling additional 600k tweets from the Twitter keyword streaming API. We adopted the same keywords search that was selected by [9] where users identified themselves as depressed, and we also used a regular expression to find positive tweets (e.g., I’m depressed AND suicide).
-
2)
Negative Tweets (Nondepressed): In order to balance the negative tweets with the positive tweets, we randomly selected 900k tweets that were not labeled as depressed from the collected tweets.
After the collection of experimental data, features need to be extracted from social media text. However, because of the free-style nature of social media text, it is hard to extract useful features directly from raw text data and apply them to a classifier. The raw text data also affect the efficiency of extracting reliable features, and it makes it difficult to find word similarities and apply semantic analysis. Therefore, raw data must be preprocessed before feature extraction, in order to clean and filter data and ensure the data quality for feature extraction. Preprocessing may also involve other procedures, such as text normalization.
Natural language processing (NLP) toolkit has been widely used for text preprocessing due to its high-quality processing capabilities, such as processing sentimental analysis data sets. NLP toolkit (NLTK) library is considered one of the most powerful NLP libraries in Python programming. Therefore, before feeding our data to the model, we used NLTK to remove user mentions, URL links, and punctuation from tweets. Furthermore, we removed common words from each tweet, such as “the” and “an”). There are various reasons that have been mentioned in the literature where removing the stop words has had a positive impact on the model’s quantitative performance, for instance, sometimes, stop words deteriorate the classifications performance; sometimes, they also have a huge impact on the model efficiency because these stop words increase the parameter space of the model, among various other reasons. NLTK has a set of stop words that enable removing them from any text data easily. Finally, we stem tweets using NLTK using the Porter Stemmer.
IV. Our Model
A. Proposed Method
In this study, two sets of features are extracted from raw text and used to represent tweets. Since extracting features would be challenging due to the short length of the tweets, and a single tweet does not provide sufficient word occurrences, we, therefore, combine multimodal features with TF-IDF features to analyze depressed tweets. Our proposed framework is shown in Fig. 3.
Fig. 3.

Proposed framework to detect depressed tweets during the COVID-19.
B. Multimodal Features
User behaviors at the tweet level could be modeled by the linguistic features of tweets posted by the user. Inspired by Shen et al. [9], we defined a set of features consisting of three modalities. These three modalities of features are as follows.
-
1)
Emotional Features: The emotion of depressed people is usually different from nondepressed people, which influences their posts on social media. In this work, we studied user positive and negative emoji in each tweet to represent emotional features. Furthermore, users in social media often use a lot of slang and short words, which also convey positive and negative emotions [22]. In this study, positive and negative emotion features are also extracted based on slang and short words.
-
2)
Topic-Level Features: We adopted LDA [23] to extract topic-level features since LDA is the most popular method used in the topic modeling to extract topics from text, which could be considered as a high-level latent structure of content. The idea of LDA is based on the assumption of a mixture of topics forms documents, each of which generates words based on their Dirichlet distribution of probability. Given the scope of the tweet content, we defined 25 latent topics in this study, whose topic number is often adopted in other studies. We have also found that this number of topics gives satisfactory results in our experiments. We implemented LDA in Python with Scikit-Learn.
-
3)
Domain Specific Features: Diagnostic and Statistical Manual of Mental Disorders 4th Edition (also called DSM-IV) is a manual published by the American Psychiatric Association (APA) that includes almost all currently recognized mental health disorder symptoms [24]. We, therefore, chose the DSM-IV Criteria for MDD to describe keywords related to the nine depressive symptoms. Pretrained word2vec (Gensim pretrained model based on Wikipedia corpus) was used in this study to extend our keywords that are similar to these symptoms. We also extracted “Antidepressant” by creating a complete list of clinically approved prescription antidepressants in the world: a) depressed mood; b) loss of interest; c) weight or appetite change; d) sleep disturbance; e) psychomotor changes; f) fatigue or loss of energy; g) feel worthlessness; h) reduced concentration; i) suicidal ideation.
For a given sample of tweet, the multimodal features are represented as
 , where
 is the
 -dimensional feature for the
 th modality for each tweet and
 is the size of the combined feature space, which is 21 in this study.
C. TF-IDF
We first review the definitions of TF-IDF in the following.
Definition 1 (TF):
Consider the tweets in Bag-of-Word (BoW) model, where each tweet is modeled as a sequence of words without order info. Apparently in the BoW scheme, a word in a tweet with occurrence frequency of 10 is more important than a term with that frequency of 1 but not proportional to the frequency. Here, we use the log TF
as defined by
where
represents occurrence number of the term
in a tweet
.

Definition 2 (IDF):
It uses the frequency of the term in the whole collection for weighting the significance of the term in light of inverse effect. Therefore, under this scheme, the IDF value of a rare word is higher, whereas it is lower for a frequent term, i.e., weighing more on distinct words. The log IDF that measures the informativeness of a term is defined as
where
represents the total number of tweets in the tweet corpus and
the number of tweets containing the term
.
Therefore, TF-IDF is calculated by combining TF and IDF as represented in the following equation:
 |
In order to extract relevant information from each tweet and reduce the amount of redundant data without losing important information, we combined multimodalities (MMs) with TF-IDF. TF-IDF is a numerical statistic metric to reflect the importance of a word in a list or corpus, which is widely studied in relevant work. De Choudhury et al. [5] applied TF-IDF to words in Wikipedia to remove extremely frequent terms and then used the top words with high TF-IDF. The approach helped them to assess the frequency of uses of depression terms that appear on each user’s Twitter posts on a given day. Singh et al. [25] have used TF-IDF in their model to compare the difference of performance by feeding TF-IDF into five machine learning models. It was found that all of them can achieve very good performance. However, one weakness of BoW is unable to consider the word position in the text, semantics, and co-occurrences in different documents. Therefore, TF-IDF is only useful as a lexical-level feature.
D. Modeling Depression in Tweets
Two labeled data sets as introduced in Section III-C are used to train the depression classification model for tweets. Here, we only use English tweets to train the model, and all non-English tweets are excluded. We also exclude any tweets with a length shorter than five words since these tweets could only introduce noise and influence the effectiveness of the model negatively. Three mainstream classification methods are used in this study to compare their performance: logistic regression (LR), linear discriminant analysis (LDA), and Gaussian Naive Bayes (GNB). We used scikit-learn libraries to import the three classification methods. The classification performance by these three methods was evaluated by fivefold cross-validation. The experiments are conducted using Python 3.6.3 with a 16-core CPU.
We evaluate the classification models by using the measure of accuracy (ACC.), recall (Rec.), macroaveraged precision (Prec.), and macroaveraged F1-Measure (F1).
V. Classification Evaluation Results
We first evaluate how well the existing models can detect depressed tweets. After extracting the feature representations of each tweet, three different classification models are trained with the labeled data. We adopted a ratio of 75:25 to split the labeled data into training and testing data. We performed experiments by using TF-IDF, MM, and combined features under three different classification models.
We compare the performance of models using only MM features with the three different classifiers, as shown in Table II. We found that GNB for MM features obtained the highest precision score compared with other classifiers, and LR performs better than the other two classifiers in terms of recall, F1-Score, and accuracy.
TABLE II. Performance of Tweet Depression Detection Based on MMs Only.
| Features | Method | Precision | Recall | F1-Score | Accuracy |
|---|---|---|---|---|---|
| Multi-Modal | LR | 0.842 | 0.828 | 0.832 | 0.833 |
| LDA | 0.843 | 0.816 | 0.820 | 0.824 | |
| GNB | 0.873 | 0.814 | 0.818 | 0.825 |
Furthermore, in order to see how different features impact the classification performance, we use the TF-IDF standalone with three classifiers for comparison, and the results are as shown in Table III. It shows that all three classifiers can achieve satisfactory classification results. LR and LDA shared the highest precision and F1-Score. LR competes with the other two classifiers according to recall and accuracy.
TABLE III. Performance of Tweet Depression Detection Based on TF-IDF Only.
| Features | Method | Precision | Recall | F1-Score | Accuracy |
|---|---|---|---|---|---|
| TF-IDF | LR | 0.908 | 0.896 | 0.900 | 0.901 |
| LDA | 0.906 | 0.893 | 0.897 | 0.898 | |
| GNB | 0.891 | 0.873 | 0.877 | 0.879 |
Table IV shows the model performance when we concatenate both MM and TF-IDF features, and we can see that the model has improved the performance further slightly. One conclusion that we can draw here is that the TF-IDF textual feature can make the main satisfactory contribution to detect depression tweets, while other modalities can provide additional support. This could be attributed to the lexical importance of depressed-related tweets. Another reason why the overall combination of multimodal features did not give us a big lift in the results could be because, as mentioned earlier, tweets are highly sparse, poorly phrased, short texts, and noisy content. Therefore, deriving semantic content from tweets, for instance, using the LDA model would always be very challenging to get a huge boost in the results. This is mainly because any statistical model relies on the co-occurrence statistics that might be poor in our case. However, we still see an improvement in the overall recall result, which is important in this case, because we are noticing a reduction in the number of false-negative detection. This is mainly because of the interplay between all three features, which suggests that these features are important and cannot be ignored.
TABLE IV. Performance of Tweet Depression Detection Based on MMs + TF-IDF.
| Features | Method | Precision | Recall | F1-Score | Accuracy |
|---|---|---|---|---|---|
| MM+TF-IDF | LR | 0.908 | 0.899 | 0.902 | 0.903 |
| LDA | 0.912 | 0.899 | 0.903 | 0.904 | |
| GNB | 0.891 | 0.874 | 0.878 | 0.879 |
VI. Detecting Depression Due to COVID-19
After having testified our classification model, we utilize our approach to detect depressed tweets from different LGAs of NSW, Australia. Since our model deals only with English tweets, we had to exclude tweets in all other languages and input English tweets only into our model to predict depression. We ended up with 49 million tweets, and fed the LR with (MM + TF-IDF) model with these tweets, and the model found that nearly two million tweets were classified as depressed tweets. In this section, we show the depression dynamics in NSW during the study period between January 1, 2020, and May 22, 2020. The depression dynamics in different LGAs in NSW are also analyzed to demonstrate how the COVID-19 pandemic may affect people’s mental health.
A. Depression Dynamics in NSW
Fig. 4 presents the overall community depression dynamics in NSW with the confirmed cases of COVID-19 together during the study period between January 1, 2020, and May 22, 2020. “Depression level” refers to the proportion of the number of depressed tweets over the whole number of tweets each day. From this figure, we can find that people showed a low level of depression during the period before the significant increase in the confirmed cases of COVID-19 until March 8, 2020, in NSW. People’s depression level was significantly increased with a significant increase in confirmed cases of COVID-19. The depression level reached a peak during the peak outbreak period of COVID-19 on March 26, 2020. After that, people’s depression levels decreased significantly for a short period and then kept relatively stable with some short fluctuations. Overall, the analysis clearly shows that people became more depressed after the outbreak of COVID-19 on March 8, 2020, in NSW.
Fig. 4.

Community depression dynamics in NSW between
 , 2020, and May 22, 2020.
When we drill down into details of Fig. 4, it was found that people’s depression was much sensitive to sharp changes of confirmed cases of COVID-19 on that day or after. For example, people’s depression levels had sharp changes around the days of March 10, March 25, March 30, and April 14, 2020 (there were sharp changes of confirmed cases of COVID-19 on these days). The sharp increase in confirmed cases of COVID-19 usually resulted in a sharp increase in depression levels (i.e., people became more depressed because of the sharp increase in confirmed cases of COVID-19).
B. Depression Under Implemented Government Measures and Big Events
This section investigates the links between people’s depression and implemented government measures for COVID-19 (such as lockdown), as well as big events during the pandemic.
By investigating the labeled topics with the hashtag in the collected Twitter data, it was found that the topics of “lockdown” and “social-distancing” were started to be discussed actively from March 9 when the government encouraged people to increase social-distancing in life, the NSW government officially announced the state lockdown on March 30, and the restrictions were begun from 31 March.9 The NSW government announced the ease of restrictions on May 10.10 When we link these dates with depression levels, as shown in Fig. 4, it was found that people felt significantly more depressed when they started to actively discuss the lockdown restriction on March 9. People were slightly more depressed after the official implementation of the state lockdown in NSW. The results revealed that the lockdown measure may make people more depressed. However, people still became more depressed even if after the relaxation of lockdown. This is maybe because people are still worried about the spread of this severe virus due to the increased community activities.
We are also interested in whether people’s depression was affected by big events during the COVID-19 period. For example, the Ruby Princess Cruise docked in Sydney Harbor on March 18, 2020. About 2700 passengers were allowed to disembark on March 19 without isolation or other measures although some passengers had COVID-19 symptoms at that time, which was considered to create a coronavirus hotbed in Australia. The Ruby Princess Cruise has been reported to be linked to at least 662 confirmed cases and 22 deaths of COVID-19.11
We link the depression dynamics, as shown in Fig. 4, with the important dates of the Ruby Princess Cruise (e.g., docking date and disembarking date) and actual timeline of the public reporting of confirmed cases and deaths, as well as other events (e.g., police in NSW announced a criminal investigation into the Ruby Princess Cruise debacle on April 5) related to the Ruby Princess.11 We have not found significant changes in people’s depression on those dates. This may imply that the big events did not cause people’s depression changes significantly.
C. Depression Dynamics in LGAs
We further analyzed community depression dynamics in LGAs in NSW. Fig. 5 shows examples of choropleth maps of community depression dynamics in LGAs in NSW for two different months: March 2020 and April 2020. We can observe from the maps that the community depression level was different across different LGAs in each month. Furthermore, the community depression of each LGA changed in different months. On average, people in LGAs were more depressed in March than in April. This is maybe because the number of daily confirmed cases of COVID-19 was significantly increased to a peak, and it was gradually decreased in April.
Fig. 5.
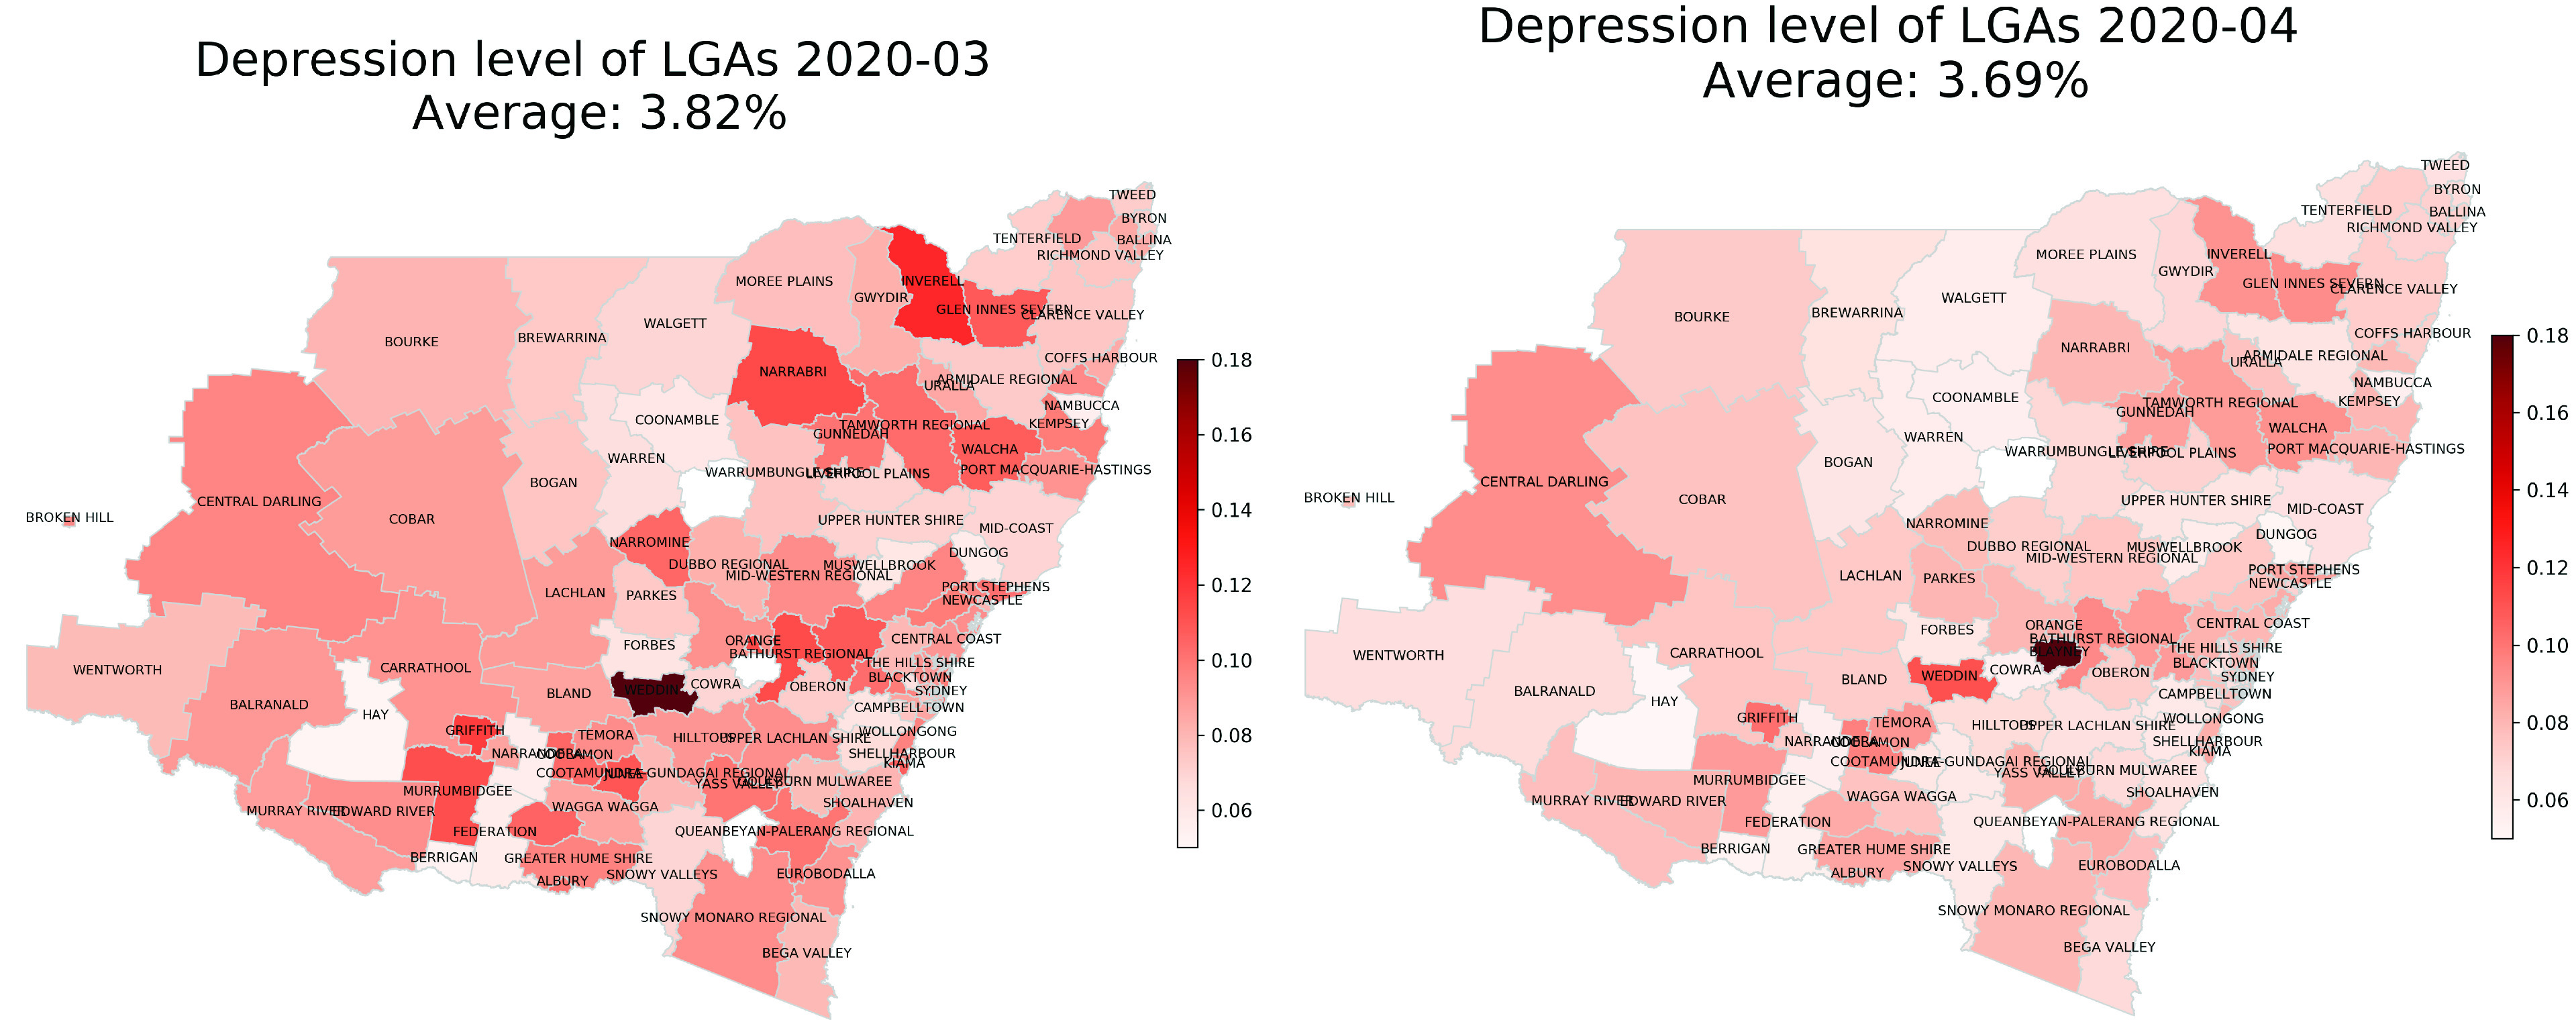
Choropleth maps of community depression in LGAs in NSW in March 2020 (left) and April 2020 (right).
We also dig into more details of depression changes of LGAs around Sydney City areas. For example, Ryde, North Sydney, and Willoughby are three neighboring LGAs in Northern Sydney. Their community depression dynamics and corresponding confirmed cases of COVID-19 are shown in Fig. 6, respectively. When comparing the dynamics in this figure, we can see that different LGAs showed that different depression dynamics maybe because of some events specifically related to that LGA. For example, in an aged care center in Ryde LGA, a nurse and an 82-year-old elderly resident were first tested positive for coronavirus at the beginning of March.12 After that, a number of elderly residents in this aged care center were tested positive for COVID-19 or even died. At the same time, a childcare center and a hospital in this LGA have been reported positive COVID-19 cases in March. Many staff from the childcare center and the hospital were asked to test the virus and conduct home isolation for 14 days. All these may result in significant community depression changes in March 2020, as shown in Fig. 6. For example, the depression level in Ryde LGA was changed significantly to a very high level on March 10, 2020, and March 16, 2020, respectively.
Fig. 6.

Community depression dynamics in Ryde, North Sydney, and Willoughby in Northern Sydney between January 1, 2020, and May 22, 2020.
However, it was not found that the community depression dynamics in an LGA showed close relations with the dynamics of confirmed cases of COVID-19 in that LGA as we found at the state level. This is maybe because the community depression dynamics in an LGA was affected largely by the confirmed cases in the overall state but not the LGA. This aligns with our common sense during the COVID-19 pandemic: even if our family is currently safe from COVID-19, we are still worrying about life because of the continuing significant increases of COVID-19 all over the world especially in big countries.
D. Discussion
The results of this study showed that our novel depression classification model can successfully detect community depression dynamics at the NSW state level during the COVID-19 pandemic. It was found that people became more depressed after the outbreak of COVID-19 in NSW. People’s depression level was much sensitive to sharp changes in confirmed cases of COVID-19, and the sharp increase in confirmed cases made people more depressed. When we conducted a fine-grained analysis of depression dynamics in LGAs in NSW, our novel model can also detect the differences of people’s depression in LGAs and depression changes in each LGA at a different period.
The study found that the policies/measures implemented by the government such as the state lockdown have had an obvious impact on community depression within a short time period. The implementation of the state lockdown made people more depressed; however, the relaxation of restriction also made people more depressed. This could be primarily because people are still worried about the spread of COVID-19 due to the increased community activities after the relaxation of restrictions.
This study did not find the significant effects of big events, such as the Ruby Princess Cruise ship coronavirus disaster in Sydney on the community depression. This is maybe because the data related to the disaster is small, and passengers were also from other Australian states and even overseas besides NSW.
Since the proposed approach does not have constraints on locations of Twitter data, the proposed approach can be used to analyze the depression dynamics in other regions or countries. The proposed approach can also be generalized without special considerations to analyze depression dynamics over time and locations because of other events besides COVID-19.
VII. Conclusion
This article conducted a comprehensive examination of the community depression dynamics in the state of NSW in Australia due to the COVID-19 pandemic. A novel depression classification model based on multimodal features and TF-IDF was proposed to detect depression polarities from the Twitter text. By using Twitter data collected from each LGAs of NSW from January 1, 2020, to May 22, 2020, as input to our novel model, this article investigated the fine-grained analysis of community depression dynamics in NSW. The results showed that people became more depressed after the outbreak of the COVID-19 pandemic. People’s depression was also affected by the sharp changes in confirmed cases of COVID-19. Our model successfully detected depression dynamics because of the implementation of measures by the government. When we drilled down into LGAs, it was found that different LGAs showed different depression polarities during the timeframe of the tweets used in our study, and each LGA may have different depression polarity on different days. It was observed that the big health emergencies in an LGA had a significant impact on people’s depression. However, we did not find significant effects of the confirmed cases of COVID-19 in an LGA on people’s depressions in that LGA as we observed at the state level. These findings could help authorities, such as governmental departments to manage community mental health disorders more objectively. The proposed approach can also help government authorities to learn the effectiveness of policies implemented.
Biographies

Jianlong Zhou (Senior Member, IEEE) is currently a Senior Lecturer with the Data Science Institute, University of Technology Sydney, Ultimo, NSW, Australia. He is also a leading senior researcher in trustworthy and transparent machine learning and has done pioneering research in the area of linking human and machine learning. His research work focuses on the ethics of AI, AI fairness, AI explainability, data analytics, visual analytics, behavior analytics, human–computer interaction, and related applications.

Hamad Zogan received the B.Sc. degree from King Abdulaziz University, Jeddah, Saudi Arabia, in 2007, and the M.Sc. degree from Saint Joseph’s University, Philadelphia, PA, USA, in 2017. He is currently pursuing the Ph.D. degree with the University of Technology Sydney, Ultimo, NSW, Australia, with a full scholarship from Jazan University, Jizan, Saudi Arabia.
His research interests are in data analytics, social network analysis, and exploring novel methods in machine learning to discover mental illness on social media.

Shuiqiao Yang received the B.S. degree from Shanghai Ocean University, Shanghai, China, in 2012, the M.S. degree from Zhejiang University, Hangzhou, China, in 2016, and the Ph.D. degree from the School of Information Technology, Deakin University, Geelong, VIC, Australia, in 2020.
He currently holds a post-doctoral position at the Data Science Institute, University of Technology Sydney, Ultimo, NSW, Australia. His research interests include text mining, machine learning, and data analysis.

Shoaib Jameel received the Ph.D. degree from The Chinese University of Hong Kong, Hong Kong, in 2014.
He works with various technology startups in the U.K. spearheading their technical sphere, where his research outputs are directly applied to their production systems. He is currently a Lecturer in computer science and artificial intelligence with the School of Computer Science and Electronic Engineering, University of Essex, Colchester, U.K.
Dr. Jameel is also a Fellow of the Higher Education Academy.

Guandong Xu received the Ph.D. degree in computer science from Victoria University, Footscray, VIC, Australia, in 2009.
He is currently a Full Professor with the School of Computer Science, University of Technology Sydney, Ultimo, NSW, Australia. He has published 3 monographs in Springer and CRC press and more than 250 journal articles and conference papers in data science, recommender systems, text mining, and social network analysis.
Dr. Xu has served as a Guest Editor for Pattern Recognition, the IEEE Transactions on Computational Social Systems, Journal of Software and Systems, World Wide Web journal, Multimedia Tools and Applications, and Online Information Review. He is also an Assistant Editor-in-Chief of World Wide Web journal.

Fang Chen is currently a Distinguished Professor of AI and data science with the University of Technology Sydney (UTS), Ultimo, NSW, Australia, where she is also the Executive Director Data Science and a Distinguished Professor. She has created many world-class AI innovations while working in Intel, Motorola, NICTA, CSIRO, and UTS and helped governments and industries utilizing data and significantly increasing productivity, safety, and customer satisfaction. Her research interests include machine learning, AI ethics, behavior analytics, and their applications.
Funding Statement
This work was supported in part by the Australian Research Council under Grant DP200101374 and Grant LP170100891 and in part by the Asian Office of Aerospace Research & Development (AOARD) under Grant 216624.
Footnotes
Contributor Information
Jianlong Zhou, Email: jianlong.zhou@uts.edu.au.
Hamad Zogan, Email: hamad.a.zogan@student.uts.edu.au.
Shuiqiao Yang, Email: shuiqiao.yang@uts.edu.au.
Shoaib Jameel, Email: shoaib.jameel@essex.ac.uk.
Guandong Xu, Email: guandong.xu@uts.edu.au.
Fang Chen, Email: fang.chen@uts.edu.au.
References
- [1].Montemurro N., “The emotional impact of COVID-19: From medical staff to common people,” Brain, Behav., Immunity, vol. 87, pp. 23–24, Jul. 2020. [DOI] [PMC free article] [PubMed] [Google Scholar]
- [2].Rogers J. P.et al. , “Psychiatric and neuropsychiatric presentations associated with severe coronavirus infections: A systematic review and meta-analysis with comparison to the COVID-19 pandemic,” Lancet Psychiatry, vol. 7, no. 7, pp. 611–627, Jul. 2020. [DOI] [PMC free article] [PubMed] [Google Scholar]
- [3].World Health Organization. (2020). Depression. Accessed: Jun. 15, 2020. [Online]. Available: https://www.who.int/news-room/fact-sheets/detail/depression
- [4].Leis A., Ronzano F., Mayer M. A., Furlong L. I., and Sanz F., “Detecting signs of depression in tweets in spanish: Behavioral and linguistic analysis,” J. Med. Internet Res., vol. 21, no. 6, Jun. 2019, Art. no. e14199. [DOI] [PMC free article] [PubMed] [Google Scholar]
- [5].Maxim S., Ignatiev N., and Smirnov I., “Predicting depression with social media images,” in Proc. 9th Int. Conf. Pattern Recognit. Appl. Methods, 2020, pp. 32–40. [Google Scholar]
- [6].Tsugawa S., Kikuchi Y., Kishino F., Nakajima K., Itoh Y., and Ohsaki H., “Recognizing depression from Twitter activity,” in Proc. 33rd Annu. ACM Conf. Hum. Factors Comput. Syst., Apr. 2015, pp. 3187–3196. [Google Scholar]
- [7].Yang W. and Mu L., “GIS analysis of depression among Twitter users,” Appl. Geography, vol. 60, pp. 217–223, Jun. 2015. [Google Scholar]
- [8].Orabi A. H., Buddhitha P., Orabi M. H., and Inkpen D., “Deep learning for depression detection of Twitter users,” in Proc. 5th Workshop Comput. Linguistics Clin. Psychol., Keyboard Clinic, New Orleans, LA, USA, 2018, pp. 88–97. [Google Scholar]
- [9].Shen G.et al. , “Depression detection via harvesting social media: A multimodal dictionary learning solution,” in Proc. 26th Int. Joint Conf. Artif. Intell., Aug. 2017, pp. 3838–3844. [Google Scholar]
- [10].Zhou J., Yang S., Xiao C., and Chen F., “Examination of community sentiment dynamics due to covid-19 pandemic: A case study from Australia,” Jun. 2020, arXiv:2006.12185. [Online]. Available: http://arxiv.org/abs/2006.12185 [DOI] [PMC free article] [PubMed] [Google Scholar]
- [11].Li I., Li Y., Li T., Alvarez-Napagao S., Garcia-Gasulla D., and Suzumura T., “What are we depressed about when we talk about COVID19: Mental health analysis on tweets using natural language processing,” Jun. 2020, arXiv:2004.10899. [Online]. Available: http://arxiv.org/abs/2004.10899 [Google Scholar]
- [12].Yang S., Jiang J., Pal A., Yu K., Chen F., and Yu S., “Analysis and insights for myths circulating on Twitter during the COVID-19 pandemic,” IEEE Open J. Comput. Soc., vol. 1, pp. 209–219, 2020. [Google Scholar]
- [13].Zogan H., Wang X., Jameel S., and Xu G., “Depression detection with multi-modalities using a hybrid deep learning model on social media,” CoRR, vol. abs/2007.02847, pp. 1–23, Jul. 2020. [Online]. Available: https://arxiv.org/abs/2007.02847 [Google Scholar]
- [14].Wang X., Zhang C., Ji Y., Sun L., Wu L., and Bao Z., “A depression detection model based on sentiment analysis in micro-blog social network,” in Proc. Pacific–Asia Conf. Knowl. Discovery Data Mining. Berlin, Germany: Springer, 2013, pp. 201–213. [Google Scholar]
- [15].Shen T.et al. , “Cross-domain depression detection via harvesting social media,” in Proc. 27th Int. Joint Conf. Artif. Intell., Jul. 2018, pp. 1–7. [Google Scholar]
- [16].Mikolov T., Sutskever I., Chen K., Corrado G. S., and Dean J., “Distributed representations of words and phrases and their compositionality,” in Proc. Adv. Neural Inf. Process. Syst., 2013, pp. 3111–3119. [Google Scholar]
- [17].Gui T.et al. , “Cooperative multimodal approach to depression detection in Twitter,” in Proc. AAAI Conf. Artif. Intell., vol. 33, 2019, pp. 110–117. [Google Scholar]
- [18].Nguyen T. H. and Grishman R., “Relation extraction: Perspective from convolutional neural networks,” in Proc. 1st Workshop Vector Space Modeling Natural Lang. Process., Denver, CO, USA, Jun. 2015, pp. 39–48. [Google Scholar]
- [19].Galea S., Merchant R. M., and Lurie N., “The mental health consequences of COVID-19 and physical distancing: The need for prevention and early intervention,” JAMA Internal Med., vol. 180, no. 6, pp. 817–818, 2020. [DOI] [PubMed] [Google Scholar]
- [20].Huang Y. and Zhao N., “Generalized anxiety disorder, depressive symptoms and sleep quality during COVID-19 outbreak in China: A Web-based cross-sectional survey,” Psychiatry Res., vol. 288, Jun. 2020, Art. no. 112954. [DOI] [PMC free article] [PubMed] [Google Scholar]
- [21].Ni M. Y.et al. , “Mental health, risk factors, and social media use during the COVID-19 epidemic and cordon sanitaire among the community and health professionals in Wuhan, China: Cross-sectional survey,” JMIR Mental Health, vol. 7, no. 5, May 2020, Art. no. e19009. [DOI] [PMC free article] [PubMed] [Google Scholar]
- [22].Novak P. K., Smailović J., Sluban B., and Mozetič I., “Sentiment of emojis,” PLoS ONE, vol. 10, no. 12, Dec. 2015, Art. no. e0144296. [DOI] [PMC free article] [PubMed] [Google Scholar]
- [23].Blei D. M., Ng A. Y., and Jordan M. I., “Latent Dirichlet allocation,” J. Mach. Learn. Res., vol. 3, pp. 993–1022, Mar. 2003. [Google Scholar]
- [24].O’Connor E. A., Whitlock E. P., Gaynes B., and Beil T. L., “Screening for depression in adults and older adults in primary care: An updated systematic review,” Agency Healthcare Res. Qual., Rockville, MD, USA, Tech. Rep. Evidence Syntheses 75, Dec. 2009. [Online]. Available: https://www.ncbi.nlm.nih.gov/books/NBK36406/table/ch1.t1/ [PubMed] [Google Scholar]
- [25].Singh R.et al. , “A framework for early detection of antisocial behavior on Twitter using natural language processing,” in Proc. Conf. Complex, Intell., Softw. Intensive Syst. Cham, Switzerland: Springer, 2019, pp. 484–495. [Google Scholar]