

Abstract
Social media (and the world at large) have been awash with news of the COVID-19 pandemic. With the passage of time, news and awareness about COVID-19 spread like the pandemic itself, with an explosion of messages, updates, videos, and posts. Mass hysteria manifest as another concern in addition to the health risk that COVID-19 presented. Predictably, public panic soon followed, mostly due to misconceptions, a lack of information, or sometimes outright misinformation about COVID-19 and its impacts. It is thus timely and important to conduct an ex post facto assessment of the early information flows during the pandemic on social media, as well as a case study of evolving public opinion on social media which is of general interest. This study aims to inform policy that can be applied to social media platforms; for example, determining what degree of moderation is necessary to curtail misinformation on social media. This study also analyzes views concerning COVID-19 by focusing on people who interact and share social media on Twitter. As a platform for our experiments, we present a new large-scale sentiment data set COVIDSENTI, which consists of 90 000 COVID-19-related tweets collected in the early stages of the pandemic, from February to March 2020. The tweets have been labeled into positive, negative, and neutral sentiment classes. We analyzed the collected tweets for sentiment classification using different sets of features and classifiers. Negative opinion played an important role in conditioning public sentiment, for instance, we observed that people favored lockdown earlier in the pandemic; however, as expected, sentiment shifted by mid-March. Our study supports the view that there is a need to develop a proactive and agile public health presence to combat the spread of negative sentiment on social media following a pandemic.
Keywords: COVID-19, epidemic, misinformation, opinion mining, pandemic, sentiment analysis, text mining, Twitter
I. Introduction
Coronavirus disease (COVID-19) is a novel viral disease denoted by the year in which it first appeared [52]. The disease has affected many countries, with the battle to curtail its spread being waged in every country, even those countries with few or no infections. It was declared a pandemic on January 30, 2020, by the World Health Organization (WHO), an organization that is relentlessly trying to control it. The development of vaccines is eagerly anticipated and showing great promise [16]. As it stands, there is a lack of academic study on the topic to aid researchers, save for Bhat et al. [6] and Boldog et al. [8]. This hampers research findings on the consequences of COVID-19 on mental health or the study of the global economic implications.
Due to the emergence of bizarre conspiracy theories around COVID-19, social media platforms, such as Twitter, Facebook, Reddit, and Instagram, have been actively working on scrutinizing and fact-checking in order to combat the spread of misinformation. Misinformation is defined as a deliberate attempt to confuse/mislead the public with false information. This gives rise to the need to create analytic methods that could be rapidly deployed to understand information flows and to interpret how mass sentiment among the population develops in pandemic scenarios. There has not been comprehensive research on analyzing conspiracy communication trends on social media and cumulative personal-level information, with most studies presenting the analysis of preventive care and recovery, healthcare, social network, and economic data. Analyzing content posts on social media platforms, such as Twitter and Facebook, is a popular method to capture human emotional expression. Fears, numbers, facts, and the predominant thoughts of people as a whole, unsurprisingly, inundate the social media space, and this information, when analyzed, can reveal much about the prevailing mood and temperament of the broader human population.
The extraordinary increase of society’s dependence on social media for information, as opposed to traditional news sources, and the volume of data presented, has brought about an increased focus on the use of natural language processing (NLP) and methods from artificial intelligence (AI) to aid text analytics [5]. This information includes diverse social phenomena, such as cultural dynamics, social trends, natural hazards and public health, matters frequently discussed, and opinions expressed, by people using social media. This is because of its low cost and easy access and from the personal connectivity within the social network. Increasingly, social media is used by professional opinion leaders (and state actors) as a tool to amplify their message via its network effects. Many companies also use social media to promote products, brand names, and services [21]. Consequently, an information-rich reservoir is created by reviews and experiences shared by end users, and this information is stored as text, making platforms of open communication and social media salient information sources for researching issues concerning rapidly developing public sentiment [53]. Since there has not been a global pandemic in 100 years, this represents an opportunity to study a truly global phenomenon.
NLP and its application to the analysis of social media have experienced exponential growth. However, the challenges of deducing a text’s intrinsic meaning using NLP-methods are still problematic. It has been shown that even the most recent NLP technologies are “vulnerable to adversarial texts” [42], [43]. Thus, developing an understanding of the limitation of text classification method, as well as related algorithms in machine learning (ML), is imperative. It is also important to discover if there exists an effective combination of these technologies, by adapting a synergistic principle, to overcome these limitations. In so doing, the process could further advance the use of AI on human communication and in generating insights from the texts. Consider the following tweets1 where users are expressing sentiment related to COVID-19.
-
1)
Happy New Year. May the Year of the Rat bring you good fortune, cheese in abundance, and immunity to the coronavirus.
-
2)
Watching breaking news about the Corona Virus 200 infecteds now! Very sad.
-
3)
What are symptoms of coronavirus and where has it spread?
-
4)
Experts are warning that the new Coronavirus is worse than SARS.
-
5)
The coronavirus killed Mr. Peanut.
The above examples illustrate the opinion and sentiments of Twitter users related to COVID-19. The role of sentiment analysis comes into play, focusing on developing efficient algorithmic processes for the automatic extraction of the writer’s sentiment as conveyed in the text. Relevant efforts focus on tracking the sentiment valence (or polarity) of single utterances, in the form of short text posts, which, in most cases, are loaded with subjectivity and uncertainty. Adding further complexity is that the forms of language used in social media, such as Twitter, are not normalized, and its utterances tend to breach vocabulary and grammar conventions; they are unstructured, syntactically eccentric, and often very informal. Users write using their own made-up words and jargon; they use abbreviations, nonstandard punctuation, incorrect spelling, emoticons, slang, idioms, and abbreviations and frequently include URLs in posts. The absence of facial expressions, visual, and tone-of-voice cues, means that context-aware approaches to leverage ambiguity are absent or ineffective.
Twitter data are presented in this research as the source for textual analysis. Its use is in identifying public sentiment and, particularly, to track the growth of fear linked to COVID-19. Custom approaches to identifying constructs like dominant behavior exhibited in electronic chats have been explored in past studies, which show the potential to enhance analyses by accelerating automated sentiment classification using NLP-techniques. Sentiment identification, COVID-19 and similar crisis scenario trends, and keyword association, specific to Twitter data analysis, are analyzed using a methodological approach that this research outlines. The search for insights using data visualization, such as in Figs. 1 and 4, and descriptive text analytics is also presented.
Fig. 1.

Word cloud of the extracted tweets.
Fig. 4.
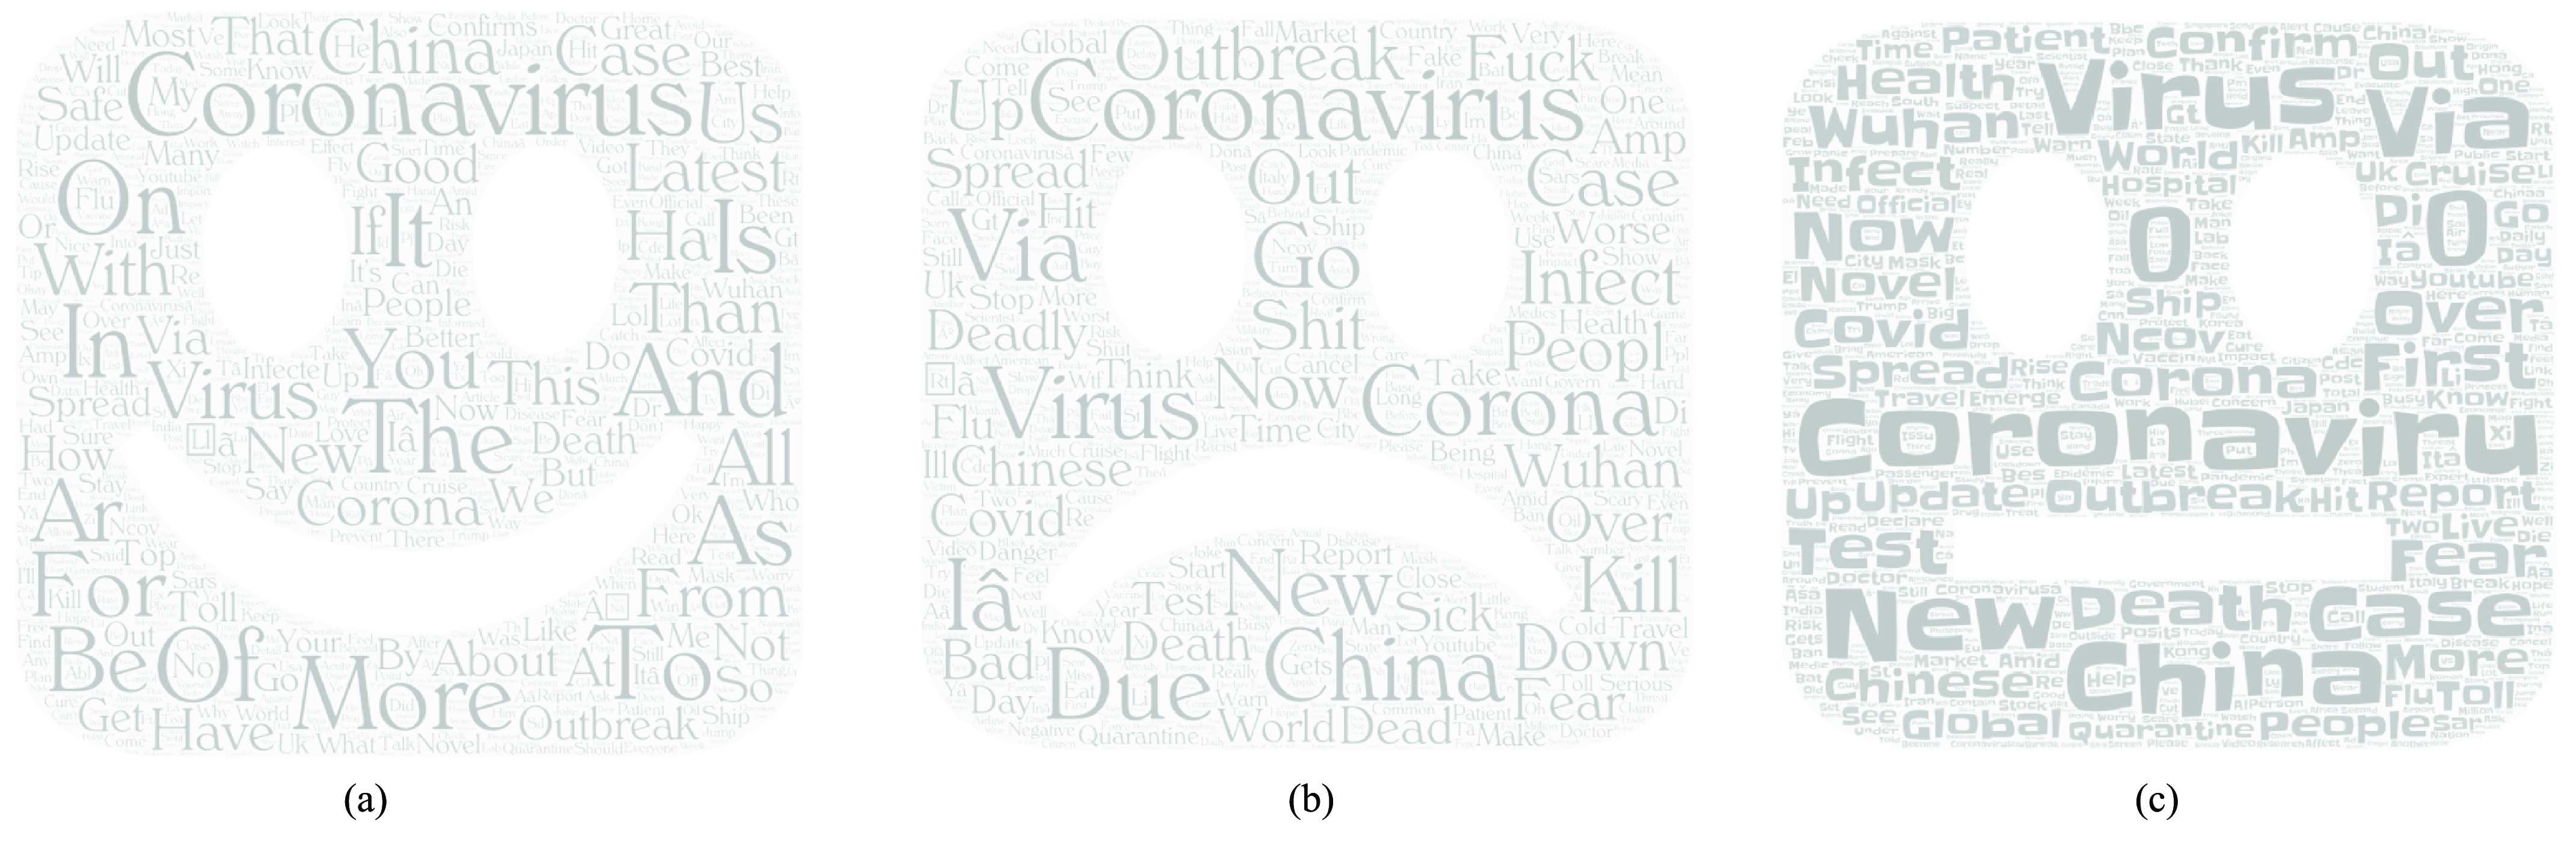
Word cloud of (a) positive, (b) negative, and (c) neutral tweets.
A discussion and comparison of textual classification mechanisms are one of the contributions of this study; these mechanisms are based on deep learning (DL) and ML methods, which are generally used in AI applications for NLP, but in this research, contextualized specifically in making tweet sentiment classifications through the use of ML.
Various studies in the past have indicated that pandemics and disease outbreaks could be controlled if the relevant experts considered the data posted by the public [49]. During the lockdown from COVID-19, people took to social media to express their feelings, find information, and also calm themselves. Therefore, social media creates the possibility to analyze public sentiment and its dynamic during the pandemic, revealing insights into prevailing sentiment and its network effects. Recently presented studies focused on automatic identification of tweets posted about COVID-19 [27], [44], [48], [56]. However, less work is available on both the topic and its sentiment considered together. The analysis of topic and sentiment provides insights on understanding the mental health of the broader population.
This study aims to identify the topics and the community sentiment dynamics expressed on Twitter about COVID-19. The research questions we address are: 1) how to automatically detect people’s sentiments expressed on Twitter due to COVID-19 and 2) what topics are mostly discussed by the Twitter users while expressing sentiments about COVID-19? To answer these questions, we collected a novel labeled data set on COVID-19-related tweets and present an exploratory analysis of the data set and topic discovery and sentiment detection using NLP.
Streaming Twitter data were collected using the Twitter API from February to March 2020, and sentiment identified from the collected tweets was labeled into three categories: those containing positive, negative, and neutral tweets. Sentiment spread analysis on tweets related to COVID-19 is provided to balance the classes with equal numbers in each labeled class. Different algorithmic models are used to train and validate the data set to provide the baselines for detecting sentiment related to prospective COVID-19 treatments spread on Twitter. Through a final verification analysis, the best performing model is selected to optimize and promote. We conclude that future work must better account for context and the heterogeneity in sentiment related to COVID-19 treatments. The key contributions of this work are as follows.
-
1)
A large-scale manually annotated COVID sentiment data set was developed, named COVIDSenti consisting of 90 000 tweets crawled from February to March 2020. The data set consists of three equal-sized subdata sets. Each tweet is labeled into one of the three sentiment classes: positive, negative, or neutral. The data sets are publicly available for research community.2
-
2)
Demonstration of how public sentiments concerning Coronavirus were traced; sentiment analysis was used on the Twitter data to build a classifier and we developed a visualization of the content that is present in textual data. In addition to this, a word cloud of most common words is presented to provide qualitative analysis.
-
3)
Indicative topics are extracted, and we present and discuss the dominant discourse of public concern about COVID-19. Findings of this study could assist governments worldwide in planning effective public health responses.
-
4)
Performance of different state-of-the-art ML text classification mechanisms was benchmarked, and baseline results for each are discussed.
The remainder of this article is structured as follows. Section II presents the related work. Section III explains the proposed methodology this article follows. Results are presented in Section IV, and finally, in Section V, conclusions are presented.
II. Related Work
Numerous sources spanning various academic disciplines inform this article, and as such, in this section, the literature review for sentiment analysis and textual analytics is presented, as well as that on ML methods, twitter and NLP. Significant data challenges are evolving and need to be addressed, and strategic information characteristics restructuring data, as well as the ML techniques, are necessary tools [46]. The evocation and analysis of characters, visualizations of text, semantics, and syntactic are what textual analytics deals with [46], as well as associated exogenous and endogenous features of these tools.
Over the years, text analysis has been used in various applications: email filtering [10], irony and sarcasm detection [33], document organization [19], sentiment and opinion mining prediction [30], [37], hate speech detection [29], [35], question answering systems [18], content mining [1], biomedical text mining [31], [32], and more. Twitter data have seen wide usage for emotional analysis [3], [9], [41]. In other work, more than 70 000 tweets made over a year were used in a study analyzing customer feedback of a French Energy Company [38]. Interesting insights were hidden in plain sight due to the massive volume of data retrieved and analyzed using a latent Dirichlet allocation (LDA) algorithm conducted by frequency-based filtering techniques. Tweet popularity has also been explored using negative binomial as well as Poisson models [45]. The relationship between topics is also evaluated in that study. Seven dissimilarity measures are used. It is discovered that in identifying useful user-based interactive approach-related topics, Kulliback–Leibler and Euclidean distances achieve the best performance. Prior research applied the time-aware knowledge extraction (TAKE) methodology [2]. Studies concerning information systems that develop designs for human-trait identification, such as dominance in electronic communication, using textual analysis have also used similar research. Assessment of another finds great utility in content selection, product positioning, information retrieval, and user psychological assessment. Prior research has also featured the use of linguistic and psychological analysis in the extraction of emotion from multilingual social media posts [23].
The analysis of past epidemics, crisis situational analysis and tracking, has also involved tracking Twitter data [17], [25], [55]. A better understanding of the US’s geographical spread concerning the valances of both healthy and unhealthy food sentiment is studied by Widener and Li [53]. The authors showed that people in rural areas tweet less than those in urban areas and suburbs, using the spatial distribution of analyzed tweets. This work also notes that food tweets per capita were less in small urban areas than in larger towns and cities. It was revealed using logistic regression that in low-income areas, tweets related more to unhealthy food. Healthcare sentiment analytics has also had avenues for the use of Twitter data. Postnatal behavioral changes and the moods of new mothers are investigated by De Choudhury et al. [13]. They used Twitter posts to evaluate any postnatal change, for example, linguistic style, emotion, social network, and social engagement, showing that data from Twitter can be useful in finding mothers prone to postnatal depression. Twitter data related to supply chain management (SCM) has been analyzed by new analytical frameworks as well, providing salient insights that enhance SCM research and practices [12]. Using 22 399 SCM tweets, content analysis that integrated sentiment analysis, and text mining was conducted, as was descriptive analysis and network analytics. An efficient platform called MISNIS (intelligent Mining of Public Social Networks’ influence in Society) is presented by Carvaho et al. [11]. This served for collecting, storing, managing, mining, and visualizing Twitter data.
Regarding research in social media, Lopez et al. [27] ventured into the government policies implemented concerning the COVID-19 pandemic and general discourse around the pandemic topic. Multiple language Twitter data from different countries are text-mined to identify popular policy responses during the pandemic. In the same way, text mining was also used by Saire and Navarro [44]; they aimed to show the epidemiology of COVID-19, as shown via press publications in Bogota, Colombia. They intuited that the number of infected people correlated positively with the number of tweets. Schild et al. [48] looked into the evolution of sinophobia resulting from the pandemic by inspecting two sources, 4Chan and Twitter.
Kaila et al. [39] presented a study on COVID-19 topic modeling generating the top-10 topics from a random sample of 18 000 tweets on COVID-19. The authors also calculated the emotions using the NRC sentiment lexicon. In another study, Han et al. [20] presented a study on the sentiment of the people in China on COVID-19. They categorized COVID-19-related posts into seven topics with further division into 13 more subtopics. Depoux et al. [14] demonstrated that panic created by people posting on social media is more likely to spread faster than that of COVID-19. Hence, such rumors, sentiments, and public behavior need to be detected and responded to as soon as possible by the experts and relevant authorities. Recently, Huang and Carley [22] explored the public emotions and discussion on COVID-19 on Twitter and found that the regular Twitter users’ posts are the most influential. Unlike the work mentioned above, in this article, we presented a novel data set and the public’s most common topic in their posts. We provided benchmarked results to identify sentiment using NLP automatically.
III. Methodology
The overview of our proposed framework is shown in Fig. 2, with each component of the framework explained in the following.
Fig. 2.

Overview of the proposed framework.
A. COVIDSenti Data Collection and Labeling
Out of approximately 2.1 million tweets crawled from February to March 2020, we included 90 000 unique tweets from 70 000 users that met the selection criteria. Our analysis identified 12 topics, such as quarantine, lockdown, and stay home. COVIDSENTI was divided equally into three subdata sets of COVIDSENTI- A, COVIDSENTI- B, and COVIDSENTI- C, respectively, of positive, negative, or neutral sentiments. The data set (tweets) has been collected by using Tweepy, an official Python Twitter API library.
1). Selection Criteria:
COVIDSenti contains two months’ worth of tweets. Our search was limited to tweets in English. The keywords used ensured a textual corpus focused on the COVID-19 and associated phenomena. Keywords used to collect the tweets are given in Table I.
TABLE I. Keywords Used to Collect Tweets.
| Keywords used to collect tweets |
|---|
| Coronoavirus |
| Corona |
| Covid |
| COVID-19 |
| Pandemic |
| Corona Outbreak |
| Coronavirus Outbreak |
| Stay home |
| Coronavirus pandemic |
| Lockdown |
| Social distance |
| Quarantine |
2). Labeling:
In order to annotate the data set, we followed guidelines by Bandi and Fellah [4] and labeled each tweet as positive, negative, or neutral. The TextBlob tool3 was used for the purpose of labeling the emotional sentiment into positive, negative, and neutral. According to Bandi and Fellah [4], TextBlob can indicate a sentence’s attitude by calculating the score as a polarity [−1 to 1]. When the polarity of a tweet is less than −0.4, its sentiment is regarded as negative. Symmetrically, when it is greater than 0.4, the tweet is considered positive. The polarity of a neutral tweet lies in the range from −0.4 to 0.4. The pseudocodes of tweets labeling and sentiment are given in Algorithm 1
 |
where
 is the polarity of tweet
 and
and
 .
.
Algorithm 1 Tweets Labeling Steps
-
Input:
 :
:
 ,
, -
Output:
 :
:
 ,
, Compute:
Positive:
 ;
;Negative:

Neutral:

Steps:
for t in T(t) do:
If (t is English):
Perform Labeling: (TextBlob)
If (−1 < polarity of
 −0.4):
Labeled as Negative
If (0.4 < polarity of
 ):
):Labeled as Positive
else:
Labeled as Neutral
Perform Pre-processing:
Remove punctuation, stop-words,
stemming, and lower-case all words
else:
Delete

end for
Output:
Pre-processed labeled Tweets:

As previously stated, the data set consists of 90 000 tweets. It is further divided into three equal-sized subsets named COVIDSENTI- A, COVIDSENTI- B, and COVIDSENTI- C in each sentiment class for evaluation and generalization purposes. The tweet distribution is given in Table II.
TABLE II. Data Set Distribution.
| Data set\Label | Positive | Negative | Neutral | Total |
|---|---|---|---|---|
| COVIDSenti-A | 1,968 | 5,083 | 22,949 | 30,000 |
| COVIDSenti-B | 2,033 | 5,471 | 22,496 | 30,000 |
| COVIDSenti-C | 2,279 | 5,781 | 21,940 | 30,000 |
| COVIDSenti | 6,280 | 16,335 | 67,835 | 90,000 |
CoVIDSenti-A consists of most of the tweets related to government action against COVID-19. For example, @Username “I don’t trust our government at all. I get my news on Coronavirus from o/s sources.4” COVIDSenti-B consists of tweets related to the COVID-19 crises, social distancing, lockdown, and stay at home. Thus, it mainly covers the temporal change in people’s behavior based on the number of cases, panic-inducing information, and so on. For example, “Coronavirus goes parabolic. China: shut everything down, stay home.5” COVIDSenti-C consists of tweets related to COVID-19 cases, outbreak, and stay at home. Thus, it mainly exhibits the patterns of the behavior of people in response to an increase in the number of cases. “The 1000 point Dow drop today is speculative, just fears of how bad the coronavirus outbreak will get.6” Examples of labeled tweets are given in Fig. 3.
Fig. 3.
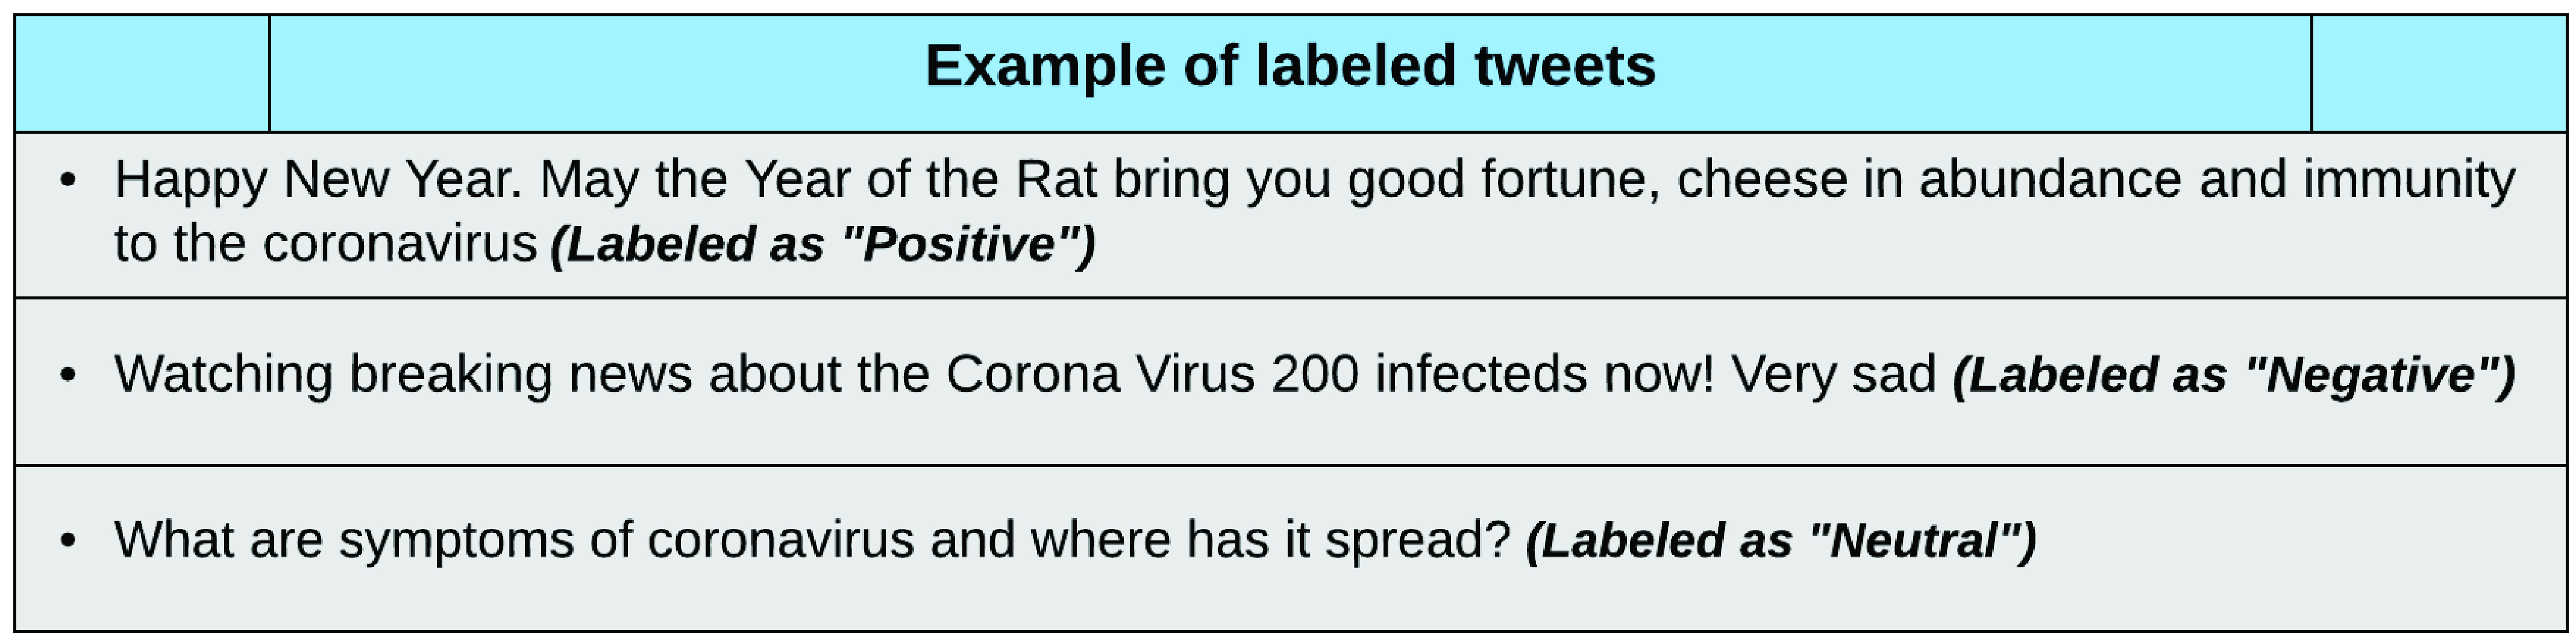
Example of labeled tweets in COVIDSenti.
B. Preprocessing
As raw tweets are often short, unstructured, informal, and noisy, the first step of sentiment analysis is to preprocess the data [34]. To do so, the following series of techniques are applied in the given order to improve the text.
-
1)
Almost every social media platform uses hashtags to represent topics, i.e., #COVID-19, #StayHome, #StaySafe, and #Coronavirus. In most cases, hashtags are unnecessary to sentiment and can affect the performance. Thus, in our first step, we performed basic cleaning of the text by removing unnecessary hashtags, just the hashtag character not the hashtag text.
-
2)
The second step is to case-fold the text. To avoid recognizing the same word as a different word due to capitalization, we fold all capitalized letters to lower case.
-
3)
There are many words that are concatenated in other words, especially the words that are hashtagged such as “stayathomestaysafe” and “coronavirus,” should be “stay home stay safe” and “corona virus,” respectively. Hence, we perform word segmentation to achieve this.
-
4)
Removing stop words is a popular method to reduce the noise in textual data. Removing stop words does not affect understanding a sentence’s sentiment valence. For all but sentiment analysis, we removed stop words (words commonly found in a document of little semantic value, e.g., “for,” “the,” and “is”).
-
5)
The fifth step is lemmatization that processes the morphological analysis of words and returns words to the base or dictionary form. We used the method provided in nltk and lemmatized words (changing different forms of a word to its basic root form, e.g., “viruses” to “virus” or “went” to “go”).
-
6)
Textual data analysis was first held to eliminate hyperlinks, @mentions, and punctuation. We remove special characters, punctuation, and numbers from the data set as these do not help detect sentiment.
C. Exploratory Analysis
In this section, we conduct exploratory analysis to obtain a more comprehensive view of our data set.
1). Keyword Trend Analysis:
We first performed keyword trend analysis on our preprocessed corpus to find out the most frequently mentioned words. We found that people are talking about coronavirus cases, the coronavirus outbreak, social distancing, the coronavirus pandemic, the crises due to coronavirus, and staying at home. Statistics on the TOP-10 frequently used keywords are collected, and the results are shown in Table III. The word cloud of the most common words in positive, negative, and neutral tweet classes and Top Hashtags used in our corpus are shown in Figs. 4 and 5.
TABLE III. TOP-10 Frequent Words From Tweets in the COVIDSenti Data Sets.
| Keywords | Count |
|---|---|
| Corona | 87,661 |
| Coronavirus | 78,459 |
| Covid 19 | 26,239 |
| Coronavirus cases | 16,638 |
| Coronavirus outbreak | 7,419 |
| Social distance | 5,768 |
| Positive coronavirus | 3,413 |
| Coronavirus pandemic | 3,125 |
| Coronavirus crises | 1,981 |
| Stay home | 1,181 |
Fig. 5.

Top hashtags in the COVIDSenti data set.
2). Topic Modeling:
To quantitatively analyze the topics in our data set, we explore the topic distributions with LDA [7]. LDA is an algorithm for topic modeling, which means that a text is created from a mixture of topics. After the LDA learning, topics described by the distribution of words and the topic distribution of the documents are learned. In LDA, we set the number of topics as six. Topics represented by a distribution of words and the topic distributions of the documents are learned after LDA training. The word cloud of words within top six topics and distribution of top-six dominant topics in the corpora using LDA is shown in Figs. 6 and 7, respectively. This quantitative result of LDA is in-line with the visualization of word cloud generated using keyword analysis in Fig. 4. The Top-10 words in the top-6 topics generated using the LDA model are given in Table IV.
Fig. 6.
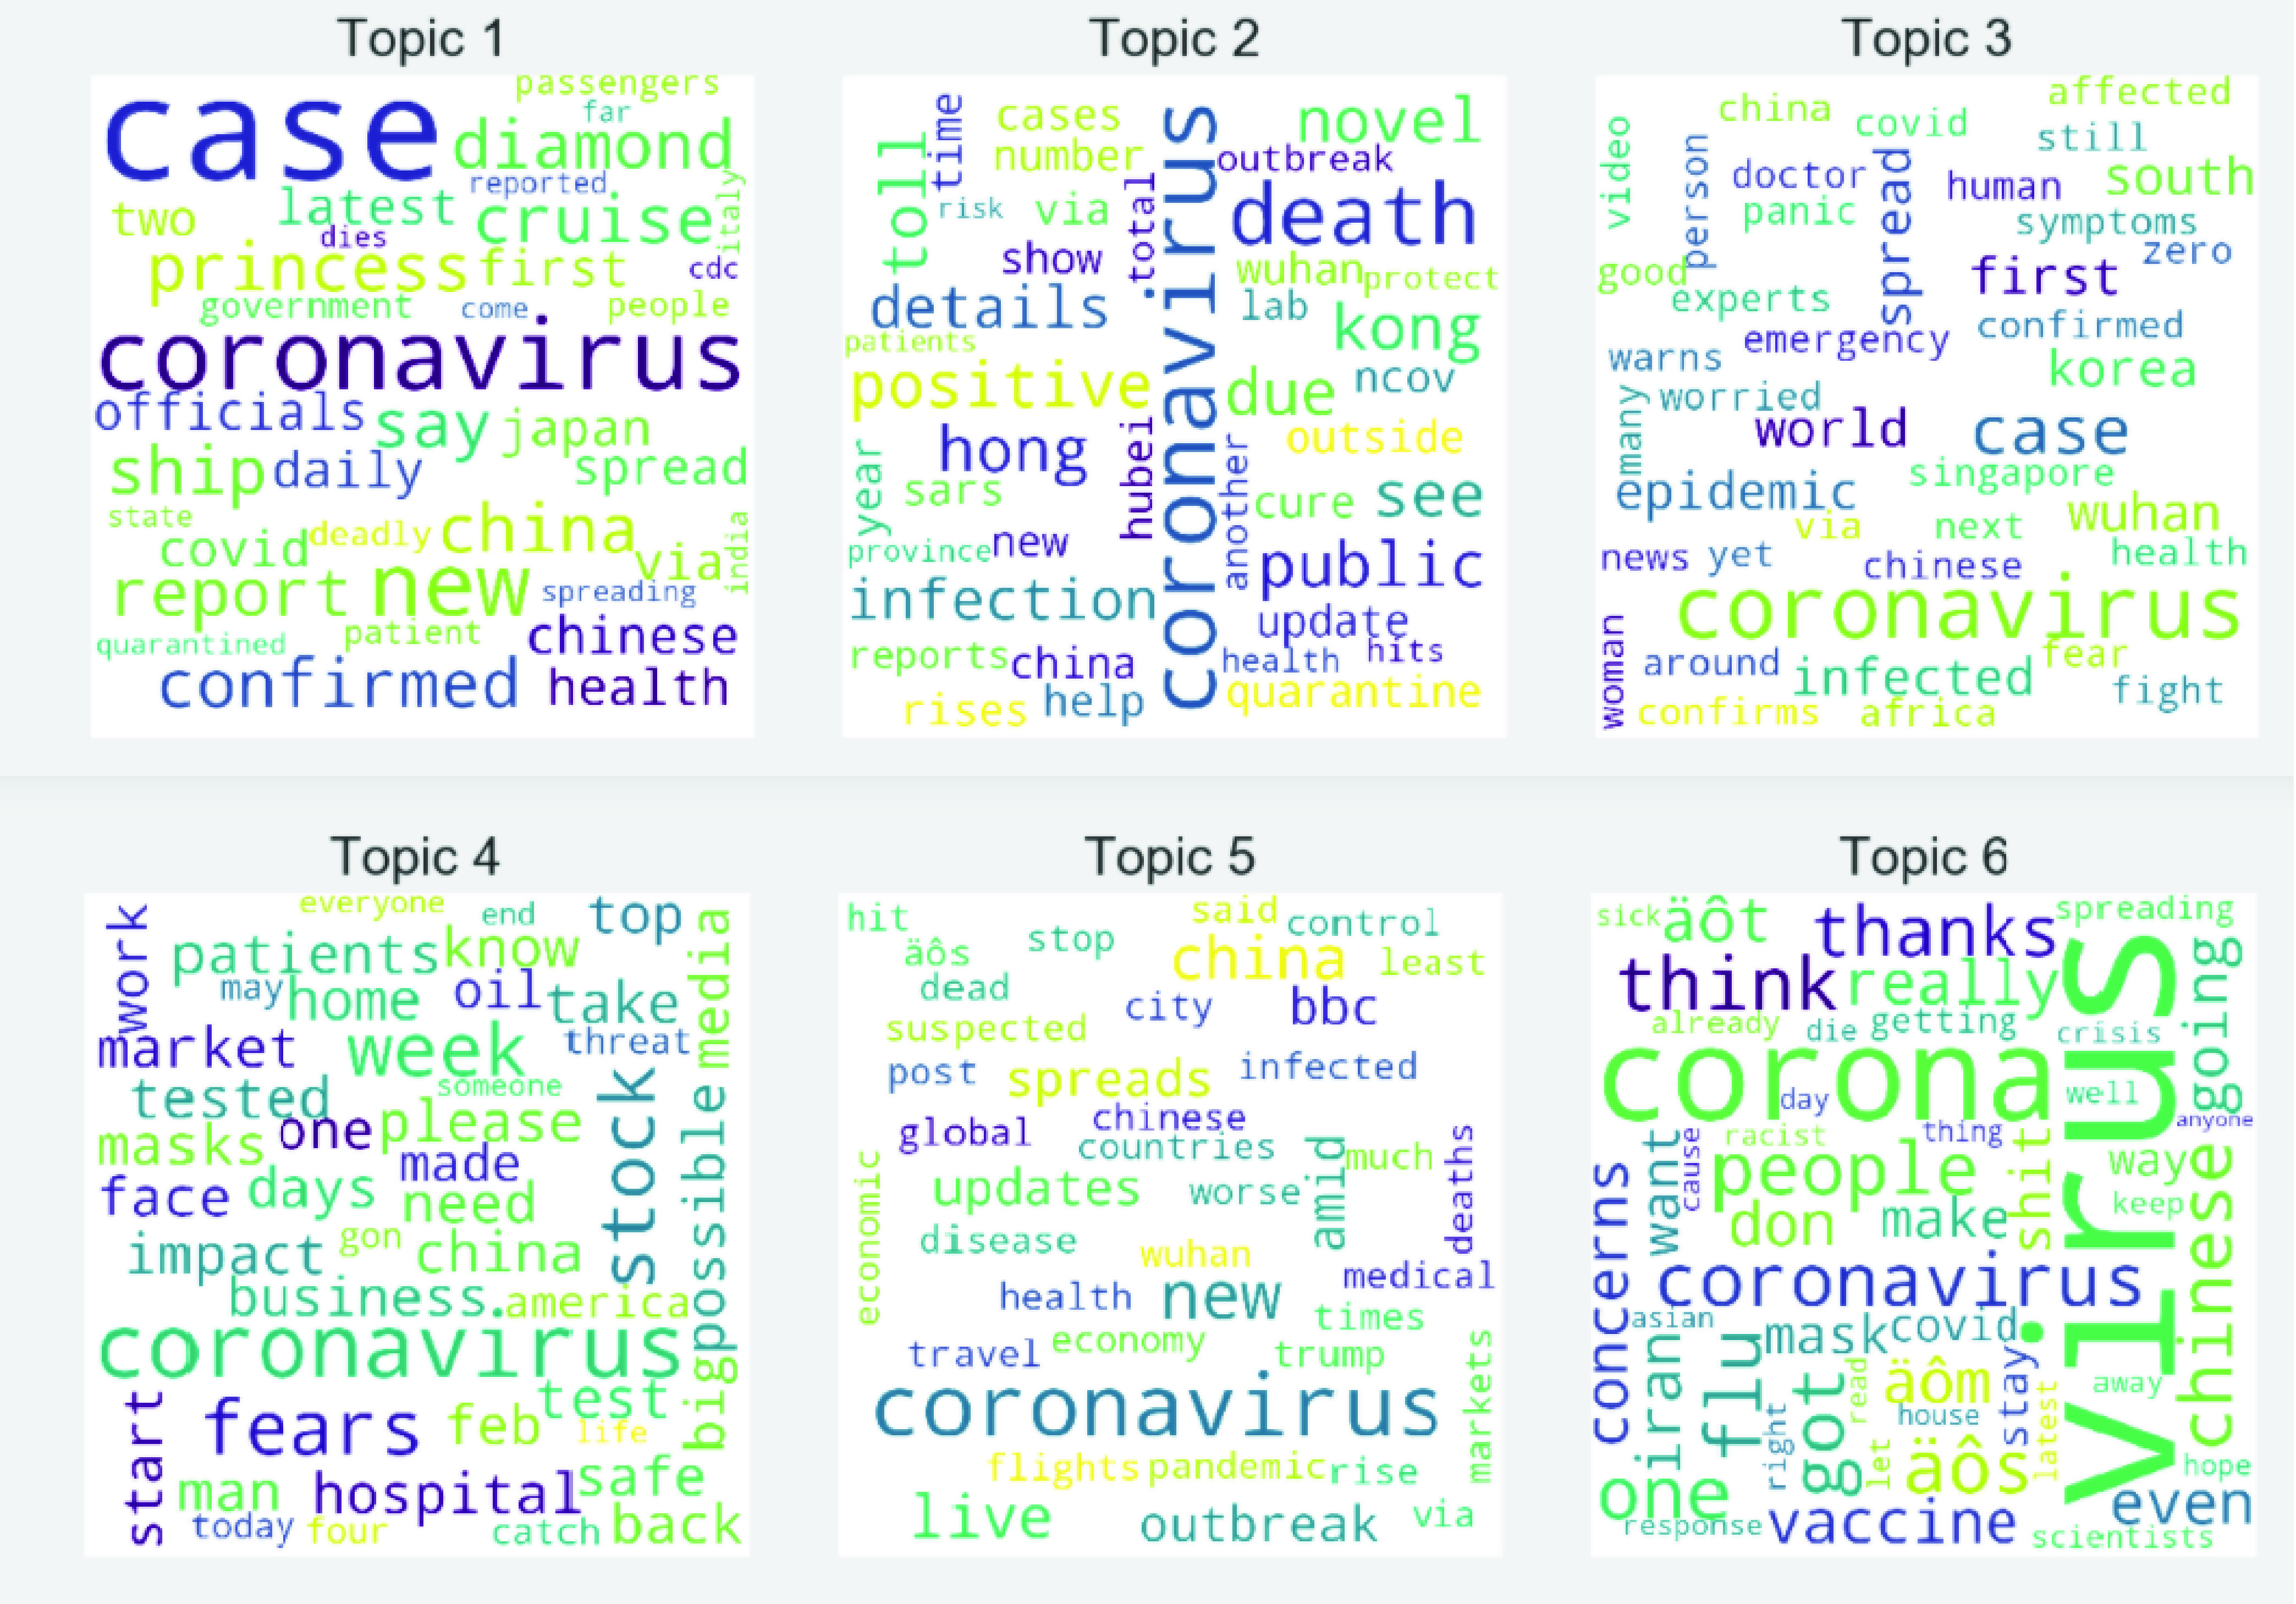
Word cloud of top six topics.
Fig. 7.

Distribution of dominant topics.
TABLE IV. Top Ten Words in Top-6 Topics.
| Topic 1: | coronavirus | cases | new | says | confirmed | china | cruise | ship | coronavirus cases | covid |
|---|---|---|---|---|---|---|---|---|---|---|
| Topic 2: | coronavirus | china | death | novel | toll | due | novel coronavirus | death toll | wuhan | see |
| Topic 3: | coronavirus | world | like | wuhan | case | first | spread | wuhan coronavirus | south | emergency |
| Topic 4: | coronavirus | get | fears | know | hospital | coronavirus fears | impact | need | test | patients |
| Topic 5: | coronavirus | outbreak | china | coronavirus outbreak | trump | global | news | chinese | amid | live |
| Topic 6: | virus | corona | corona virus | coronavirus | people | flu | mask | got | think | one |
3). Sentiment Timeline With COVID-19 Progression:
The Sentiment timeline helps to understand trends in positive and negative sentiment over time. As shown in Fig. 8, people expressed their negative sentiments more often compared to positive sentiment in relation to COVID-19. It is clear from the trend that the intensity and count of negative sentiment where high before mid of March 2020. The count and intensity of negative sentiments dropped and shifted after mid of March 2020 as people began to favor lockdown and social distancing policies enforced by the authorities. This change in sentiment indicates the acceptance of the COVID-19 pandemic and the acceptance of government policies enforced to contain it.
Fig. 8.
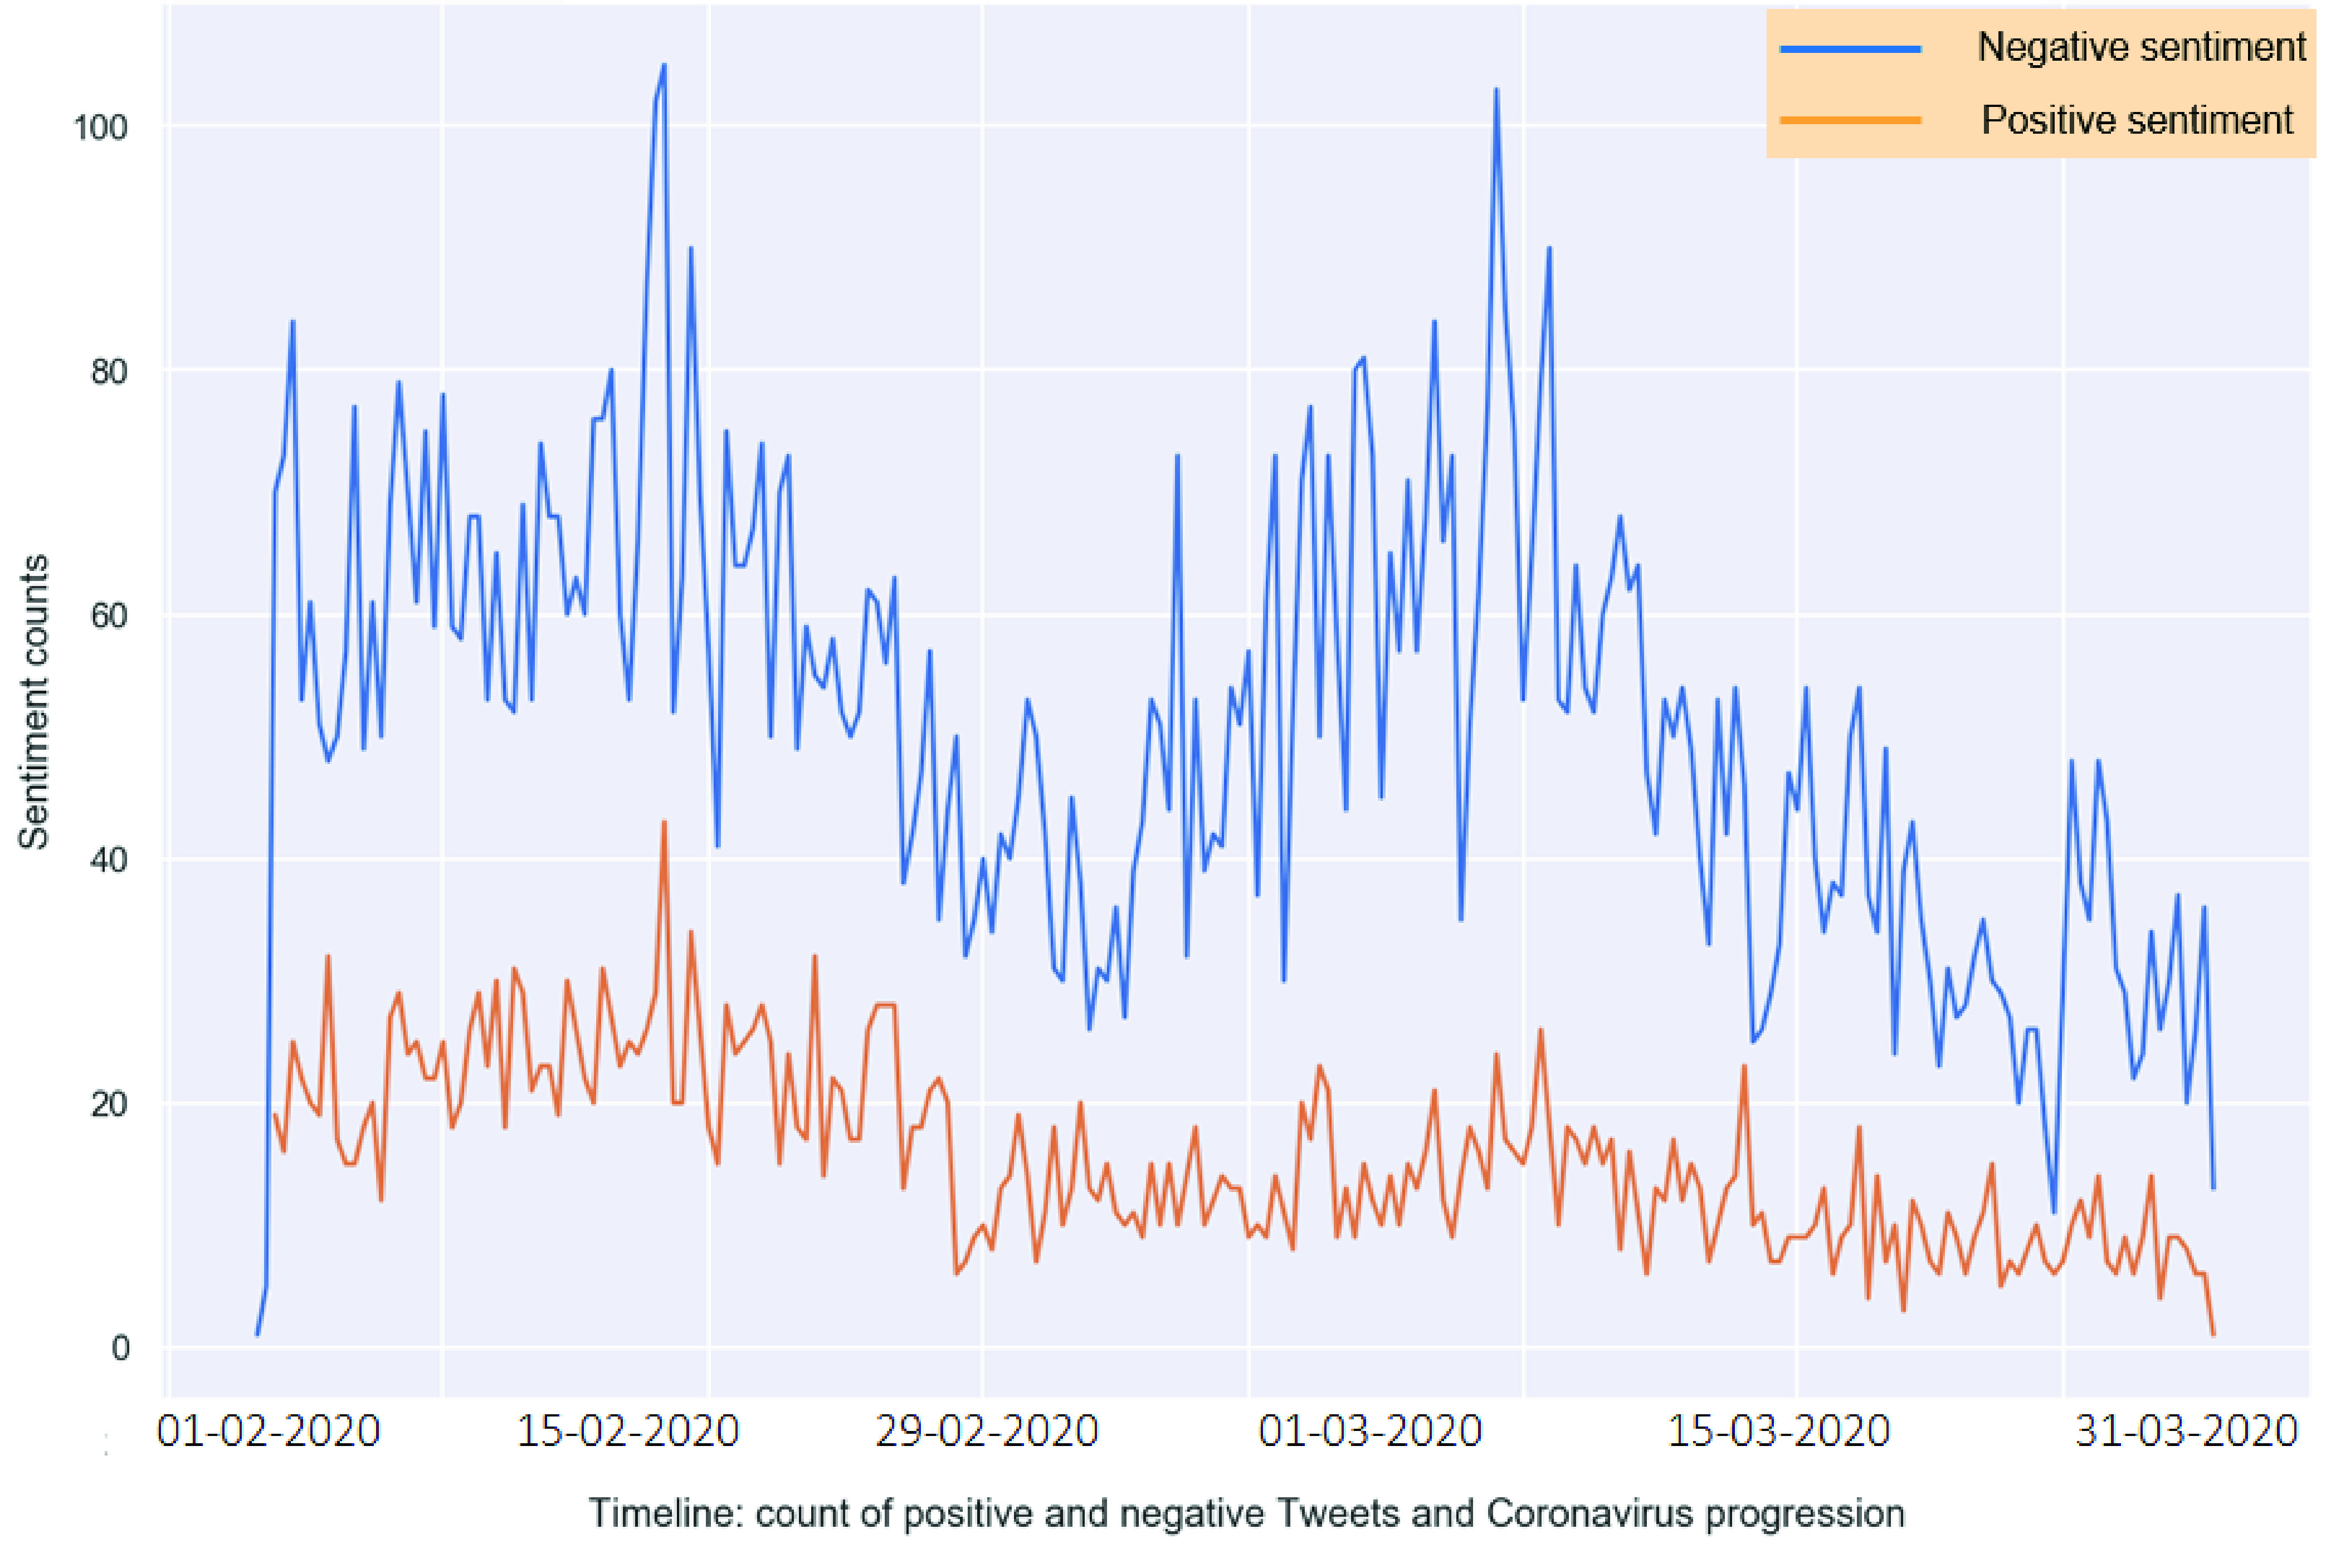
Timeline: sentiments with COVID-19 progression.
D. Feature Extraction
In this experiment, vectorization techniques and word embeddings are used for feature extraction. Term frequency-inverse document frequency (TF-IDF) has been used for vectorization. Similarly, for word embeddings, pretrained Word2Vec, GloVe, and fastText embeddings trained on Common Crawl and Wikipedia are used and have 300-D vectors. In addition, we used hybrid models, such as hybrid ranking (HyRank) and Improved Word Vector (IWV), that incorporate sentiment and context of tweets for Twitter sentiment analysis [36].
We have also used current state-of-the-art language models (LMs) that have altered NLP research’s landscape. We used transformer-based models [51], such as bidirectional encoder representations from the transformer (BERT) [15] and a distilled version of BERT (DistilBERT) [47], which reduces the size of a BERT LM by 40% while retaining 97% of its language understanding proficiency and is 60% quicker, XLNET, also known as generalized autoregressive pretraining for language understanding [54], which proposes a new task to predict the bidirectional context instead of the masked language task in BERT. It is a permutation language in which we make some permutations of each sentence, so two contexts are taken into consideration. To maintain the position information of the token to be expected, the authors employed two-stream self-attention. XLNET was presented to overcome the issue of pretraining fine-tune discrepancy and to include bidirectional contexts simultaneously and A Lite Bidirectional Encoder Representations from Transformers (ALBERT) [26] that is modified based on the architecture of BERT. In scaling pretrained models, ALBERT implements two-parameter reduction methods that lift the essential barriers: 1) factorize embedding parameterization—decomposing a big vocabulary embedding matrix to two small matrices; 2) replace the next sentence prediction (NSP) loss by sentence order prediction (SOP) loss; and 3) provide cross-layer parameter sharing, which are trained using bidirectional transformer models on large-scale unlabeled text corpus using mask language modeling (MLM), NSP, and SOP algorithms. These transformer-based models differ in how the training methods are used. However, generally, all training is performed in an unsupervised manner to generate an LM used as an input to the subsequent supervised fine-tuning for NLP-tasks. Transformer-based models are trained on large volumes of data. This is why they can capture more context enriched word representations than traditional and noncontextual word representation methods.
E. Classification
To provide a comprehensive analysis, we used ML- and DL-based classifiers to gauge performance in the sentiment classification task. ML-based classifiers, such as support vector machine (SVM), naive Bayes (NB), decision tree (DT), and random forest (RF), are employed in our analysis. In addition to traditional ML, we have also applied two DL-based classifiers, namely convolutional neural network (CNN) and bidirectional long-short term memory (Bi-LSTM). For regularization, L2 has been used, whereas the optimizer was Adam [28]. Our CNN consisted of three convolutional layers, and after each layer, a max pool of filter size three has been applied followed by a flattening layer to reshape the input size and a dropout layer with a rate of 0.5. Finally, a dense layer followed by an output layer, softmax used as the activation function. In our experiments, four BiLSTM cells with different numbers of hidden nodes are used. After the first BiLSTM layer, a dropout of 0.5 is used for regularization, and again, a dropout of 0.25 is used after three BiLSTM layers. The BiLSTM cell’s output is connected to dense layers with ReLU as an activation function and followed by a softmax activation function.
IV. Results and Discussion
This section presents the experimental step used to evaluate the performance on benchmark data sets and provide benchmarked results for the purpose of comparison. We used accuracy and a tenfold cross validation. The baseline results are reported using various ML, DL, and hybrid methods. Results are summarized in Tables V–IX and plotted in Fig. 9.
TABLE V. Comparison of ML Classifiers With TF-IDF.
| Machine Learning Classifiers with TF-IDF. | |||||
|---|---|---|---|---|---|
| ModelsDatasets | COVIDSenti-A | COVIDSenti-B | COVIDSenti-C | COVIDSenti | |
| TF-IDF | SVM | 0.839 | 0.830 | 0.828 | 0.845 |
| RF | 0.836 | 0.828 | 0.821 | 0.841 | |
| NB | 0.765 | 0.750 | 0.731 | 0.773 | |
| DT | 0.781 | 0.768 | 0.753 | 0.794 | |
TABLE VI. Comparison of ML With Word Embeddings.
| Machine Learning Classifiers with Word Embeddings. | |||||
|---|---|---|---|---|---|
| ModelsDatasets | COVIDSenti-A | COVIDSenti-B | COVIDSenti-C | COVIDSenti | |
| Word2Vec | RF | 0.764 | 0.732 | 0.753 | 0.769 |
| DT | 0.762 | 0.745 | 0.741 | 0.766 | |
| GloVe | RF | 0.716 | 0.702 | 0.722 | 0.726 |
| DT | 0.693 | 0.689 | 0.694 | 0.701 | |
| FastText | SVM | 0.801 | 0.792 | 0.783 | 0.815 |
| NB | 0.732 | 0.745 | 0.721 | 0.735 | |
| RF | 0.823 | 0.841 | 0.802 | 0.845 | |
TABLE VII. Comparison of DL Classifiers With Word Embeddings.
| Deep Learning Classifiers with Word Embeddings. | |||||
|---|---|---|---|---|---|
| Models\ Data sets | COVIDSenti-A | COVIDSenti-B | COVIDSenti-C | COVIDSenti | |
| Word2Vec | BiLSTM | 0.765 | 0.745 | 0.749 | 0.769 |
| GloVe | BiLSTM | 0.768 | 0.729 | 0.743 | 0.771 |
| DCNN- (Glove+ CNN) | 0.834 | 0.832 | 0.864 | 0.869 | |
TABLE VIII. Comparison of Hybrid Models.
| Hybrid Model | ||||
|---|---|---|---|---|
| Models\Data sets | COVIDSenti-A | COVIDSenti-B | COVIDSenti-C | COVIDSenti |
| IWV | 0.763 | 0.749 | 0.735 | 0.771 |
| HyRank | 0.854 | 0.865 | 0.877 | 0.881 |
TABLE IX. Comparison of Transformer-Based LMs.
| Fine-tuning of Transformer based language models | ||||
|---|---|---|---|---|
| Models\Data set | COVIDSenti-A | COVIDSenti-B | COVIDSenti-C | COVIDSenti |
| distilBERT | 0.937 | 0.929 | 0.926 | 0.939 |
| BERT | 0.941 | 0.937 | 0.932 | 0.948 |
| XLNET | 0.924 | 0.914 | 0.920 | 0.933 |
| ALBERT | 0.914 | 0.920 | 0.910 | 0.929 |
Fig. 9.
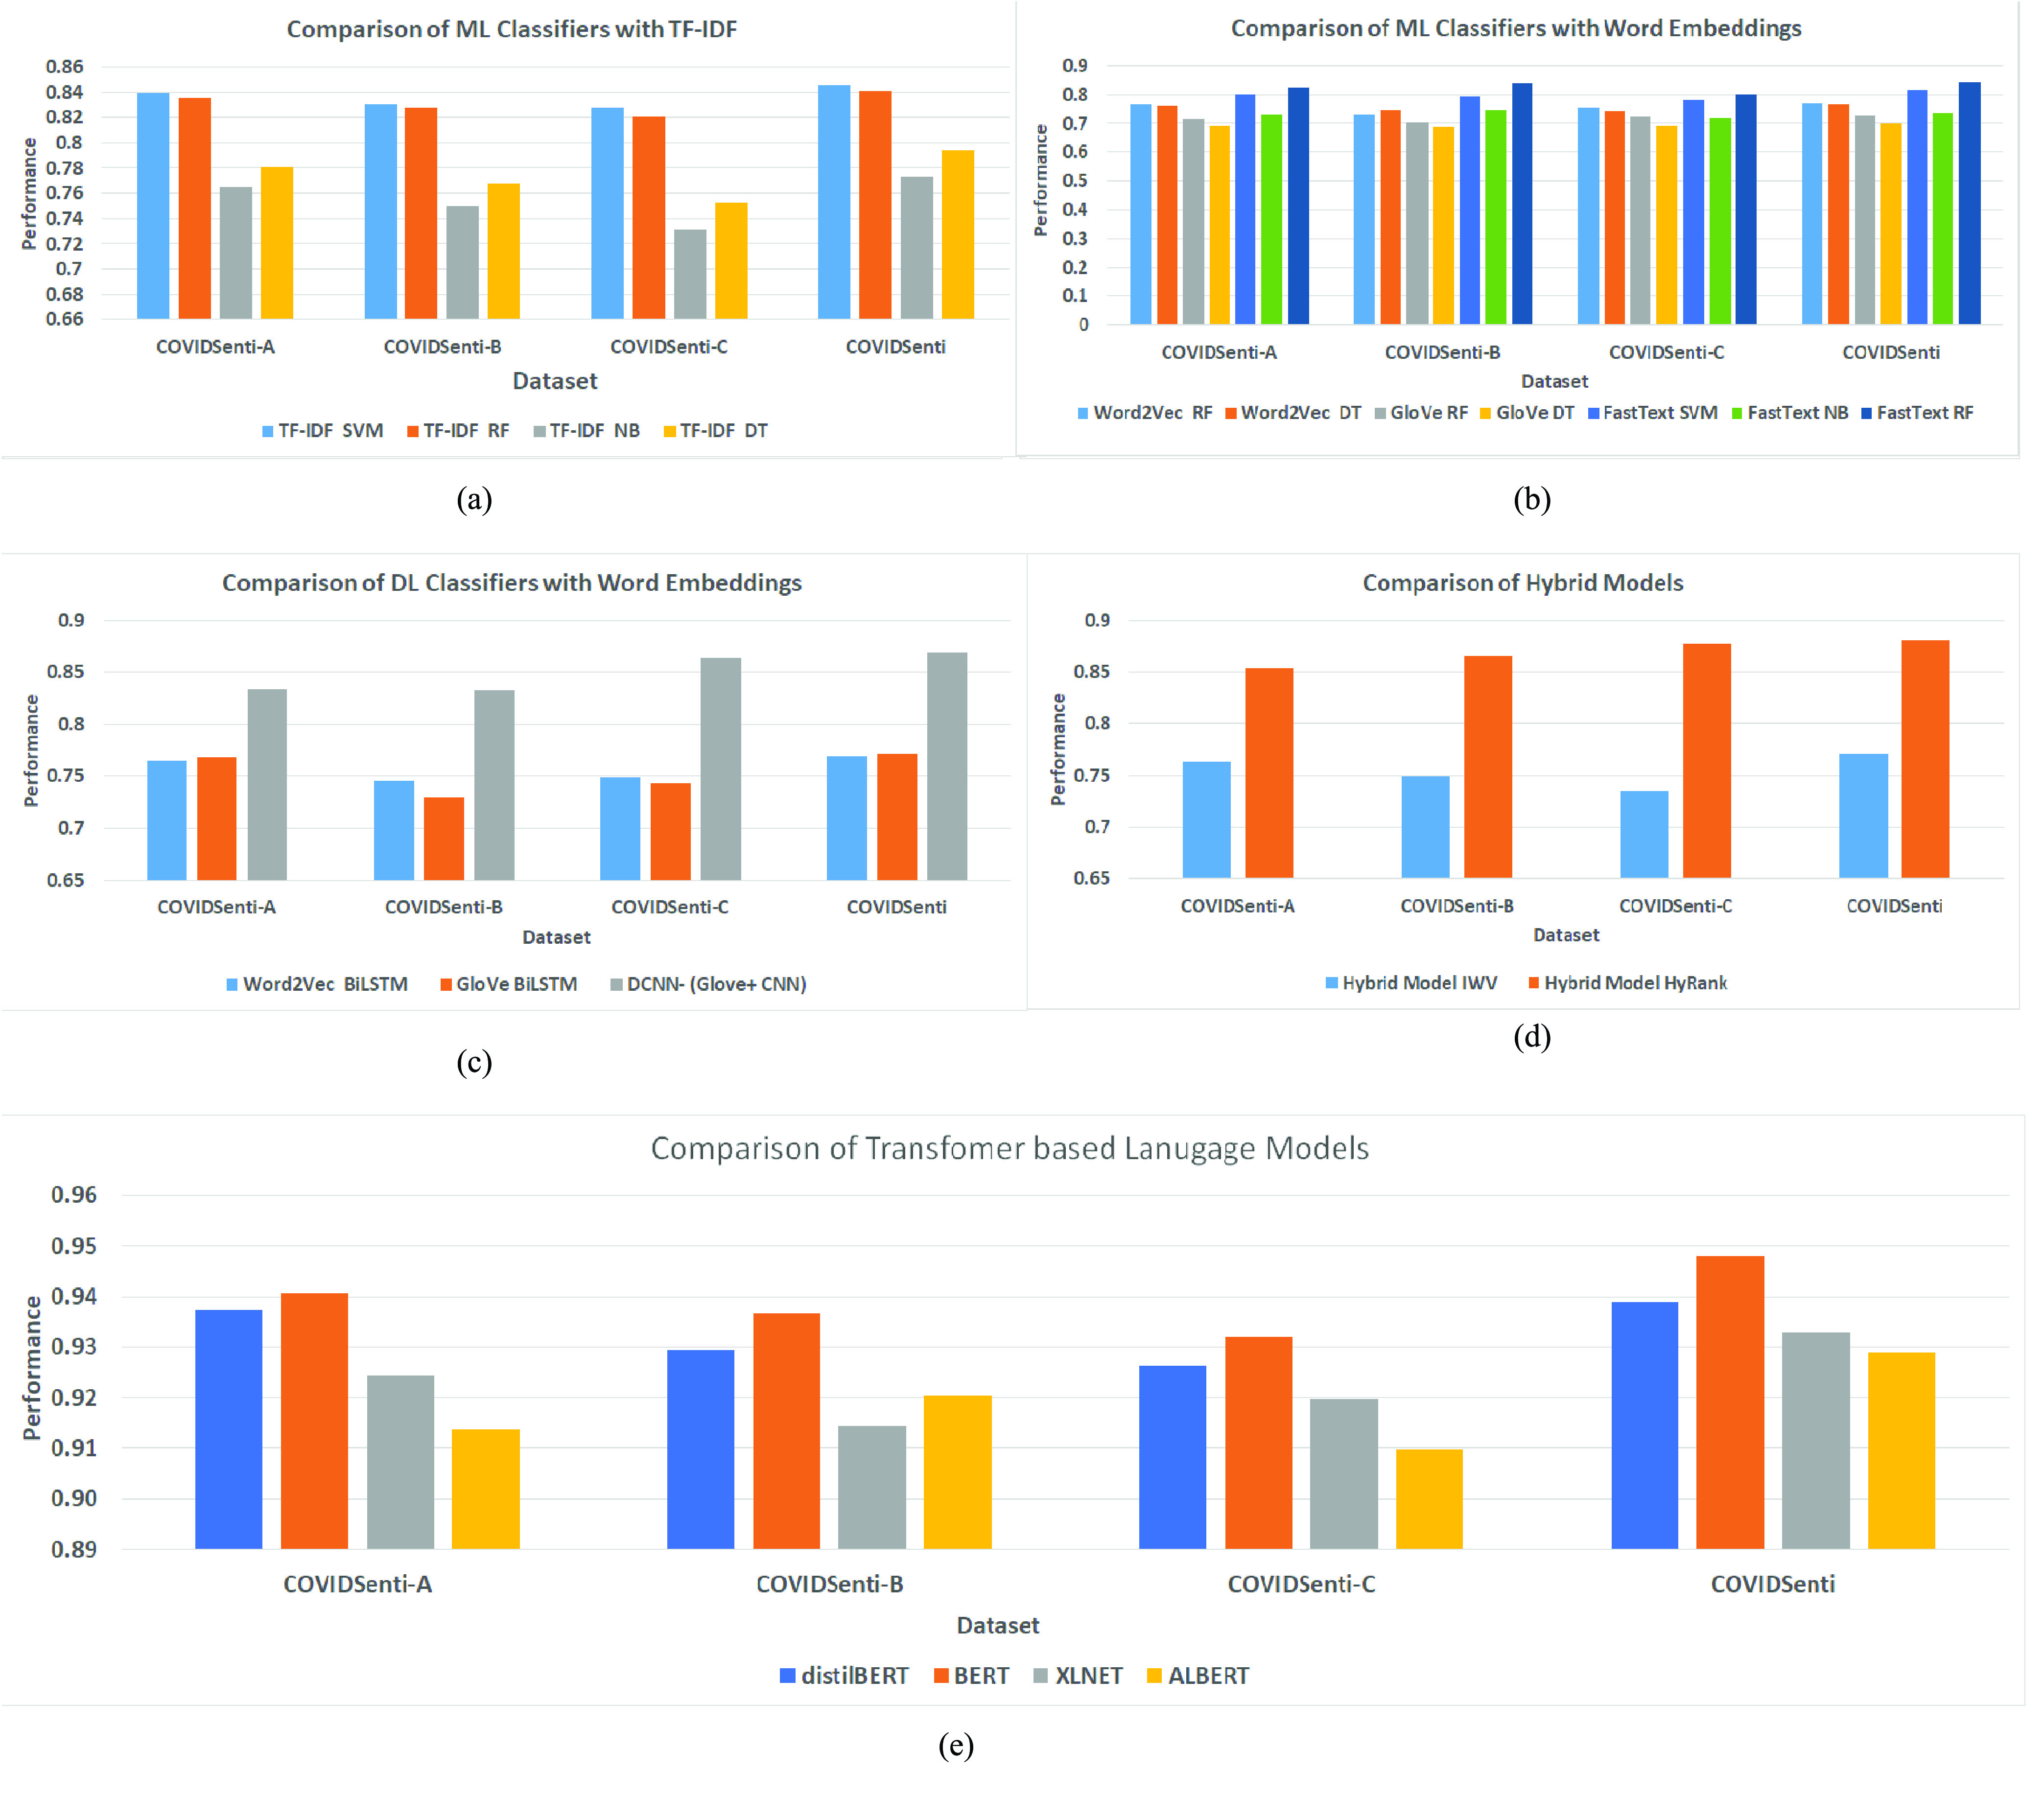
Comparison of all results. (a) ML classifiers with TF-IDF. (b) ML classifiers with word embeddings. (c) DL classifiers with word embeddings. (d) Hybrid models. (e) Transformer-based LM.
To establish the baselines for ML classifiers, we used traditional methods such as TF-IDF and Word2Vec, word embedding-based models such as Word2Vec, GloVe, and fastText, hybrid models such as IWV and HyRank, and transformer-based LMs such as BERT, DistilBERT, XLNET, and ALBERT. The results of TF-IDF-based classification are shown in Table V when using TF-IDF with SVM-, RF-, NB-, and DT-based ML classifiers and word embeddings with RF-, DT-, SVM-, and NB-based ML classifiers on all data sets. Note that TF-IDF with SVM exhibited better performance (0.839, 0.830, 0.829, and 0.845 on COVIDSENTI- A, COVIDSENTI- B, COVIDSENTI- C, and COVIDSENTI, respectively) in comparison to RF, DT, and NB.
We also used embedding-based models (Word2Vec, GloVe, and fastText) with different classifiers (RF, DT, SVM, and NB). Table VI describes the results. In comparison to DT, SVM, and NB, RF showed better performance for fastText (0.823, 0.841, 0.802, and 0.845 on COVIDSENTI- A, COVIDSENTI- B, COVIDSENTI- C, and COVIDSENTI, respectively); in comparison to Word2Vec and GloVe, fastText showed considerably better performance due to its ability to capture out-of-vocabulary words effectively, compared to other tested methods.
For DL-based classifiers, we used word embedding models such as Word2Vec, GloVe, and deep convolutional neural network (DCNN)7 where GloVe is used for word representations [24]. The results are shown in Table VII with Word2Vec and for GloVe with DL classifiers on all three data sets. In comparison to word embedding-based BiLSTM, DCNN with Glove showed better performance (0.834, 0.832, 0.864, and 0.869 on COVIDSENTI- A, COVIDSENTI- B, COVIDSENTI- C, and COVIDSENTI, respectively).
Furthermore, we performed an experiment using hybrid models, such as hybrid ranking and IWV in Table VIII. Hybrid ranking [50] incorporates sentiment and context of tweets for Twitter sentiment analysis (HyRank8). IWV model where traditional pretrained word embeddings were enhanced by adding POS and sentiment information from lexicons for sentiment analysis to setup the baselines. The results are shown in Table VIII. Notice that hybrid ranking outperforms IWV with the performance score of 0.854, 0.865, 0.877, and 0.881 on COVIDSENTI- A, COVIDSENTI- B, COVIDSENTI- C, and COVIDSENTI, respectively.
The final benchmark results are reported in Table IX where we fine-tune the results from current state-of-the-art transformer-based LMs, such as BERT, DistilBERT, XLNET, and ALBERT. It is evident from these results that BERT outperformed all other transformer-based LMs, as well as all other methods used earlier. We attribute this to BERT’s ability to capture contextual word representation, which all other methods fail to capture. These results are in-line with previous studies that demonstrated that BERT and its variants perform better than traditional methods such as TF-IDF, word embeddings, and hybrid methods that combine noncontextual word representation methods.
Experimental results on COVIDSENTI- A revealed the behavior of people in response to government action and policies related to COVID-19. We noticed that the people were losing trust in the government to control the situation; however, their behavior changed later in March even though there was fear, disgust, and sadness about the COVID-19. For example, “Why is Kenyan government taking this Coronavirus lightly. They are risking our lives. They need to stop flights to china#NewsGang.9” Experimental results on COVIDSENTI- B show that several posts favored lockdown and stay home even though COVID-19 cases were increasing. For example, “Want to help save lives during the coronavirus outbreak? Wash your hands & stay home if sick.10” This may be due to the negative propaganda and misinformation related to COVID-19 being spread on social media. Similarly, experimental results on COVIDSENTI- C showed that the increase in the number of COVID-19 cases and increased mortality rate negatively impacted people’s lives. For example, “Many Americans fear the coronavirus outbreak could prevent them from working and getting paid.11”
V. Conclusion
Since the explosion of COVID-19 conspiracy theories, social media has been widely used both for and against misinformation and misconceptions. In this article, we address the issue of Twitter sentiment on COVID-19-related Twitter posts. We benchmark sentiment analysis methods in the analysis of COVID-19-related sentiment. Our findings indicate that the population favored the lockdown and stay home order in February; however, their opinion shifted by mid-March. The reason for the shift in sentiment is unclear, but it may be due to misinformation being spread on social media; thus, there is a need to develop proactive and agile public health presence to combat the spread of fake news. To facilitate research among the community, we have released a publicly available large-scale COVID-19 benchmark sentiment analysis data set.
Biographies

Usman Naseem received the master’s degree in analytics (research) from the School of Computer Science and Advanced Analytics Institute, University of Technology Sydney, Ultimo, NSW, Australia, in 2020. He is currently pursuing the Ph.D. degree with the School of Computer Science, The University of Sydney, Sydney, NSW, Australia.
He has published numerous research papers in well-reputed conferences and journals. His research interests include natural language processing and data analytics in general, particularly in social media and healthcare analysis.

Imran Razzak is currently a Senior Lecturer with the School of Information Technology, Deakin University, Burwood, VIC, Australia. He is also working as a Consultant in various projects involving deep learning models in Big Data, IoT, medical Imaging, and BCI applications. His research interest is machine learning and data analytics in general, particularly in healthcare industry. He is a passionate health informatician who wants to make the healthcare industry a better place through informatics. He has authored more than 100 refereed research publications in international journals and conferences.
Dr. Razzak is an editorial board member of many reputable international journals as well as session co-chair, session chair, and TPC member of dozens of conferences.

Matloob Khushi is currently the Director of the Master of Data Science and the Graduate Certificate in Data Science, School of Computer Science, The University of Sydney, Ultimo, NSW, Australia.

Peter W. Eklund is currently a Professor of artificial intelligence (AI) and machine learning with the School of Information Technology, Deakin University, Burwood, VIC, Australia. He was one of the founders of the Semantic Web Science Foundation and was one of the pioneers of semantic web research. Since then, he has developed an international profile in applied artificial intelligence and machine learning. In 2010, he diversified into pervasive computing and intelligent transport systems, including applications of cyber-physical systems in supply chain logistics. His present work is on text analytics and deep learning.
Prof. Eklund received the inaugural Australian Smart Infrastructure Research Award from the Federal Department of Infrastructure, Transport, Regional Development and Local Government.

Jinman Kim (Member, IEEE) received the Ph.D. degree in computer science from The University of Sydney, Ultimo, NSW, Australia, in 2006.
He was an ARC Post-Doctoral Research Fellow with The University of Sydney and then a Marie Curie Senior Research Fellow with the University of Geneva, Geneva, Switzerland. In 2013, he joined The University of Sydney as a Faculty Member. His research is in the application of machine learning for biomedical image analysis and visualization. His focus is on multimodal data processing and includes image omics, multimodal data processing, and image data correlation to other health data. He has produced a number of publications in this field and received multiple competitive grants and scientific recognitions. He has actively focused on research translation, where he has worked closely with clinical partners to take his research into clinical practice. He is the Research Director of the Nepean Telehealth Technology Centre (NTTC) at the Nepean hospital, responsible for translational telehealth and digital hospital research. Some of his research has been developed into clinical software that is being used/trialed at multiple hospitals.
Dr. Kim is actively involved in his research communities, where he is an Associate Editor of TVCJ and the Vice President of the Computer Graphics Society (CGS). His work on telehealth has been recognized with multiple awards, including the Health Secretary Innovation Award at the NSW Health Innovation Symposium in 2016.
Funding Statement
This work was supported in part by ARC grants.
Footnotes
This is an original tweet taken from Twitter.
Published in conjunction with this article.
This is an original tweet taken from Twitter.
This is an original tweet taken from Twitter.
This is an original tweet taken from Twitter.
This is an original tweet taken from Twitter.
This is an original tweet taken from Twitter.
This is an original tweet taken from Twitter.
Contributor Information
Usman Naseem, Email: usman.naseem@sydney.edu.au.
Imran Razzak, Email: imran.razzak@deakin.edu.au.
Matloob Khushi, Email: matloob.khushi@sydney.edu.au.
Peter W. Eklund, Email: peter.eklund@deakin.edu.au.
Jinman Kim, Email: jinman.kim@sydney.edu.au.
References
- [1].Aggarwal C. C. and Reddy C. K., Data Clustering: Algorithms and Applications. Boca Raton, FL, USA: CRC Press, 2013. [Google Scholar]
- [2].Ahmad N. and Siddique J., “Personality assessment using Twitter tweets,” Procedia Comput. Sci., vol. 112, pp. 1964–1973, Sep. 2017. [Google Scholar]
- [3].Ahmad T., Ramsay A., and Ahmed H., “Detecting emotions in English and Arabic tweets,” Information, vol. 10, no. 3, p. 98, Mar. 2019. [Google Scholar]
- [4].Bandi A. and Fellah A., “Socio-analyzer: A sentiment analysis using social media data,” in Proc. 28th Int. Conf. Softw. Eng. Data Eng., in EPiC Series in Computing, vol. 64, Harris F., Dascalu S., Sharma S., and Wu R., Eds. Amsterdam, The Netherlands: EasyChair, 2019, pp. 61–67. [Google Scholar]
- [5].Barbieri F. and Saggion H., “Automatic detection of irony and humour in Twitter,” in Proc. ICCC, 2014, pp. 155–162. [Google Scholar]
- [6].Bhat R., Singh V. K., Naik N., Kamath C. R., Mulimani P., and Kulkarni N., “COVID 2019 outbreak: The disappointment in Indian teachers,” Asian J. Psychiatry, vol. 50, Apr. 2020, Art. no. 102047. [DOI] [PMC free article] [PubMed] [Google Scholar]
- [7].Blei D. M., Ng A. Y., and Jordan M. I., “Latent Dirichlet allocation,” J. Mach. Learn. Res., vol. 3, pp. 993–1022, Jan. 2003. [Google Scholar]
- [8].Boldog P., Tekeli T., Vizi Z., Dénes A., Bartha F. A., and Röst G., “Risk assessment of novel coronavirus COVID-19 outbreaks outside China,” J. Clin. Med., vol. 9, no. 2, p. 571, Feb. 2020. [DOI] [PMC free article] [PubMed] [Google Scholar]
- [9].Carducci G., Rizzo G., Monti D., Palumbo E., and Morisio M., “TwitPersonality: Computing personality traits from tweets using word embeddings and supervised learning,” Information, vol. 9, no. 5, p. 127, May 2018. [Google Scholar]
- [10].Carreras X. and Màrquez L., “Boosting trees for anti-spam email filtering,” 2001, arXiv:cs/0109015. [Online]. Available: https://arxiv.org/abs/cs/0109015
- [11].Carvalho J. P., Rosa H., Brogueira G., and Batista F., “MISNIS: An intelligent platform for Twitter topic mining,” Expert Syst. Appl., vol. 89, pp. 374–388, Dec. 2017. [Google Scholar]
- [12].Chae B. K., “Insights from hashtag #supplychain and Twitter analytics: Considering Twitter and Twitter data for supply chain practice and research,” Int. J. Prod. Econ., vol. 165, pp. 247–259, Jul. 2015. [Google Scholar]
- [13].De Choudhury M., Counts S., and Horvitz E., “Predicting postpartum changes in emotion and behavior via social media,” in Proc. SIGCHI Conf. Hum. Factors Comput. Syst., Apr. 2013, pp. 3267–3276. [Google Scholar]
- [14].Depoux A., Martin S., Karafillakis E., Preet R., Wilder-Smith A., and Larson H., “The pandemic of social media panic travels faster than the COVID-19 outbreak,” J. Travel Med., vol. 27, no. 3, Apr. 2020, Art. no. taaa031. [DOI] [PMC free article] [PubMed] [Google Scholar]
- [15].Devlin J., Chang M.-W., Lee K., and Toutanova K., “BERT: Pre-training of deep bidirectional transformers for language understanding,” in Proc. Conf. North Amer. Chapter Assoc. Comput. Linguistics, Human Lang. Technol., vol. 1. Minneapolis, MN, USA: Association for Computational Linguistics, Jun. 2019, pp. 4171–4186. [Google Scholar]
- [16].El Zowalaty M. E. and Järhult J. D., “From SARS to COVID-19: A previously unknown SARS-related coronavirus (SARS-CoV-2) of pandemic potential infecting humans—Call for a one health approach,” One Health, vol. 9, Jun. 2020, Art. no. 100124. [DOI] [PMC free article] [PubMed] [Google Scholar]
- [17].Fung I.et al. , “Pedagogical demonstration of Twitter data analysis: A case study of world AIDS day, 2014,” Data, vol. 4, no. 2, p. 84, Jun. 2019. [Google Scholar]
- [18].Gupta V. and Lehal G. S., “A survey of text mining techniques and applications,” J. Emerg. Technol. Web Intell., vol. 1, no. 1, pp. 60–76, Aug. 2009. [Google Scholar]
- [19].Hammouda K. M. and Kamel M. S., “Efficient phrase-based document indexing for Web document clustering,” IEEE Trans. Knowl. Data Eng., vol. 16, no. 10, pp. 1279–1296, Oct. 2004. [Google Scholar]
- [20].Han X., Wang J., Zhang M., and Wang X., “Using social media to mine and analyze public opinion related to COVID-19 in China,” Int. J. Environ. Res. Public Health, vol. 17, no. 8, p. 2788, Apr. 2020. [DOI] [PMC free article] [PubMed] [Google Scholar]
- [21].He W., Wu H., Yan G., Akula V., and Shen J., “A novel social media competitive analytics framework with sentiment benchmarks,” Inf. Manage., vol. 52, no. 7, pp. 801–812, Nov. 2015. [Google Scholar]
- [22].Huang B. and Carley K. M., “Disinformation and misinformation on Twitter during the novel coronavirus outbreak,” 2020, arXiv:2006.04278. [Online]. Available: http://arxiv.org/abs/2006.04278
- [23].Jain V. K., Kumar S., and Fernandes S. L., “Extraction of emotions from multilingual text using intelligent text processing and computational linguistics,” J. Comput. Sci., vol. 21, pp. 316–326, Jul. 2017. [Google Scholar]
- [24].Jianqiang Z., Xiaolin G., and Xuejun Z., “Deep convolution neural networks for Twitter sentiment analysis,” IEEE Access, vol. 6, pp. 23253–23260, 2018. [Google Scholar]
- [25].Kim E. H.-J., Jeong Y. K., Kim Y., Kang K. Y., and Song M., “Topic-based content and sentiment analysis of Ebola virus on Twitter and in the news,” J. Inf. Sci., vol. 42, no. 6, pp. 763–781, Dec. 2016. [Google Scholar]
- [26].Lan Z., Chen M., Goodman S., Gimpel K., Sharma P., and Soricut R., “Albert: A lite bert for self-supervised learning of language representations,” 2019, arXiv:1909.11942. [Online]. Available: https://arxiv.org/abs/1909.11942
- [27].Lopez C. E., Vasu M., and Gallemore C., “Understanding the perception of COVID-19 policies by mining a multilanguage Twitter dataset,” 2020, arXiv:2003.10359. [Online]. Available: http://arxiv.org/abs/2003.10359
- [28].Moradi R., Berangi R., and Minaei B., “A survey of regularization strategies for deep models,” Artif. Intell. Rev., vol. 53, no. 6, pp. 3947–3986, Aug. 2020. [Google Scholar]
- [29].Naseem U., Khan S. K., Farasat M., and Ali F., “Abusive language detection: A comprehensive review,” Indian J. Sci. Technol., vol. 12, no. 45, pp. 1–13, 2019. [Google Scholar]
- [30].Naseem U., Khan S. K., Razzak I., and Hameed A. I., “Hybrid words representation for airlines sentiment analysis,” in Advances in Artificial Intelligence, Liu J. and Bailey J., Eds. Cham, Switzerland: Springer, 2019, pp. 381–392. [Google Scholar]
- [31].Naseem U., Khushi M., Reddy V., Rajendran S., Razzak I., and Kim J., “BioALBERT: A simple and effective pre-trained language model for biomedical named entity recognition,” 2020, arXiv:2009.09223. [Online]. Available: http://arxiv.org/abs/2009.09223
- [32].Naseem U., Musial K., Eklund P., and Prasad M., “Biomedical named-entity recognition by hierarchically fusing BioBERT representations and deep contextual-level word-embedding,” in Proc. Int. Joint Conf. Neural Netw. (IJCNN), Jul. 2020, pp. 1–8. [Google Scholar]
- [33].Naseem U., Razzak I., Eklund P., and Musial K., “Towards improved deep contextual embedding for the identification of irony and sarcasm,” in Proc. Int. Joint Conf. Neural Netw. (IJCNN), Jul. 2020, pp. 1–7. [Google Scholar]
- [34].Naseem U., Razzak I., and Eklund P. W., “A survey of pre-processing techniques to improve short-text quality: A case study on hate speech detection on Twitter,” in Multimedia Tools and Applications. Springer, Nov. 2020, pp. 1–28. [Online]. Available: https://link.springer.com/article/10.1007/s11042-020-10082-6 [Google Scholar]
- [35].Naseem U., Razzak I., and Hameed I. A., “Deep context-aware embedding for abusive and hate speech detection on Twitter,” Aust. J. Intell. Inf. Process. Syst., vol. 15, no. 3, pp. 69–76, 2019. [Google Scholar]
- [36].Naseem U., Razzak I., Khan S. K., and Prasad M., “A comprehensive survey on word representation models: From classical to state-of-the-art word representation language models,” 2020, arXiv:2010.15036. [Online]. Available: http://arxiv.org/abs/2010.15036
- [37].Naseem U., Razzak I., Musial K., and Imran M., “Transformer based deep intelligent contextual embedding for Twitter sentiment analysis,” Future Gener. Comput. Syst., vol. 113, pp. 58–69, Dec. 2020. [Google Scholar]
- [38].Pépin L., Kuntz P., Blanchard J., Guillet F., and Suignard P., “Visual analytics for exploring topic long-term evolution and detecting weak signals in company targeted tweets,” Comput. Ind. Eng., vol. 112, pp. 450–458, Oct. 2017. [Google Scholar]
- [39].Kaila D. P.et al. , “Informational flow on Twitter–corona virus outbreak–topic modelling approach,” Int. J. Adv. Res. Eng. Technol., vol. 11, no. 3, pp. 128–134, 2020. [Google Scholar]
- [40].Rezaeinia S. M., Ghodsi A., and Rahmani R., “Improving the accuracy of pre-trained word embeddings for sentiment analysis,” 2017, arXiv:1711.08609. [Online]. Available: https://arxiv.org/abs/1711.08609
- [41].Rocha G. and Cardoso H. L., “Recognizing textual entailment: Challenges in the Portuguese language,” Information, vol. 9, no. 4, p. 76, Mar. 2018. [Google Scholar]
- [42].Saeed Z.et al. , “What’s happening around the world? A survey and framework on event detection techniques on Twitter,” J. Grid Comput., vol. 17, no. 2, pp. 279–312, 2019. [Google Scholar]
- [43].Saeed Z., Abbasi R. A., Razzak I., Maqbool O., Sadaf A., and Xu G., “Enhanced heartbeat graph for emerging event detection on Twitter using time series networks,” Expert Syst. Appl., vol. 136, pp. 115–132, Dec. 2019. [Google Scholar]
- [44].Saire J. E. C. and Navarro R. C., “What is the people posting about symptoms related to coronavirus in Bogota, Colombia?” 2020, arXiv:2003.11159. [Online]. Available: http://arxiv.org/abs/2003.11159
- [45].Samuel J., Garvey M., and Kashyap R., “That message went viral?! Exploratory analytics and sentiment analysis into the propagation of tweets,” 2020, arXiv:2004.09718. [Online]. Available: http://arxiv.org/abs/2004.09718
- [46].Samuel J., Kashyap R., and Betts S., “Strategic directions for big data analytics in E-commerce with machine learning and tactical synopses: Propositions for intelligence based strategic information modeling (SIM),” J. Strategic Innov. Sustainability, vol. 13, no. 1, pp. 99–106, 2018. [Google Scholar]
- [47].Sanh V., Debut L., Chaumond J., and Wolf T., “DistilBERT, a distilled version of BERT: Smaller, faster, cheaper and lighter,” 2019, arXiv:1910.01108. [Online]. Available: http://arxiv.org/abs/1910.01108
- [48].Schild L., Ling C., Blackburn J., Stringhini G., Zhang Y., and Zannettou S., “‘Go eat a bat, chang!’: An early look on the emergence of sinophobic behavior on Web communities in the face of COVID-19,” 2020, arXiv:2004.04046. [Online]. Available: http://arxiv.org/abs/2004.04046
- [49].Singh R., Singh R., and Bhatia A., “Sentiment analysis using machine learning technique to predict outbreaks and epidemics,” Int. J. Adv. Sci. Res, vol. 3, no. 2, pp. 19–24, 2018. [Google Scholar]
- [50].Tang D., Wei F., Qin B., Yang N., Liu T., and Zhou M., “Sentiment embeddings with applications to sentiment analysis,” IEEE Trans. Knowl. Data Eng., vol. 28, no. 2, pp. 496–509, Feb. 2016. [Google Scholar]
- [51].Vaswani A.et al. , “Attention is all you need,” in Proc. Adv. Neural Inf. Process. Syst. 2017, pp. 5998–6008. [Google Scholar]
- [52].Wang H.et al. , “Phase-adjusted estimation of the number of coronavirus disease 2019 cases in Wuhan, China,” Cell Discovery, vol. 6, no. 1, pp. 1–8, Dec. 2020. [DOI] [PMC free article] [PubMed] [Google Scholar]
- [53].Widener M. J. and Li W., “Using geolocated Twitter data to monitor the prevalence of healthy and unhealthy food references across the US,” Appl. Geography, vol. 54, pp. 189–197, Oct. 2014. [Google Scholar]
- [54].Yang Z., Dai Z., Yang Y., Carbonell G. J., Salakhutdinov R., and Le V. Q., “XLNet: Generalized autoregressive pretraining for language understanding,” 2019. arXiv: 1906.08237. [Online]. Available: http://arxiv.org/abs/1906.08237
- [55].Ye X., Li S., Yang X., and Qin C., “Use of social media for the detection and analysis of infectious diseases in China,” ISPRS Int. J. Geo-Inf., vol. 5, no. 9, p. 156, Aug. 2016. [Google Scholar]
- [56].Zhou J., Yang S., Xiao C., and Chen F., “Examination of community sentiment dynamics due to COVID-19 pandemic: A case study from Australia,” 2020, arXiv:2006.12185. [Online]. Available: http://arxiv.org/abs/2006.12185 [DOI] [PMC free article] [PubMed]