Abstract
Chest computed tomography (CT) image data is necessary for early diagnosis, treatment, and prognosis of Coronavirus Disease 2019 (COVID-19). Artificial intelligence has been tried to help clinicians in improving the diagnostic accuracy and working efficiency of CT. Whereas, existing supervised approaches on CT image of COVID-19 pneumonia require voxel-based annotations for training, which take a lot of time and effort. This paper proposed a weakly-supervised method for COVID-19 lesion localization based on generative adversarial network (GAN) with image-level labels only. We first introduced a GAN-based framework to generate normal-looking CT slices from CT slices with COVID-19 lesions. We then developed a novel feature match strategy to improve the reality of generated images by guiding the generator to capture the complex texture of chest CT images. Finally, the localization map of lesions can be easily obtained by subtracting the output image from its corresponding input image. By adding a classifier branch to the GAN-based framework to classify localization maps, we can further develop a diagnosis system with improved classification accuracy. Three CT datasets from hospitals of Sao Paulo, Italian Society of Medical and Interventional Radiology, and China Medical University about COVID-19 were collected in this article for evaluation. Our weakly supervised learning method obtained AUC of 0.883, dice coefficient of 0.575, accuracy of 0.884, sensitivity of 0.647, specificity of 0.929, and F1-score of 0.640, which exceeded other widely used weakly supervised object localization methods by a significant margin. We also compared the proposed method with fully supervised learning methods in COVID-19 lesion segmentation task, the proposed weakly supervised method still leads to a competitive result with dice coefficient of 0.575. Furthermore, we also analyzed the association between illness severity and visual score, we found that the common severity cohort had the largest sample size as well as the highest visual score which suggests our method can help rapid diagnosis of COVID-19 patients, especially in massive common severity cohort. In conclusion, we proposed this novel method can serve as an accurate and efficient tool to alleviate the bottleneck of expert annotation cost and advance the progress of computer-aided COVID-19 diagnosis.
Keywords: Coronavirus disease 2019, weakly supervised learning, generative adversarial network, lesion localization, lesion segmentation
I. Introduction
The worldwide spread of Coronavirus Disease 2019 (COVID-19) pandemic, which is caused by the severe acute respiratory syndrome coronavirus 2 (SARS-CoV-2), has posed a tremendous challenge for global public health security [1], [2]. Currently, early rapid diagnosis and intervention for this newly discovered virus remain immature. Although reverse transcription polymerase chain reaction (RT-PCR) is typically used as a gold standard for COVID-19 screening[3], it has been shown to suffer a high false-negative rate [4]. Chest computed tomography (CT) has been identified as an important complementary tool for the diagnosis of COVID-19, since it has a shorter testing cycle and can provide more detailed information related to the pathology as well as help diagnose the extent or severity of lung involvement. However, manually delineating infected lung region of COVID-19 based on chest CT images by radiologists is a labor-intensive and highly-subjective task. Artificial intelligence (AI) is now being developed rapidly to combine with CT to help radiologists and clinicians improve diagnostic accuracy and working efficiency.
Convolution neural networks (CNNs) have increased in versatility due to efficient regularization methods and fast graphical-processing units, allowing CNN structures to grow in depth and width, thereby increasing the learning capacity tremendously. CNN-based computer-aided diagnosis (CADs) of COVID-19 have been well studied [5], which can be mainly divided into two categories.
The most common one is the automatic COVID-19 diagnostic based on CT volumes or slices. For example, Bai et al. [6] propose an EfficientNet-based [7] model for CT slices classification and suggest that deep learning assistance improved radiologists’ performance in distinguishing COVID-19 from non-COVID-19 at chest CT. In contrast, Wang et al. [8] attempt to leverage a 3D CNN taking a CT volume with its 3D lung mask to make decisions directly. However, the CNN-based classification model can only provide final decisions without power of reasoning. Although visualization methods such as Gradient-weighted Class Activation Mapping (Grad-CAM) [9] can be used to mitigate this shortage [6], [8], [10]–[12] the lesion localization map obtained by such visualization methods is coarse and provide less useful information for treatment assessment.
Another category is the COVID-19 lesion segmentation [13]–[16]. For instance, Fan et al. [15] propose an automatic COVID-19 lung infection segmentation method based on a carefully designed network combing with edge information of infected regions and demonstrate the segmentation accuracy can be further improved by leveraging pseudo segmentation labels. Wang et al. [16] propose a noise-robust framework for COVID-19 lesion segmentation to tackle the inaccurate annotation caused by complex appearances of pneumonia lesions and high inter- and intra-observer variability. Intuitively, these supervised learning methods can provide a more accurate automatic delineation of lung infected regions than weakly supervised visual augmentation techniques. However, such fully supervised learning methods require large pixel-level annotated CT slices to achieve promising results. Most of the existing CT scan datasets of COVID-19 with manual annotation of infected regions could not meet this demand. In contrast, most of the current COVID-19 datasets only provide the patient-level labels (i.e., class labels) to indicate whether the person is infected or not and lack elaborate annotations.
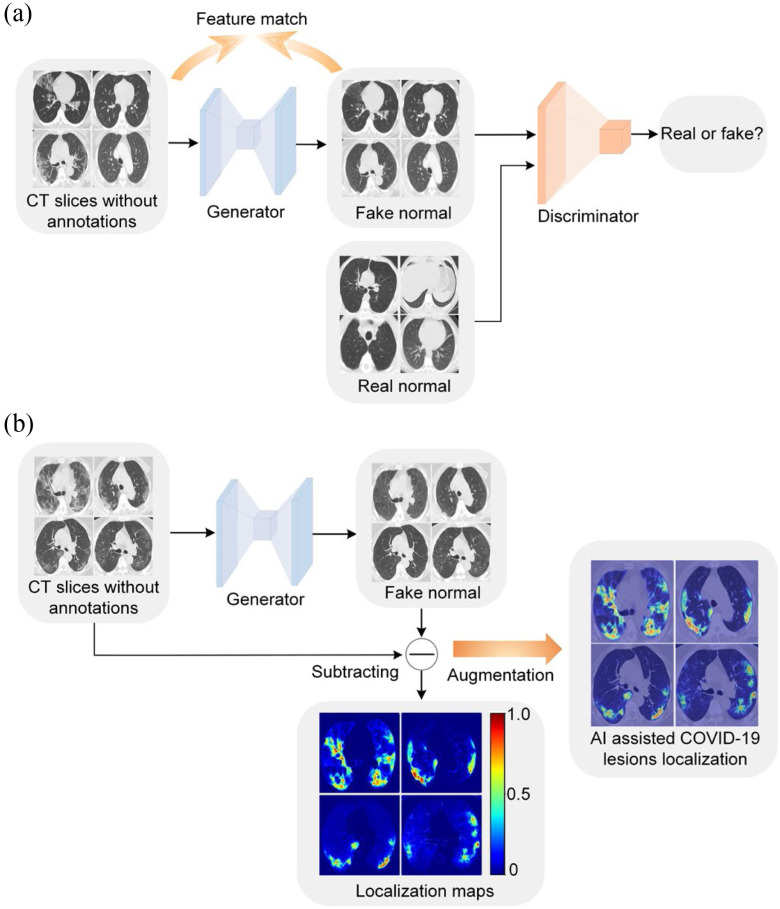
To largely alleviate the drawbacks mentioned above, we proposed a weakly supervised learning method for accurate COVID-19 lesion localization based on generative adversarial network combing with feature match as shown in Fig. 1. The proposed model consisted of a generator, a discriminator, and a feature extractor. The generator and the discriminator worked together to produce a normal-looking image [17]–[19] by removing ground-glass opacity (GGO) and pulmonary consolidation from CT slices with COVID-19. However, the complex texture of chest CT images may not be well captured by such a GAN-based framework. To improve the image reality of the generated images, we designed a feature extractor to guide the generator to output images with similar low-level features to the inputs, which increases lesion localization accuracy. By equipping the GAN-based framework with a classifier branch [17] as shown in Fig. 2, we developed a diagnosis system with improved classification accuracy and interpretability. Computer-aided diagnosis of COVID-19 from chest CT is of emergency and importance during the outbreak of SARS-CoV-2 worldwide. In this study, we showed that the proposed method could relieve radiologists from laborious workloads, such that contribute to the large-scale screening of COVID-19.
Fig. 1.
An overview of the proposed weakly supervised COVID-19 lesion localization. (a) During model training, a generator and a discriminator work together to remove potential lesions. The image quality of the generated fake normal images is boosted by feature match. (b) During model inference, we obtained the localization map by subtracting output from its input of the generator. The localization map is added to the original image to augment the COVID-19 diagnosis.
Fig. 2.
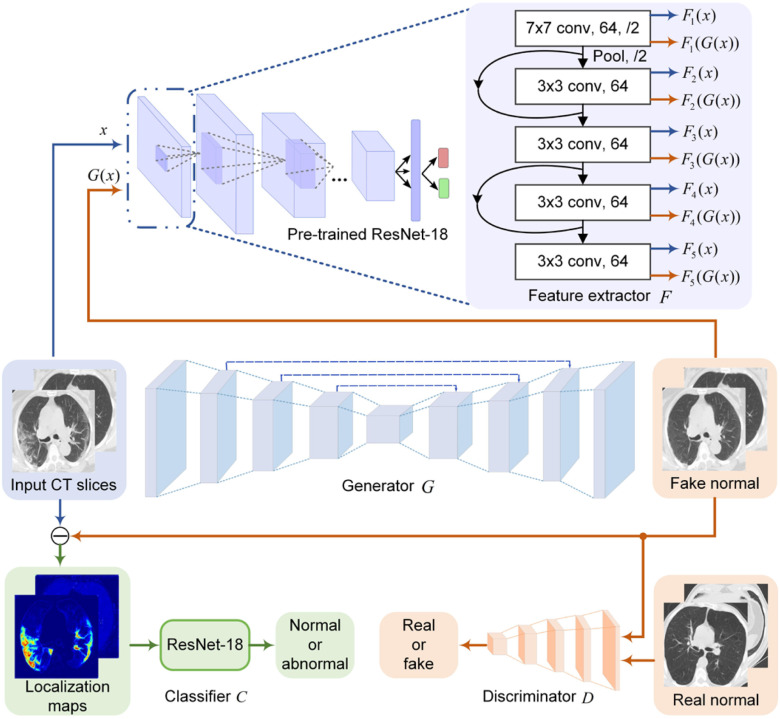
The proposed network architecture for COVID-19 lesion localization. The encoder-decoder and the patch discriminator work together to remove potential COVID-19 lesions from input CT slices. Shallow layers of the pre-trained ResNet-18 are used to perform low-level feature match between input and output to increase the image quality of the generated CT slices. Another ResNet-18 is used to classify the localization maps.
II. Methodology
A. COVID-19 Dataset
Three datasets were included in this work. The first dataset was from Brazil [20], which containing 1252 CT scans that were positive for SARS-CoV-2 infection (COVID-19) and 1230 CT scans for patients non-infected by SARS-CoV-2, 2482 CT scans from 120 patients in total. These data had been collected from real patients in hospitals from Sao Paulo, Brazil. However, segmentation labels were not available in this dataset, and we only used this dataset for training. To evaluate the lesion localization accuracy of the proposed method, we collected the second dataset [21], which consists of 98 axial CT slices from different COVID-19 patients. All the CT slices were collected by the Italian Society of Medical and Interventional Radiology. A radiologist segmented the CT images using different labels for identifying lung infections. The 98 CT slices were further divided into a validation set and a testing set. The validation set included 50 CT slices aim at hyper-parameters tuning and model selection. The remained 48 CT slices were used to evaluate the model performance. We denoted this testing set as Testing Set 1. Testing Set 1 is the same as [15]. The third one was from China Medical University, which including 300 CT scans from 7 patients infected by SARS-CoV-2. Pixel-level annotations are not available in this dataset, and thus we invite a radiologist to evaluate the lesion localization accuracy. (See Section III.D for detail experimental setup). We denoted this testing set as Testing Set 2.
B. Network Architecture
Our goal was to accurately localize the potential lesions in CT slices with COVID-19 when only the image-level labels were available. Based on this assumption, we proposed a novel weakly supervised learning method using GAN with feature match. The network architecture is showed in Fig. 2.
A generator with encoder-decoder architecture was trained to remove the potential COVID-19 features and generate fake normal CT slices. The input CT slices contained normal cases and abnormal cases. In the input slices were normal, the generator was trying to output slices the same as inputs. By subtracting the generator's output from the corresponding inputs, the infected lung region of COVID-19 can be easily localized and segmented.
To help the generator output a CT slice that looks like a real normal one, a discriminator was added to judge that the output CT slice was real normal or fake normal. The discriminator helped the generator to remove as many COVID-19 signals as possible from the original CT slice. It is clear that the generator and the discriminator together form a generative adversarial network (GAN) [22]. It was important to note that training the model does not need paired images.
However, the GAN-based framework without additional constraints cannot sufficiently capture the complex texture of chest CT images. In other words, the low-level features such as edge, textures, and color of the generated images may look distorted and consequently dropped the localization ability of the model. To solve this problem, we first trained a ResNet-18 [23] to classify normal and abnormal cases. The output of the ResNet-18 was whether the CT slice contains lesions or not. The shallow layers of the pre-trained ResNet-18 were then adopted as a feature exactor to guide the generator to output images with low-level features similar to inputs. Specifically, we first fed paired CT slices sampled from the input and output of the generator to the pre-trained ResNet-18 to extract paired low-level features from the first five convolutional layers, as shown in Fig. 2. It has been shown that the features extracted from shallow layers of the CNN respond corners, edge/color conjunctions, and mesh patterns [24]. We then computed the L1 loss of these paired features. The feature-level loss helps match low-level features between the generator's input and output to improve the reality of the generated images.
Moreover, by adding a classifier branch into the network as shown in Fig. 2, we can develop a diagnosis system based on localization maps. Ideally, if the input of the classifier contains only lesions for abnormal images and contains nothing for normal images (zero values everywhere), the classifier would more easily and accurately predict the category of the input images. Besides, training a more accurate classifier may help the generator's output keep the normal regions while removing lesions from the original image [17].
C. Loss Function
We aimed to learn a mapping function  between two domains
  and
and  given training samples
  and
and  , where
  represents CT slices with COVID-19 and normal CT slices, and
  represents the normal CT slices. A discriminator
  is used to distinguish between slices
  and translated slices
  . Our objective contained four terms: adversarial losses for matching the distribution of generated images to the data distribution in the target domain; a consistency loss aims to emphasize the similarity between output and input of generator; a feature match loss to guide the generator to perform feature match, and a cross-entropy loss aims for training the classifier. For the mapping function
  and its discriminator
  , we expressed the adversarial losses as:
 |
where  tries to generate images
  that look similar to images from the domain
  , while
  aims to distinguish between translated samples
  and real samples
  . It was worth noting that (1) was different from the original implementation of GAN. We replaced the negative log-likelihood objective with a least-square loss. This loss performs more stably during training and generates higher quality results [25]. The consistency loss and feature match loss can be expressed as
 |
where  denotes
  norm,
norm,  is a feature extractor and
  represents the feature map calculated by forwarding propagation after
  th convolutional layer of
  under the input
  as shown in Fig. 2,
  controls the relative importance of the five objectives. The cross-entropy loss can be computed as:
 |
where  is a classifier in which
  is the output of the classifier for the input
  ,
,  represents the localization map,
  represents classification labels in which normal cases are denoted as 0 and abnormal cases are denoted as 1, and
  is a ReLU activation.
The total loss function for optimizing the proposed model was
 |
where  ,
,  , and
, and  are three hyper-parameters for losses balancing. We aimed to solve:
 |
It was worth noting that the feature extractor  was pre-trained in a binary classification task, and we did not need to update
  during the training of GAN.
D. Implementation Detail
Experiments were performed using a NVIDIA GeForce GTX 1080TI with 11 GB memory under the PyTorch framework [26]. Adam optimizer [27] with 5e-6 learning rate was used to update the generator  . Two-timescale learning rates (TTUR) [28] were used to stabilize training by setting the learning rate of the discriminator
  to four times
  . The learning rate of the classifier
  was set to 1e-4. We used a batch size of 8 due to the limitation of GPU memory. During training, samples were random horizontal and vertical flipped and resized to 256 × 256 on the fly, and the pixel values were normalized from 0 to 1 before sending to the model.
In our experiments, we used a modified U-Net [29] as the generator  . In particular, we replaced the max pooling operation with
  convolution with the stride of 2. Batch normalization [30] was replaced by instance normalization [31] for improving the discrimination between different generated slices. Residual connections [23] were added to each convolution block to mitigate gradient vanishing. A patch GAN [32] was used as the discriminator
  , which output
  array instead of a single scalar output indicating real or fake. Mini-batch standard deviation layer [33] was added to the second to last convolutional layer of Patch GAN to stabilize the training of GANs. We used a ResNet-18 as the classifier
  .
.
The training set contained 2482 CT scans with only image-level labels available. Real normal slices for training the discriminator were the 1230 normal CT slices from the training set. The validation set included 50 CT slices with pixel-level annotation. Testing Set 1 including 48 CT slices with pixel-level annotation and Testing Set 2 including 300 CT slices without labels were used to testing our model. During model training, an alternating strategy was adopted by updating different parts of the model in an iterative manner as
 |
where  is set to 3.0,
  is set to 1.0,
  is set to 0.4 as suggested in [17], and hyper-parameters
  ,
,  ,
,  ,
,  , and
, and  were set to 3.0, 2.5, 2.0, 1.5, and 1.0, respectively. Note that we treated the localization map
  in (5) as a fixed constant while updating (10), which means that we did not update the parameters of the generator
  while training the classifier
  . We explained this setting in Section III.F. Since the localization map generated by the proposed method was scatter and may contain some noises, we used a gaussian kernel with
  to smooth the results. Finally, min-max normalization was used to map the localization map ranging from 0 to 1.
III. Experiments and Results
A. Compare With Different Weakly Supervised Learning Methods
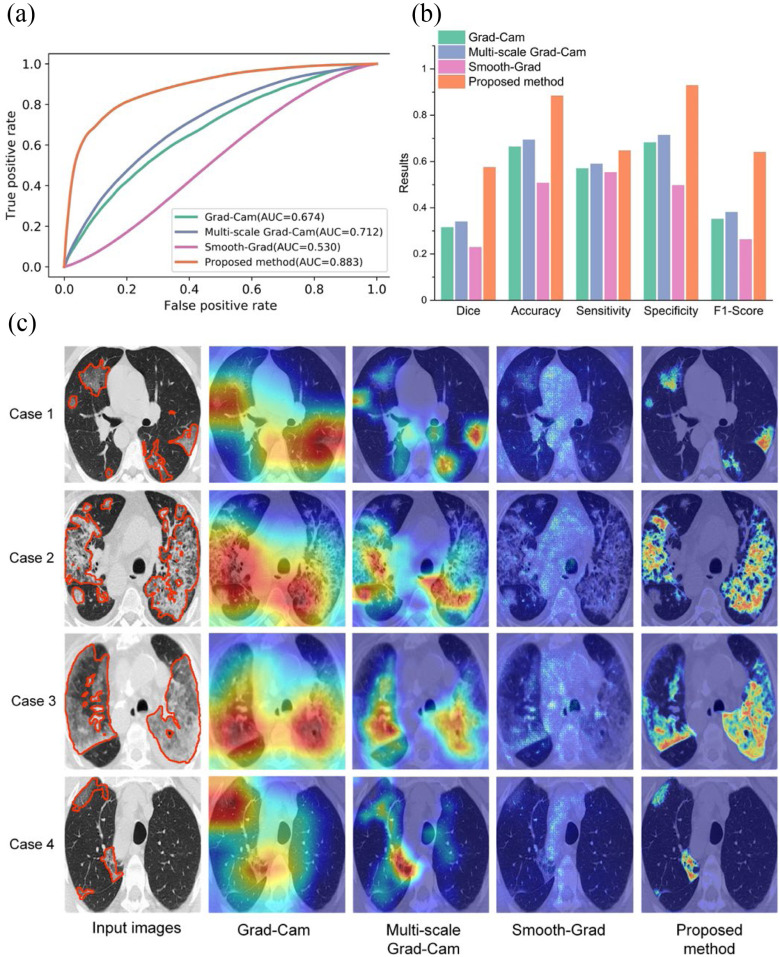
To evaluate the performance of the proposed weakly supervised learning method for infected region localization of COVID-19 in CT slices, we compared the proposed method with three widely used weakly supervised object location methods, including Grad-CAM [9], Smooth-Grad [34], and multi-scale Grad-CAM adopted to COVID-19 localization from CT slices recently [35]. These three methods were also trained on the training set with only image-level labels available. The attained localization maps were normalized from 0 to 1. All weakly supervised learning methods were testing in Testing Set 1. The area under the curve (AUC) score computed on pixel-level of our proposed method, multi-scale Grad-CAM, Grad-CAM, and Smooth-Grad were 0.883, 0.712, 0.674, and 0.530, respectively. The corresponding receiver operating characteristic (ROC) curve is shown in Fig. 3(a). We observed that the proposed method could localize the infected regions precisely, while the other three methods could only approximately localize potentially infected regions. We also found that Smooth-Grad is much worse than other weakly supervised localization methods. Since the pneumonia lesions often shared similar low-level features with its surrounding tissue, using the gradients with respected to the input images as proxy for features importance is not optimal. To further demonstrate the effectiveness of the proposed method, we converted the localization maps into binary images using the threshold determined by grid search in the validation set. The binary images reveal the possible infected regions. We used dice coefficient, accuracy, sensitivity, specificity, F1-score as performance indicators to evaluate segmentation results. The proposed method overwhelms the other three methods by a significant margin with a dice coefficient of 0.575 as shown in Fig. 3(b), which demonstrates the effectiveness of our proposed method. Moreover, we illustrate several typical lesion localization results qualitatively in Fig. 3(c).
Fig. 3.
Comparing different weakly supervised learning methods in Testing Set 1. (a) The ROC curve of different weakly supervised learning methods for COVID-19 lesion localization. (b) Quantitative comparison of different weakly supervised learning methods. (c) Qualitative comparison of different weakly supervised learning methods. Lesions are denoted as orange color contours in the input images.
B. Compare With Fully Supervised Learning Methods
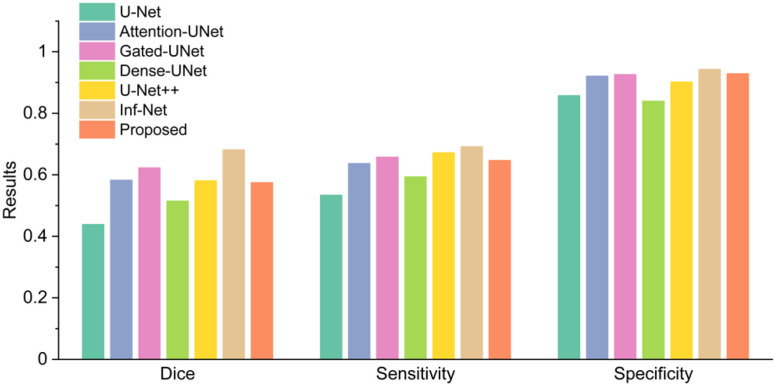
In this group of experiments, we investigated the segmentation accuracy of the proposed method by comparing the segmentation results with the state of art segmentation method called Inf-Net [15]. Inf-Net is trained on a training set contained 50 CT slices and tested in 48 CT slices, which is the same as us. We wanted to evaluate whether the weakly supervised learning method can be an alternative to the fully supervised learning method as the annotated data is limited. We used dice coefficient [36], sensitivity, and specificity to evaluate the segmentation results. Fig. 4 presents a comparison between the proposed weakly supervised learning method with several fully supervised learning methods [15], [29], [37]–[40]. The proposed method exceeded U-Net and Dense U-Net trained in a fully supervised manner in all performance indicators while was inferior to Inf-Net.
Fig. 4.
Compared with fully supervised learning methods in Testing Set 1.
C. Feature Match Increases the Accuracy of Lesion Localization
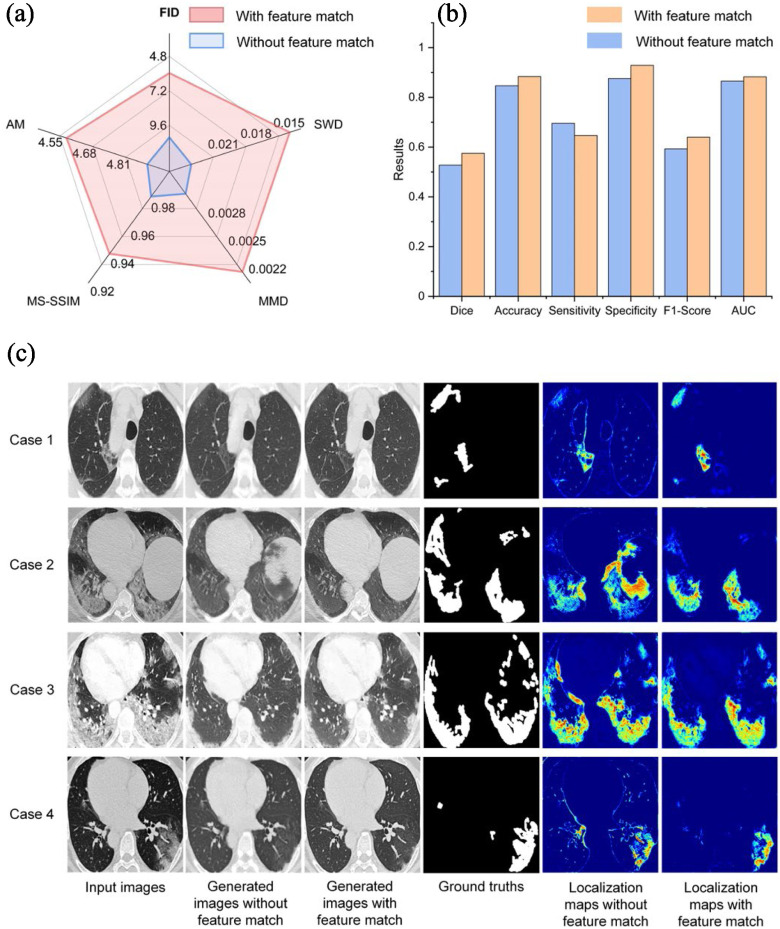
In this group of experiments, we investigated the influence of feature match strategy for infected regions segmentation. For images quality evaluation, we used Fréchet Inception distance (FID) [28], activation maximization score (AM) [41], maximum mean discrepancy [42] (MMD), multi-scale structural similarity (MS-SSIM) [43] and sliced Wasserstein distance (SWD) [33] as performance indicators. For lesion localization evaluation, we used the dice coefficient, sensitivity, specificity, F1-score, and AUC for quantitative evaluation. As presented in Fig. 5(a), adding feature match to the model helps improve the image quality, and results in a more accurate lesion localization as shown in Fig. 5(b). However, we founded that adding feature match to the model lower the sensitivity. This finding probably due to the fact that the generated slices with less detailed information tend to cause over-segmented results which lead to a higher sensitivity. Fig. 5(c) shows some qualitative results. As presented in Fig. 5, adding feature match help guide the generator to capture complex texture, which also results in more accurate lesion localization.
Fig. 5.
Analysis of the feature match in Testing Set 1. (a) Evaluating image quality between with and without feature match. All metrics are the lower the better (b) The performance of lesion localization between with and without feature match. (c) Qualitative comparison between with and without feature match.
D. Visualization Comparison Between Different Methods
To further demonstrated the effectiveness of the proposed method, we had invited a radiologist to evaluate the lesion localization accuracy by estimated the intersection over union (IoU) between localization map and ground truth in a visual way. The IoU is defined as
 |
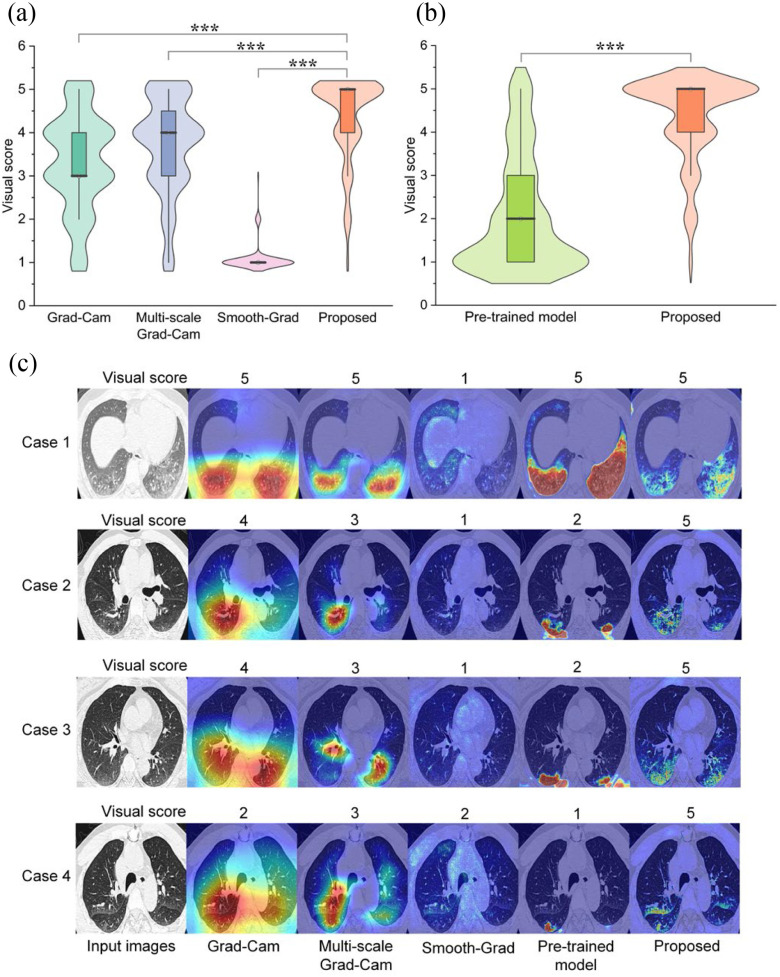
In particular, given a localization map and a CT slices from Testing set 2, the radiologist was asked to give a visual score of 5.0, 4.0, 3.0, 2.0, 1.0 corresponding an IoU of 0.8--1.0, 0.6--0.8, 0.4--0.6 and 0.0--0.2 respectively. We compared the visual score between different weakly supervised learning methods. A supervised learning model pre-trained on a large-scale COVID-19 dataset with pixel-level annotations was also compared with the proposed method. Quantitative and qualitative results are shown in Fig. 6. The visual score with the proposed method was 4.35±0.96. With Grad-Cam, multi-scale Grad-Cam, Smooth-Grad, and pre-trained supervised model, the visual scores were 3.29±1.11, 3.69±1.11, 1.09±0.34, and 2.08±1.33, respectively. With a Student's t-test, we found that the differences between our method and the other weakly supervised learning methods were statistically significant (P < 0.001).
Fig. 6.
Comparison of visual score between different methods in Testing Set 2. (a) Quantitative comparison of different weakly supervised learning methods with a Student's t-test, *P < 0.05; **P < 0.01; ***P < 0.001. (b) Compared with pre-trained fully supervised learning model. (c) Qualitative comparison between different methods.
E. Visualization Comparison Between Different Methods
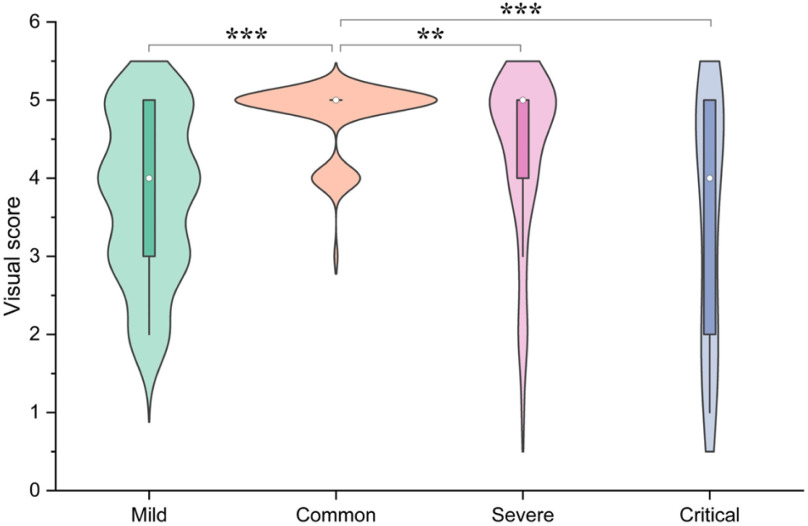
In this study, the 300 COVID-19 CT slices have been stratified as mild, common, severe and critical according to the severity by calculating the percentage of lesion to lung size [44], [45], with mild: percentage < 10%; common: 10% < percentage < 30%; severe: 30%< percentage < 50% and critical: percentage > 50%. The sample size of mild, common, severe, and critical were 77, 152, 50, and 21, respectively, and the percentage of the lesion to lung size of each cohort were 5.46%±2.41%, 20.32%±5.80%, 39.45%±6.00%, and 59.64%±5.96%, respectively. We then evaluated the correlation between severity and visual score (Fig. 7), where the visual score of mild, common, severe, and critical were 3.77±1.01, 4.78±0.44, 4.32±1.04, and 3.48±1.54, respectively. Our data showed that the common cohort had the largest sample size, and the visual score of this cohort was higher than the other three cohorts respectively with statistical differences (P < 0.05).
Fig. 7.
Correlation between severity and visual score. The severity was divided into mild, common, severe and critical according to the percentage of lesion to lung size (mild: percentage < 10%, common: 10% < percentage < 30%, severe: 30%< percentage < 50% and critical: percentage > 50%). We compared the visual score between common group and the other groups with a Student's t-test, *P < 0.05; **P < 0.01; ***P < 0.001.
F. Evaluate the Classifier
In this group of experiments, we investigated the influence of the classifier branch for lesion localization and evaluated the classification accuracy. Specifically, we wanted to know whether the lesion localization accuracy can be improved by the classifier  . We set hyper-parameter
  in (10) to 0.4 as suggested in [17]. We compared the segmentation accuracy between updating generator
  and classifier
  simultaneously and updating classifier
  only using (10). The results are shown in Appendix Fig. S1. The generator
  could not gain from the classifier
  . Therefore, we set the localization map as a fixed constant while training the classifier.
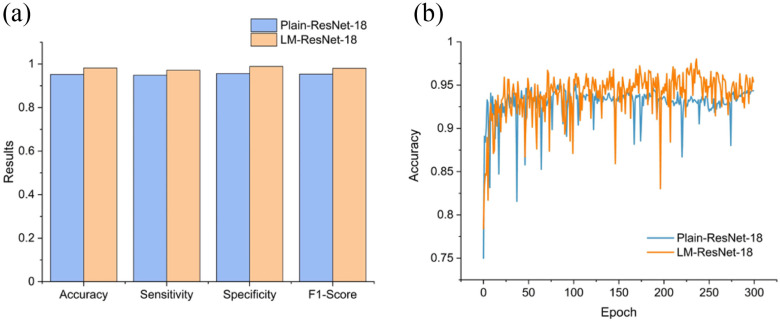
Since Testing Set 1 and 2 contain only positive samples, to evaluate the classification accuracy, we split the 2482 CT slices with image-level labels (original training set) into a training set (n = 1737) and an independent testing set (n = 745) randomly. Note that Testing Set 1 and 2 were excluded in this experiment. Since the inputs of the classifier  were localization maps, we denoted it as LM-ResNet-18. We built a baseline model (ResNet-18) trained on original normal and abnormal CT images for comparison. We denoted the baseline model as Plain-ResNet-18. The hyper-parameters of these two models remain the same during experiments. For a fair comparison, the data augmentations described in Section II.D were also adopted in Plain-ResNet-18 during training. Fig. 8(a) shows the classification results of Plain-ResNet-18 and LM-ResNet-18. The LM-ResNet-18 achieved accuracy, sensitivity, specificity, and F1-score were 0.982, 0.972, 0.989, and 0.981, respectively while those of the Plain-ResNet-18 were 0.953, 0.949, 0.956, and 0.954 respectively. Fig. 8(b) shows the testing curve of the two models. Since the localization maps keep updating during training, the generalization ability of the LM-ResNet-18 may be improved.
Fig. 8.
Comparison of classification results between Plain-ResNet-18 and LM-ResNet-18. (a) The classification performance of Plain-ResNet-18 and LM-ResNet-18. (b) Testing curves of Plain-ResNet-18 and LM-ResNet-18.
IV. Discussion
In this study, we proposed a novel weakly supervised learning method for COVID-19 lesion localization. The performance of our method was superior to other widely used weakly supervised learning methods. This AI effort was driven by the desire to develop a tool to assist radiologists in combating this pandemic. The proposed method can ease radiologists’ workload by providing clues of COVID-19 in a visual augmentation manner. Moreover, the generated localization maps can be used as pseudo labels, which can be further refined as annotations by radiologists. This human-in-the-loop strategy can reduce the annotation time significantly [16].
Lung lesion localization is essential in the procedure of COVID-19 diagnosis since it provides explainable results, while the CNNs-based classification model can only provide final decisions without power of reasoning. To remedy the defect of the CNNs-based classification model, Cam-based methods [9] and gradient-based methods [34] are proposed to provide explainable results to support the final decisions. However, these weakly supervised learning visualization methods can only approximately localize potential biomarkers at low resolution in images after training a classifier. In contrast, we demonstrated that the GAN-based weakly supervised learning method can accurately localize COVID-19 lesions at high resolution. Besides, we also found that multi-scale Grad-Cam is better than single-scale Grad-Cam, suggesting that multi-scale features help object localization. This observation also reveals the effectiveness of the proposed method in the lesion localization since the generator is trying to integrate features of all levels instead of manually picking features on a particular level to form the localization map.
Several studies have achieved promising results in COVID-19 lesion segmentation using fully supervised learning methods. However, these fully supervised learning methods require a large scale of pixel-level annotations to reduce the over-fitting problem. In this study, we demonstrated another algorithm that performs well, is based on GAN with feature match, and does not need pixel-level annotations. Compared with the fully supervised learning methods trained on 50 CT slices with pixel-level annotations, the proposed weakly supervised method still achieves a competitive result with a dice coefficient of 0.575. However, the dice coefficient of 0.575 is inferior to the fully supervised method [16] trained on a large-scale dataset with pixel-level annotations by a significant margin.
A good AI-assisted tool for COVID-19 diagnosis must provide visual cues to help decision-making. To evaluate whether the proposed method provides useful visual information for radiologists or not, we designed a metric named visual score to estimate the overlap degree of predictive localization map and ground truth localization map. The proposed method obtained promising results with a visual score of 4.35±0.96 in Testing Set 2, indicating the predictive results are highly consistent with the observations for supporting the radiologist's final decision. We also observe that the pre-trained fully supervised model achieves poor results than those of the proposed method, as shown in Fig. 6(b). This finding probably due to the domain gap [46] between their training set and our Testing Set 2, and the different image pre-processing between their method and ours. This observation also reveals the imperfection of the AI system currently since these systems are brittle and sensitive to slight data distribution changes [47]. One way to tackle this problem is to re-train the model on a new dataset. In such a case, weakly supervised learning methods have a great advantage since we only need to provide weak labels of the new dataset instead of elaborate annotations used in fully supervised learning.
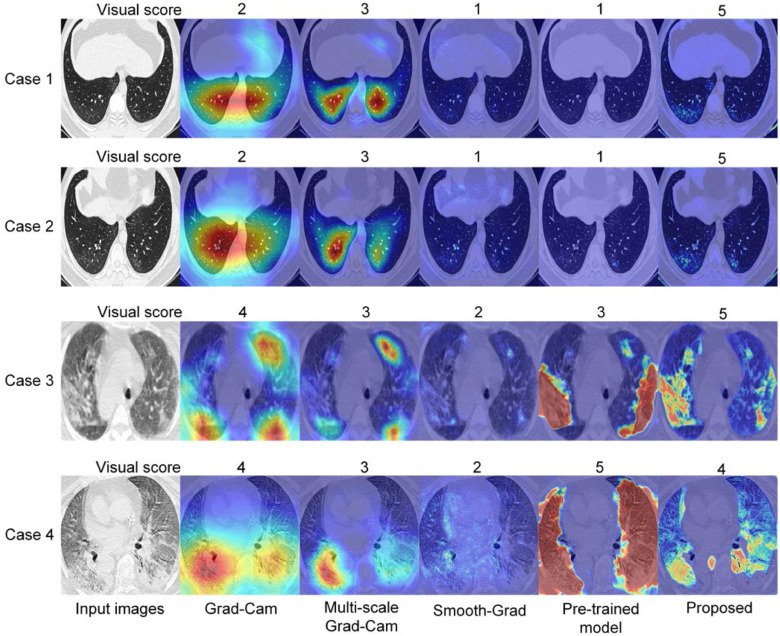
We also analyzed the association between severity and visual score to preliminarily evaluate the accuracy of our diagnosis augmentation strategy in COVID-19 patients with different pulmonary lesion severity. We found that the lesion localization results were highly consistent with the radiologist in the common severity cohort with the highest visual score (Fig. 7). Meanwhile, the common cohort accounts for over half of research cases (152/300), more than the other three cohorts put together. These results suggest that the proposed method can serve as an accurate and efficient tool to fast screening of patients with common severity evaluated by the percentage of the lesion to lung size, which can help rapid diagnosis of COVID-19 during large outbreaks and epidemics, especially in massive common severity population. The mild and critical cohort's visual scores were 3.77±1.01 and 3.48±1.54, respectively, which was also acceptable and demonstrated the robustness of the proposed method. Qualitative results of some extreme cases are shown in Fig. 9. From the visual scores given by the radiologist, we can see that the proposed method is more robust than other methods. Besides, from the first two cases shown in Fig. 9, we can observe that the proposed method may help radiologists detecting some lesions which are not so easy to observe.
Fig. 9.
Qualitative analysis of the model robustness.
Several studies also proposed to used the GAN-based framework for lesion localization [17]–[19]. However, these GAN-based frameworks are not suitable for COVID-19 lesion localization due to the complex texture of chest CT images. Based on this observation, we proposed a feature match strategy to guide the model to capture the complex texture of chest CT images, which increases the image quality of generated images. We observed that the feature match could reduce the noises and help the model to generate images with a more fine-grained texture. We showed that by combing the GAN-based framework with the feature match, the lesion localization accuracy is improved, as shown in Fig. 5. Overall, the feature match was a simple but effective strategy to improve the GAN-based framework for lesion localization.
By adding a classifier branch to the network [17], we can further develop a diagnosis system with good interpretability since the diagnosis results are based on infected regions. The diagnosis system can not only output diagnosis results but also provide the lesion's location. The diagnosis system achieved a superior classification performance than the vanilla classifier trained on original CT slices, as shown in Fig. 8. The improved lesion localization accuracy and classification accuracy suggested that the proposed GAN-based diagnosis system may be an alternative to the CAM-based diagnosis system. This diagnosis augmentation strategy takes over some of the load on doctors by reducing personal experience dependency and repetitive labor-intensive practice and confirmation. With the help of the proposed augmented lesion diagnosis technology, doctors can make decisions faster and more accurately, while non-professional, such a medical interns and general practitioners, can perform pseudo-professional diagnoses.
Our study has the following limitations. First, the proposed method can only provide potential lesion localization without differentiation of GGO and pulmonary consolidation, which is also crucial in severity evaluation. Second, the analysis of this study is based on slice-level instead of volume-level, so the conclusion of this study cannot represent volume-level cases. However, the proposed method can be easily extended to volume-level cases by aggregating the results within a CT volume.
V. Conclusion
This paper proposes a weakly supervised learning method for COVID-19 lesion localization using a GAN combing with feature match. The generator is used to translate a CT slice containing lesions into the corresponding slice where the lesions have been removed, while the discriminator is to boost the generator to output fake normal CT slices that look more real. To improve the image quality of the generated slices, a pre-trained feature extractor is used to enhance the fine-grained features. Several strategies including advanced loss function, TTUR, and mini-batch standard deviation layer are used to stabilize model training. Experimental results corroborated the superiority of the proposed method, which exceeded other widely used weakly supervised localization methods significantly. In addition, the proposed method leads to a competitive result compared to the fully supervised method in lesion segmentation task. We believe that the proposed method can be used as a powerful tool to alleviate the bottleneck of expert annotation cost and advance the progress of computer-aided COVID-19 diagnosis. Code is available at https://github.com/guaguabujianle/COVID-19-GAN
Funding Statement
This work was supported in part by Guangzhou science and technology fund under Grant 201803010072, in part by the Science, Technology & Innovation Commission of Shenzhen Municipality under Grant JCYL 20170818165305521, and in part by China Medical University Hospital (DMR-110-097).
Contributor Information
Ziduo Yang, Email: yangzd@mail2.sysu.edu.cn.
Lu Zhao, Email: zhaolu26@mail.sysu.edu.cn.
Shuyu Wu, Email: wsyeasy@outlook.com.
Calvin Yu-Chian Chen, Email: chenyuchian@mail.sysu.edu.cn.
References
- [1].Wang C., Horby P. W., Hayden F. G., and Gao G. F., “A novel coronavirus outbreak of global health concern,” Lancet, vol. 395, no. 10223, pp. 470–473, 2020. [DOI] [PMC free article] [PubMed] [Google Scholar]
- [2].Huang C. et al. , “Clinical features of patients infected with 2019 novel coronavirus in Wuhan, China,” Lancet, vol. 395, no. 10223, pp. 497–506, 2020. [DOI] [PMC free article] [PubMed] [Google Scholar]
- [3].Fang Y. et al. , “Sensitivity of chest CT for COVID-19: Comparison to RT-PCR,” Radiology, 2020, Art. no. 200432. [DOI] [PMC free article] [PubMed]
- [4].Ai T. et al. , “Correlation of chest CT and RT-PCR testing in coronavirus disease 2019 (COVID-19) in China: A report of 1014 cases,” Radiology, 2020, Art. no. 200642. [DOI] [PMC free article] [PubMed]
- [5].Ting D. S. W., Carin L., Dzau V., and Wong T. Y., “Digital technology and COVID-19,” Nature Med., vol. 26, no. 4, pp. 459–461, 2020. [DOI] [PMC free article] [PubMed] [Google Scholar]
- [6].Bai H. X. et al. , “AI augmentation of radiologist performance in distinguishing COVID-19 from pneumonia of other etiology on chest CT,” Radiology, 2020, Art. no. 201491, doi: 10.1148/radiol.2020201491. [DOI] [PMC free article] [PubMed]
- [7].Tan M. and Le Q. V., “EfficientNet: Rethinking model scaling for convolutional neural networks,” 2019. [Online]. Available: http://arxiv.org/abs/1905.11946
- [8].Wang X. et al. , “A Weakly-supervised framework for COVID-19 classification and lesion localization from chest CT,” IEEE Trans. Med. Imag., vol. 39, no. 8, pp. 2615–2625, Aug. 2020. [DOI] [PubMed] [Google Scholar]
- [9].Selvaraju R. R., Cogswell M., Das A., Vedantam R., Parikh D., and Batra D., “Grad-CAM: Visual explanations from deep networks via gradient-based localization,” in Proc. IEEE Int. Conf. Comput. Vis., 2017, pp. 618–626. [Google Scholar]
- [10].Harmon S. A. et al. , “Artificial intelligence for the detection of COVID-19 pneumonia on chest CT using multinational datasets,” Nature Commun., vol. 11, no. 1, pp. 1–7, 2020. [DOI] [PMC free article] [PubMed] [Google Scholar]
- [11].Greenspan H., Estépar R. S. J., Niessen W. J., Siegel E., and Nielsen M., “Position paper on COVID-19 imaging and AI: From the clinical needs and technological challenges to initial AI solutions at the lab and national level towards a new era for AI in healthcare,” Med. Image Anal., vol. 66, 2020, Art. no. 101800. [DOI] [PMC free article] [PubMed] [Google Scholar]
- [12].Jin C. et al. , “Development and evaluation of an artificial intelligence system for COVID-19 diagnosis,” Nature Commun., vol. 11, no. 1, pp. 1–14, 2020. [DOI] [PMC free article] [PubMed] [Google Scholar]
- [13].Gao K. et al. , “Dual-branch combination network (DCN): Towards accurate diagnosis and lesion segmentation of COVID-19 using CT images,” Med. Image Anal., vol. 67, 2020, Art. no. 101836. [DOI] [PMC free article] [PubMed] [Google Scholar]
- [14].Zhou L. et al. , “A rapid, accurate and machine-agnostic segmentation and quantification method for CT-based COVID-19 diagnosis,” IEEE Trans. Med. Imag., vol. 39, no. 8, pp. 2638–2652, Aug. 2020. [DOI] [PMC free article] [PubMed] [Google Scholar]
- [15].Fan D.-P. et al. , “Inf-Net: Automatic COVID-19 lung infection segmentation from CT images,” IEEE Trans. Med. Imag., vol. 39, no. 8, pp. 2626–2637, Aug. 2020, doi: 10.1109/tmi.2020.2996645. [DOI] [PubMed] [Google Scholar]
- [16].Wang G. et al. , “A Noise-robust framework for automatic segmentation of COVID-19 pneumonia lesions from CT images,” IEEE Trans. Med. Imag., vol. 39, no. 8, pp. 2653–2663, Aug. 2020. [DOI] [PMC free article] [PubMed] [Google Scholar]
- [17].Zhang R. et al. , “Biomarker localization by combining CNN classifier and generative adversarial network,” in Proc. Int. Conf. Med. Image Comput. Comput.-Assist. Intervention, 2019, pp. 209–217. [Google Scholar]
- [18].Sun L., Wang J., Huang Y., Ding X., Greenspan H., and Paisley J., “An adversarial learning approach to medical image synthesis for lesion detection,” IEEE J. Biomed. Heal. Inform., vol. 24, no. 8, pp. 2303–2314, Aug. 2020. [DOI] [PubMed] [Google Scholar]
- [19].Xia T., Chartsias A., and Tsaftaris S. A., “Pseudo-healthy synthesis with pathology disentanglement and adversarial learning,” Med. Image Anal., vol. 64, 2020, Art. no. 101719. [DOI] [PubMed] [Google Scholar]
- [20].Soares E., Angelov P., Biaso S., Froes M. H., and Abe D. K., “SARS-CoV-2 CT-scan dataset: A large dataset of real patients CT scans for SARS-CoV-2 identification,” medRxiv, 2020. [Online]. Available: https://www.medrxiv.org/content/10.1101/2020.04.24.20078584v3
- [21].“COVID-19 CT segmentation dataset,” https://medicalsegmentation. com/covid19/, 2020.
- [22].Goodfellow I. J. et al. , “Generative adversarial nets,” Adv. Neural Inf. Process. Syst., vol. 3, pp. 2672–2680, Jan. 2014, doi: 10.3156/jsoft.29.5_177_2. [DOI] [Google Scholar]
- [23].He K., Zhang X., Ren S., and Sun J., “Deep residual learning for image recognition,” in Proc. IEEE Conf. Comput. Vis. Pattern Recognit., 2016, pp. 770–778. [Google Scholar]
- [24].Zeiler M. D. and Fergus R., “Visualizing and understanding convolutional networks,” in Proc. Eur. Conf. Comput. Vis., 2014, pp. 818–833. [Google Scholar]
- [25].Mao X., Li Q., Xie H., Lau R. Y. K., and Wang Z., “Multi-class generative adversarial networks with the L2 loss function,” 2016, vol. 5, pp. 1057–7149, arXiv:1611.04076. [Google Scholar]
- [26].Paszke A. et al. , “PyTorch: An imperative style, high-performance deep learning library,” Adv. Neural Inf. Process. Syst., vol. 32, Art no. 8026, 2019. [Google Scholar]
- [27].Kingma D. P. and Ba J., “Adam: A method for stochastic optimization,” in Proc. Int. Conf. Learn. Representations, 2015. [Online]. Available: https://openreview.net/forum?id=8gmWwjFyLj [Google Scholar]
- [28].Heusel M., Ramsauer H., Unterthiner T., Nessler B., and Hochreiter S., “Gans trained by a two time-scale update rule converge to a local nash equilibrium,” in Adv. Neural Inf. Process. Syst., 2017, pp. 6626–6637. [Online]. Available: https://proceedings.neurips.cc/paper/2017/file/8a1d694707eb0fefe65871369074926d-Paper.pdf [Google Scholar]
- [29].Ronneberger O., Fischer P., and Brox T., “U-Net: Convolutional networks for biomedical image segmentation,” in Proc. Int. Conf. Med. Image Comput. Comput.-Assist. Intervention, 2015, pp. 234–241. [Google Scholar]
- [30].Ioffe S. and Szegedy C., “Batch normalization: Accelerating deep network training by reducing internal covariate shift,” in Proc. 32nd Int. Conf. Mach. Learn., vol. 1, 2015, Art no. 448. [Google Scholar]
- [31].Ulyanov D., Vedaldi A., and Lempitsky V., “Improved texture networks: Maximizing quality and diversity in feed-forward stylization and texture synthesis,” in Proc. IEEE Conf. Comput. Vis. Pattern Recognit., 2016. [Google Scholar]
- [32].Isola P., Zhu J.-Y., Zhou T., and Efros A. A., “Image-to-image translation with conditional adversarial networks,” in Proc. IEEE Conf. Comput. Vis. Pattern Recognit., 2017, pp. 1125–1134. [Google Scholar]
- [33].Karras T., Aila T., Laine S., and Lehtinen J., “Progressive growing of gans for improved quality, stability, and variation,” in Proc. Int. Conf. Learn. Representations, 2018. [Online]. Available: https://openreview.net/forum?id=Hk99zCeAb [Google Scholar]
- [34].Smilkov D., Thorat N., Kim B., Viégas F., and Wattenberg M., “Smoothgrad: Removing noise by adding noise,” Workshop Visual. Deep Learn., 2017. [Online]. Available: http://icmlviz.github.io/assets/papers/3.pdf
- [35].Gozes O., Frid-Adar M., Sagie N., Zhang H., Ji W., and Greenspan H., “Coronavirus detection and analysis on chest CT with deep learning,” 2020, arXiv:2004.02640.
- [36].Milletari F., Navab N., and Ahmadi S.-A., “V-Net: Fully convolutional neural networks for volumetric medical image segmentation,” in Proc. 4th Int. Conf. 3D Vis. (3DV), 2016, pp. 565–571. [Google Scholar]
- [37].Li X., Chen H., Qi X., Dou Q., Fu C.-W., and Heng P.-A., “H-DenseUNet: Hybrid densely connected UNet for liver and tumor segmentation from CT volumes,” IEEE Trans. Med. Imag., vol. 37, no. 12, pp. 2663–2674, Dec. 2018. [DOI] [PubMed] [Google Scholar]
- [38].Oktay O. et al. , “Attention u-net: Learning where to look for the pancreas,” in Proc. 1st Conf. Med. Imag. Deep Learn., 2018. [Online]. Available: https://openreview.net/forum?id=Skft7cijM [Google Scholar]
- [39].Schlemper J. et al. , “Attention gated networks: Learning to leverage salient regions in medical images,” Med. Image Anal , vol. 53, pp. 197–207, 2019. [DOI] [PMC free article] [PubMed] [Google Scholar]
- [40].Zhou Z., Siddiquee M. M. R., Tajbakhsh N., and Liang J., “Unet++: A nested u-net architecture for medical image segmentation,” in Deep Learning in Medical Image Analysis and Multimodal Learning For Clinical Decision Support, Germany: Springer, 2018, pp. 3–11. [DOI] [PMC free article] [PubMed] [Google Scholar]
- [41].Zhou Z. et al. , “Activation maximization generative adversarial nets,” in Proc. Int. Conf. Learn. Representations 2018. [Online]. Available: https://openreview.net/forum?id=HyyP33gAZ [Google Scholar]
- [42].Li C.-L., Chang W.-C., Cheng Y., Yang Y., and Póczos B., “MMD GAN: Towards deeper understanding of moment matching network,” in Proc. Adv. Neural Inf. Process. Syst., 2017, pp. 2203–2213. [Online]. Available: https://proceedings.neurips.cc/paper/2017/file/dfd7468ac613286cdbb40872c8ef3b06-Paper.pdf [Google Scholar]
- [43].Odena A., Olah C., and Shlens J., “Conditional image synthesis with auxiliary classifier gans,” in Proc. Int. Conf. Mach. Learn., 2017, pp. 2642–2651. [Google Scholar]
- [44].Pan F. et al. , “Time course of lung changes on chest CT during recovery from 2019 novel coronavirus (COVID-19) pneumonia,” Radiology, vol. 295, no. 3, Art no. 715, 2020. [DOI] [PMC free article] [PubMed] [Google Scholar]
- [45].Shen C. et al. , “Quantitative computed tomography analysis for stratifying the severity of coronavirus disease 2019,” J. Pharm. Anal., vol. 10, no. 2, pp. 123–129, 2020, doi: 10.1016/j.jpha.2020.03.004. [DOI] [PMC free article] [PubMed] [Google Scholar]
- [46].Ganin Y. et al. , “Domain-adversarial training of neural networks,” J. Mach. Learn. Res., vol. 17, no. 1, pp. 2030–2096, 2016. [Google Scholar]
- [47].Recht B., Roelofs R., Schmidt L., and Shankar V., “Do CIFAR-10 classifiers generalize to cifar-10?,” 2018, arXiv:1806.00451.


