

Abstract
The chest X-ray is considered a significant clinical utility for basic examination and diagnosis. The human lung area can be affected by various infections, such as bacteria and viruses, leading to pneumonia. Efficient and reliable classification method facilities the diagnosis of such infections. Deep transfer learning has been introduced for pneumonia detection from chest X-rays in different models. However, there is still a need for further improvements in the feature extraction and advanced classification stages. This paper proposes a classification method with two stages to classify different cases from the chest X-ray images based on a proposed Advanced Squirrel Search Optimization Algorithm (ASSOA). The first stage is the feature learning and extraction processes based on a Convolutional Neural Network (CNN) model named ResNet-50 with image augmentation and dropout processes. The ASSOA algorithm is then applied to the extracted features for the feature selection process. Finally, the Multi-layer Perceptron (MLP) Neural Network’s connection weights are optimized by the proposed ASSOA algorithm (using the selected features) to classify input cases. A Kaggle chest X-ray images (Pneumonia) dataset consists of 5,863 X-rays is employed in the experiments. The proposed ASSOA algorithm is compared with the basic Squirrel Search (SS) optimization algorithm, Grey Wolf Optimizer (GWO), and Genetic Algorithm (GA) for feature selection to validate its efficiency. The proposed (ASSOA + MLP) is also compared with other classifiers, based on (SS + MLP), (GWO + MLP), and (GA + MLP), in performance metrics. The proposed (ASSOA + MLP) algorithm achieved a classification mean accuracy of (99.26%). The ASSOA + MLP algorithm also achieved a classification mean accuracy of (99.7%) for a chest X-ray COVID-19 dataset tested from GitHub. The results and statistical tests demonstrate the high effectiveness of the proposed method in determining the infected cases.
Keywords: Chest X-ray, transfer learning, convolutional neural network, squirrel search optimization, multilayer perceptron, optimization algorithm
I. Introduction
Medical images are teeming with many features that can be considered for inspection. Generally, many processes in Computer-Aided System (CAD), such as pre-processing, isolating Regions of Interest (ROIs), and feature extracting process, can help to get the accurate classification of the diseases [1]. There are various approaches for highlighting ROIs, extracting the salient features, and suppressing the associated noises [2]–[4]. Rule-based techniques have limited performance, and to improve efficiency, they are usually consolidated. Traditional approaches focused on fetching geometric or handcrafted features are generally treated to reduce dimensionality, elapsed time, and redundancy features concerning extract salient features. Moreover, these methods suffer from failures that affect the classification accuracy. Hence, any improvements in the feature extraction step and the segmentation process are required [5]–[8]. For image classification tasks, some traditional classification methods have also achieved excellent results in recent years [9]–[12]; however, the deep learning methods have some advantages over the traditional methods. CNN’s (Convolutional Neural Networks) or pre-trained networks are commonly involved in different medical imaging tasks. They can offer rather good performance in analyzing high-resolution images as in abdominal X-rays. However, a need for sufficient amounts of the training dataset is a critical problem [13]–[15].
More training phases with large datasets are mainly required to apply the pre-trained networks for medical image classification tasks. Hence, in some cases, adopting these types of networks as classifiers are often not the preferred method to apply the CNN to the diagnosis tasks of CAD [16]–[18]. Using pre-trained networks (e.g., DCNNs), extra complicated datasets such as pneumonia’s presence/absence did not seem good. Therefore, more data augmentation samples and training can improve the efficiency [19], [20]. While identification systems based on CNN provide greater precision for various tasks, the key downside of these methods is the need for heavy training [21]–[23]. Hence, machine learning increases rapidly, which has caused many technical breakthroughs and is extensively employed in many fields. As a significant part of machine learning tasks, optimization has attracted much attention in several research areas. With the expedited growth of the amount of employed data and the increase of design complexity, optimization approaches in machine learning face more further challenges.
For a specific problem, optimization can be the most reliable solution between all available solutions, especially towards multi-dimensional space [24]. Practically, this involves maximization or minimization of an objective function. The objective function defines the solution candidate’s quality and efficiency represented by a particular vector in a search domain. There are two classes of optimization: nonlinear versus linear [25], [26]. Meta-heuristic algorithms are considered among the most powerful methods for solving real-world engineering problems [27]. Most of these algorithms’ derivation is done from physical algorithms’ rational behavior in nature, biological inspired algorithms’ behavior, swarm particles’ collective intelligence, and evolutionary algorithms’ fittest theory of survival [28], [29]. These optimization techniques provide acceptable solutions in a reasonable time with less computational effort. They are mostly used in engineering and science for finding solutions to complex and challenging problems because: a) of their utilization in different issues that come under other subjects, b) of no requirement of gradient information, c) they can bypass local optima, and d) they are easy to be implemented and are dependent on comparatively simple concepts.
This paper proposes a classification method to classify infected cases from the chest X-ray images. The method can decrease detection costs significantly. First, a feature learning stage is developed using the CNN model named ResNet-50 with image augmentation as a pre-processing and dropout as post-processing. Second, the features are extracted to start the feature selection process. A proposed Advanced Squirrel Search Optimization Algorithm (ASSOA) is developed for feature selection. The advanced classification stage starts to classify the infected cases using the optimized Multilayer Perceptron Neural Network (MLP) by the proposed ASSOA algorithm. ASSOA’s basic rule in the classification stage is to optimize the connection weights of MLP to improve accuracy. A dataset from Kaggle, chest X-ray images (Pneumonia) dataset [30] consists of 5,863 X-ray images used in experiments. A chest X-ray COVID-19 dataset [31] is also tested in the experiments. The proposed ASSOA algorithm is compared with the basic Squirrel Search (SS) optimization algorithm [32], Grey Wolf Optimizer (GWO) [29], and Genetic Algorithm (GA) [33] for feature selection to test its efficiency. The ASSOA + MLP algorithm is also compared with other classifiers, based on (SS + MLP), (GWO + MLP), and (GA + MLP), in performance metrics. Moreover, Wilcoxon rank-sum and one-way analysis of variance (ANOVA) are tested to statistically verify the proposed algorithm’s superiority.
This paper’s main contributions are as follows:
-
•
An Advanced Squirrel Search Optimization Algorithm (ASSOA) is developed for feature extraction and classification.
-
•
The proposed ASSOA algorithm adds horizontal, vertical, diagonal, and exponential movements to the basic moves in the search process of the basic SS algorithm.
-
•
A new agents’ relocation equation is modeled in the proposed ASSOA algorithm, affecting local and global optima under specific conditions.
-
•
A classification method for chest X-ray images is proposed based on the ASSOA algorithm.
-
•
The classification method is tested using a dataset from Kaggle with 5,863 chest X-ray images.
-
•
The classification method is also tested for a chest X-ray COVID-19 dataset from GitHub.
-
•
Wilcoxon rank-sum and ANOVA statistical tests are performed to ensure the proposed ASSOA algorithm quality.
The next sections of this paper are as follows: Section II presents the related works. The materials and methods used in the study are defined in Section III. In-depth, Section IV describes the proposed method and the ASSOA algorithm. The experimental results are shown in Section V. Section IV discusses the proposed method findings. The research conclusions are seen in section VII.
II. Related Work
Large datasets availability and the recent advances in deep learning models have led to the possession of power-assisted algorithms, which beats the medical professionals in various clinical image resolution. These images are such as cancer classification [34], detection of arrhythmia [35], [36], identification of haemorrhage [37], and diagnosis/detection of diabetic retinopathy [38]. Using radiography, the automated diagnosis of chest diseases has gained a lot of enthusiasm and interest. Several CNN models’ efficiency on various oddities certainly does not do well with all abnormalities, deep-learning approaches, and ensemble models may improve classification accuracy considerably reviewed to other Versions. Statistical dependence was studied between the precision levels of the predictions and the Multi-label Disease Classification (MDC). In the literature, the detection of health conditions from chest X-ray images was performed based on different methods [39]–[41]. The processes for X-ray cardiovascular angiogram images are proposed in the literature [42], [43].
Recent research has implemented several automatic pneumonia detection systems based on chest X-rays [44], [45]. Deep learning is applied for the training AI algorithms to detect pneumonia by studying chest X-ray images [46]. In terms of accuracy, Chhikara et al. achieved an accuracy of (90.1%) in [47] using 5,866 chest X-ray images compared to the latest models of classification. The CNN model proposed by Okeke Stephen et al. in [34], was constructed by extracting characteristics from the images of chest X-ray to test the existence of pneumonia. The authors in that model deployed multiple data augmentation algorithms to enhance both validation and classification accuracy of their model to achieve an accuracy of (93.73%).
An AI approach to diagnosing COVID-19 and other types of pneumonia is already developed in [48]. For COVID-19, their proposed method achieved an AUC (area under the curve) of (0.981) and accuracy of (92.49%). Butt et al. in [49] A CNN model called ResNet-18 was proposed to classify the CT images as COVID-19, regular, and pneumonia. With an AUC value of (0.996), they can achieve an accuracy of (86.7%). Authors in [50] The nCOVnet, based on deep learning, was proposed to detect COVID-19 by analyzing patients’ X-ray images. Their nCOVnet system obtained an AUC of (0.881) and a COVID-19 accuracy of (88.10%).
Nour et al. [51] using X-ray images, a CNN model trained from scratch was suggested. The model’s extracted features fed K-NN, SVM, and decision tree in their model. The SVM classifier achieved an accuracy of (98.97%). Hu et al. in [52] A weakly-supervised CNN model was proposed, which achieved an accuracy of (96.2%) with an AUC value of (0.970). To classify the chest’s x-ray images into COVID-19 or non-COVID-19, an ML-method in [53] was proposed. A Manta-Ray Foraging Optimization technique, using differential evolution, was developed for feature selection. The authors evaluated their method by testing two COVID-19 x-ray datasets. The recent machine learning research for CT and X-ray images is summarized in Table 1.
TABLE 1. Recent Machine Learning Research for Classification of CT and X-Ray Images.
| Reference | Methods | # of samples | # of classes | Type of Images | Accuracy | AUC |
|---|---|---|---|---|---|---|
| X. Wang et al. (2020) [52] | Weakly supervised deep learning model | 450 | 3 | CT | 96.2% | 0.970 |
| K. Zhang et al. (2020) [48] | AI system based on ResNet-18 | 3,777 | 3 | CT | 92.49% | 0.981 |
| C. Butt et al. (2020) [49] | Multiple CNN models based on ResNet-18 | 618 | 3 | CT | 86.7% | 0.996 |
| O. Stephen et al. (2019) [34] | Efficient Deep Learning Approach | 200 | 2 | X-ray | 93.73% | —- |
| D. Varshni et al. (2019) [46] | DenseNet-169+SVM | 2862 | 2 | X-ray | —- | 0.8 |
| H. Panwar et al. (2020) [50] | nCOVnet, transfer learning, deep CNN | 337 | 2 | X-ray | 88.10% | 0.881 |
| M. Nour et al. (2020) [51] | Training CNN model, feature extraction, SVM | 2,905 | 3 | X-ray | 98.97%, | 0.994 |
| P. Chhikara et al. (2020) [47] | Deep CNN with Transfer Learning | 5866 | 2 | X-ray | 90.16% | 0.911 |
| M. A. Elaziz et al. (2020) [53] | MRFODE feature selection method, KNN classifier | 1891 | 2 | X-ray | 96.09% | —- |
| 1560 | 2 | X-ray | 98.09% | —- |
Therefore, building a classification method for various infections is one of the most critical issues prohibitively expensive for mass adoption. Deep transfer learning has been introduced for pneumonia detection from chest X-rays in different literature models. However, there is still a need for more improvements in the feature extraction and classification stages.
III. Materials and Methods
This section introduces the chest X-ray datasets used in this paper and will also discuss the essential CNN deep transfer learning, multilayer perceptron neural network, and the original Squirrel Search (SS) optimization algorithm.
A. Datasets
Chest (Pneumonia) X-ray images from Kaggle dataset [30] has been used. In (JPEG) format, the dataset has 5,863 X-rays. It is classified into two cases, either normal or pneumonia. In this paper, The Kaggle dataset has been selected because it is used in many forms of research globally and makes comparisons that can enrich scientific research. Figure 1(a) shows image samples of normal Pneumonia-free cases, while Fig. 1(b) and Fig. 1(c) present Pneumonia image samples (Bacteria and Viral cases), respectively. Another chest X-ray COVID-19 dataset [31] is also tested in the experiments and image samples are shown in Fig. 2. Besides indirect collection from hospitals and physicians, the COVID-19 dataset is obtained from public sources. In the GitHub repo, all data and images are released publicly. The tested dataset’s project was accepted by the Ethics Committee of the University of Montreal #CERSES-20-058-D.
FIGURE 1.

Samples of the original chest X-ray images [30]; (a) Normal cases, (b) Bacteria cases, and (c) Viral cases.
FIGURE 2.

Samples of the original chest X-ray COVID-19 infected cases [31] tested in the experiments.
B. Deep Transfer Learning and CNN
In traditional learning, the model is isolated and based mainly on specific tasks and particular datasets [54]. The knowledge, in this learning, cannot be transferred from one model to another. In the transfer learning, knowledge, such as features and weights, can be transferred from the pre-trained model to new training models and different problems that may have fewer data. Transfer Learning is usually applied in various models for a dataset with less data than the dataset used to train the model. Multitask learning allows several tasks to learn simultaneously, which can help the model receive multiple tasks at once. The learner initially may have no idea about the target task [47].
CNN’s [55], a deep neural network, is known to be ideal for image processing applications and can achieve greater precision in the subject of disease classification than conventional approaches. It can thus be used in applications such as clustering, detecting objects, and classifying images. Several CNN models have recently been introduced, such as AlexNet, [56], VGGNet [57], GoogLeNet [58], Spotmole [59] and ResNet [60]. Convolution models used in the CNN models have different layers; higher classification accuracy is achieved if the number of convolution layers increases. [61]–[63].
Residual Network (ResNet) is known as an efficient CNN model [60]. The ResNet model was declared in 2016 to be the best paper at the Computer Vision and Pattern Recognition Conference (CVPR 06). The ResNet concept is based on the assumption that only a residual correction of the previous layer should be a deeper network training that can function efficiently, not transforming the whole feature space. The main idea of ResNets is not to learn the mapping from  , but instead learns the mapping from
  . Thus, if output
  , for input
  , have the same dimension,
  function is identity and the connection is identity. ResNet, without exploding and gradient vanishing issues, has much deeper neural network training.
C. Multilayer Perceptron
Feed-forward neural networks are considered supervised machine learning methods consisting of neurons distributed over fully connected layers. The first (input) layer maps the network input variables, and the last layer is the output one. Layers between the first and last layers are called hidden layers [64], [65]. Multilayer perceptron (MLP) is a common type of feed-forward network. The neurons interconnect in MLP, are one-directional fashion. The weights of the connections are within [−1, 1]. Figure 3 shows the MLP network, which includes one layer between input and output. To calculate the node output value, the weighted sum is firstly calculated as follows:
 |
where  represents input variable
  and
and  indicates connection weight between
  and neuron
  in the hidden layer.
  is bias value for this layer. By applying the sigmoid activation function, which is the mostly applied, node
  output is defined as
 |
FIGURE 3.

Neural Network - Multilayer Perceptron (MLP).
Based on the value of  for all hidden layer neurons, the following equation can define the network output:
 |
where  indicates weights between neuron
  in the hidden layer and output node
  and
and  is the bias value for the output layer.
D. Squirrel Search Basic Optimization Algorithm
The Squirrel Search (SS) basic optimization algorithm simulates the search process of flying squirrels [32]. The SS algorithm considers that the squirrels are moving between three kinds of trees named normal, oak, and hickory trees. The oak and hickory trees are the nuts food source, while normal trees have no food source. Mathematically, the SS algorithm assumes the squirrels are flying to search for three oak trees and one hickory tree as nutritious food resources  available for
  flying squirrels (
 ).
).
The flying agents’ locations is in matrix form as follows:
 |
where  indicates
  flying squirrel in the
  dimension for
  and
and  . The initial locations of
  are uniform distribution within lower and upper bounds. The fitness values
  are calculated for each flying squirrel as in the following array
 |
where the fitness value indicates the food source quality searched by each flying squirrel. The optimal value means a hickory tree. These values are then reordered in ascending order. The first best solution in declared to be  on the hickory nut tree followed by three best solutions that are considered to be
  on the acorn nuts trees. The remaining solutions are supposed to be
  on normal trees.
New location generation mathematically for each flying squirrel is considered as one of the three following cases:
-
Case 1:Location of
 and moving to the hickory nut tree:
-
Case 2:Location of
 and moving to the acorn nut trees:
-
Case 3:Location of
 and moving to the hickory nut tree:
where
 ,
,  , and
, and  are random numbers
  . The
. The  parameter is random distance for gliding and
  indicates the current iteration.
  is equal to 1.9 and it is constant to achieve exploration and exploitation balance, and the value of
  probability is equal to 0.1 for the three cases.
The seasonal constant ( ) is calculated from the following equation to check the monitoring condition (
 ) as
) as
 |
where  is the current iteration and
  represents the maximum iteration value. The value of
  can affect the algorithm exploration and exploitation capabilities during iterations. If specific condition is occurred, such flying squirrels’s relocation is modeled by Eq. 11
 |
where the distribution  helps in encouraging better search space exploration. The calculation of the
  flight is as follows:
 |
where the parameters  and
and  are random in [0, 1].
  is equal to 1.5 in the SS algorithm and
  is calculated as
 |
where  . The basic Squirrel Search (SS) optimization algorithm is explained step by step in Algorithm 1.
Algorithm 1 Basic SS Optimization Algorithm [32]
-
1:
Initialize SS population
 with size
  using Eq. (4), maximum iterations
  , and fitness function
  .
. -
2:
Initialize SS parameters
 ,
,  ,
,  ,
,  ,
,  ,
,  ,
,  ,
,  ,
, 
-
3:
Calculate fitness function
 for each
  using Eq. (5)
 -
4:
Sort flying squirrels locations in ascending order
-
5:
Find the first best individual

-
6:
Find the next three best individuals

-
7:
Find the normal individuals

-
8:
while
 (Stopping condition) do
 -
9:
for (
 ) do
) do -
10:
if (
 ) then
 -
11:

-
12:
else
-
13:

-
14:
end if
-
15:
end for
-
16:
for (
 ) do
) do -
17:
if (
 ) then
 -
18:

-
19:
else
-
20:

-
21:
end if
-
22:
end for
-
23:
for (
 ) do
) do -
24:
if (
 ) then
 -
25:

-
26:
else
-
27:

-
28:
end if
-
29:
end for
-
30:
Calculate seasonal constant (
 ) using Eq. (9)
 -
31:
Calculate minimum value of seasonal constant (
 ) using Eq. (10)
 -
32:
if (
 ) then
 -
33:

-
34:
end if
-
35:
Update
 using Eq. (10)
 -
36:
Set

-
37:
end while
-
38:
Return optimal solution

IV. Proposed Classification Method
The proposed classification method consists of two stages. The first stage has a feature engineering process, including image augmentation, CNN training using the ResNet-50 model, transfer learning, and dropout. The proposed ASSOA algorithm is then applied to select features from the ResNet-50 model’s extracted features. The second stage involves the classification process to classify cases in which the MLP is optimized by the proposed ASSOA algorithm (ASSOA + MLP).
A. Feature Engineering Stage
The ResNet-50 model is applied in this stage as a part of the proposed method for features extraction from the chest X-ray images in the fully connected layer by altering the nodes and doing a fine-tuning based on the input dataset. Each input image is resized to  pixels to be suitable for the model. Then, the Min-Max-Scalar is used to normalize the
  th input image
  to a scale from 0 to 1 by applying the following equation.
 |
After the resizing and normalization, the output image  is used as input to the CNN model. The adopted CNN structure of the number of filters and layers and the related specifications are identical to the ResNet-50 model. This model focuses on classifying input case categories. To reduce the overfitting problem during network learning, two regularization techniques of dropout and image augmentation have been applied in this research. The dropout is applied during the training procedure of CNN, and image augmentation [66] is used for the X-ray images’ input images. Data Augmentation is applied to improve the quality and size of the training datasets.
B. The Proposed ASSOA Algorithm
The proposed ASSOA algorithm adds horizontal, vertical, diagonal, and exponential movements to the basic moves in the search process of flying squirrels, as shown in Fig. 4. The ASSOA algorithm considers, as in the basic SS algorithm, that the squirrels are moving between three kinds of trees named normal, oak, and hickory trees. The nuts food sources are the oak and hickory trees, while there are no food sources on the other trees.
FIGURE 4.

Squirrel movements in the Proposed Advanced Squirrel Search Optimization Algorithm (ASSOA).
Mathematically, the ASSOA algorithm assumes the squirrels are flying in directions shown in Fig. 4 to search for one hickory tree, the best solution, and three oak trees, next best solutions, as nutritious food resources  available for
  flying squirrels (
 ). The following matrices represent the flying squirrels’ locations and velocities:
 |
where  indicates
  flying squirrel location in the
  dimension for
  and
and  .
.  indicates
  flying squirrel velocity in the
  dimension for
  and
and  . The initial locations of
  are uniform distribution within lower and upper bounds. The fitness values
  are calculated for each flying squirrel as in Eq. 5. The optimal value means a hickory tree. These values are then sorted in ascending order. The first best solution in declared to be
  on the hickory nut tree followed by three best solutions that are considered to be
  on the acorn nuts trees. The remaining solutions are supposed to be
  on normal trees.
In the ASSOA algorithm, the new location generation for each flying squirrel is updated as in the following cases. For a random value  , the following cases will be applied if
  :
:
-
Case 1:Location of
 and moving to the hickory nut tree:
-
Case 2:Location of
 and moving to the acorn nut trees:
-
Case 3:Location of
 and moving to the hickory nut tree:
where
 ,
,  , and
, and  are random numbers
  . The
. The  parameter is random distance for gliding and
  indicates the current iteration.
  is equal to 1.9 and it is constant to achieve the exploration and exploitation balance, and the value of
  probability is equal to 0.1 for the three cases.
For the random value
 , the following cases will be applied if
  :
: -
Case 4:Location of
 and moving diagonally:
where
 ,
,  ,
,  ,
,  , and
, and  are random numbers
  . In case of choosing a random agent
  from the normal agents
  , the fitness value
  for
for  and
and  for
for  will be calculated to decide about the horizontal and vertical movement. In case of
  , the movement will be vertically and it will be horizontally otherwise as follow
 -
Case 5:Location of
 and moving vertically or horizontally based on the fitness value
  :
:
where
 is a random number
  . The last case will be applied if the condition of the horizontal and vertical movement is not achieved.
 -
Case 6:Location of
 and moving will be exponentially:
where
 is a random number
  .
.
The seasonal constant ( ) and the minimal value of the seasonal constant
  are calculated from Eq. 9 and Eq. 10 to check the monitoring condition (
 ) for
) for  is the current iteration and
  indicates iterations maximum value. The value of
  can affect the algorithm exploration and exploitation capabilities during iterations. If specific condition is occurred, such flying squirrels’s relocation is modeled by Eq. 23 which has the effect on local and global optima as shown in Fig. 5:
 |
FIGURE 5.

Local and global optima of the proposed ASSOA algorithm.
The proposed ASSOA algorithm is explained step by step in Algorithm 2. The proposed algorithm’s computational complexity will be discussed as shown in Algorithm 2. Let the number of population be  ; the maximum number of iterations be
  . For parts of the ASSOA algorithm, the time complexity will be defined as in the following points:
-
•
Initialize of ASSOA population:
 (1).
(1). -
•
Initialize of ASSOA parameters
 ,
,  ,
,  ,
,  ,
,  ,
,  ,
,  ,
,  ,
,  ,
,  ,
,  ,
,  ,
,  ,
,  ,
,  ,
,  ,
,  ,
,  :
:  (1).
(1). -
•
Calculate fitness function for each agent:
 (
( ).
). -
•
Sorting agents in ascending order:
 (
( ).
). -
•
Finding first best individual, next three best individuals, normal individuals:
 (
( ).
). -
•
Positions’ updating for each agent in case 1:
 (
( ).
). -
•
Positions’ updating for each agent in case 2:
 (
( ).
). -
•
Positions’ updating for each agent in case 3:
 (
( ).
). -
•
Positions’ updating for each agent in case 4:
 (
( ).
). -
•
Positions’ updating for each agent in case 5:
 (
( ).
). -
•
Positions’ updating for each agent in case 6:
 (
( ).
). -
•
Calculating the seasonal constant:
 (
( ).
). -
•
Calculating the minimum value of seasonal constant:
 (
( ).
). -
•
Relocation of agents:
 (
( ).
). -
•
3 Iteration number increment:
 (
( ).
). -
•
Returning the best individual:
 (1)
(1)
The above analysis indicates that the proposed ASSOA algorithm’ complexity of computations is  (
( ) and in case of a problem with
  dimension is
  (
( ).
).
Algorithm 2 Proposed ASSOA Algorithm
-
1:
Initialize ASSOA population
 with size
  using Eq. (15), velocities
  using Eq. (16), maximum iterations
  , and fitness function
  .
. -
2:
Initialize ASSOA parameters
 ,
,  ,
,  ,
,  ,
,  ,
,  ,
,  ,
,  ,
,  ,
,  ,
,  ,
,  ,
,  ,
,  ,
,  ,
,  ,
,  ,
,  ,
, 
-
3:
Calculate fitness function
 for each
  using Eq. (5) and Sort flying squirrels locations in ascending order
 -
4:
Find the first best individual
 , the next three best individuals
  , the normal individuals
-
5:
while
 (Stopping condition) do
 -
6:
if (
 ) then
 -
7:
for (
 ) do
) do -
8:
if (
 ) then
 -
9:

-
10:
else
-
11:

-
12:
end if
-
13:
end for
-
14:
for (
 ) do
) do -
15:
if (
 ) then
 -
16:

-
17:
else
-
18:

-
19:
end if
-
20:
end for
-
21:
for (
 ) do
) do -
22:
if (
 ) then
 -
23:

-
24:
else
-
25:

-
26:
end if
-
27:
end for
-
28:
else
-
29:
if (
 ) then
 -
30:

-
31:
else
-
32:
Choose random agent
 from normal agents
-
33:
if (
 ) then
 -
34:
Calculate fitness function
 for
for 
-
35:
if (
 ) then
 -
36:

-
37:
else
-
38:

-
39:
end if
-
40:
else
-
41:

-
42:
end if
-
43:
end if
-
44:
end if
-
45:
Calculate seasonal constant (
 ) using Eq. (9)
 -
46:
Calculate minimum value of seasonal constant (
 ) using Eq. (10)
 -
47:
if (
 ) then
 -
48:

-
49:
end if
-
50:
Update
 using Eq. (10)
 -
51:
Set t = t +1
-
52:
end while
-
53:
Return optimal solution

C. Binary Optimizer
In the feature selection problem, the search space is represented by only binary values of 0 and 1. Thus, the proposed ASSOA algorithm’s continuous values are converted into binary values for the process of feature selection based on the ResNet-50 model’s extracted features. The following equation will be applied to get the binary values from the standard continuous values of the proposed ASSOA algorithm.
 |
where  is the binary position at iteration
  of
of  dimension. The
  function scales the continuous values to be zero or one.
  condition is employed here to filter the values to be o or 1. the
  value indicates the best solution of the algorithm which is denoted as
  in Algorithm 2.
D. Fitness Function
The fitness function measures the optimizer solutions’ quality. The function is dependent on the classification error rate and the selected features. The excellent solution corresponds to a set of features that give lower features and classification error rate. To evaluate the solution quality, Eq. 25 can be employed
 |
where  indicates the optimizer error rate,
  denotes the set of features selected by the optimizer,
  denotes the features’ total number. The
  values manage the importance of the error rate of classification process and the selected feature number.
V. Experimental Results
There are three scenarios in the experiments. The first scenario shows the effectiveness of four CNN models for classifying the chest X-ray cases and offers the importance of features extraction for the next stage. The second scenario is designed to test and compare the proposed ASSOA algorithm to other optimization algorithms for feature selection. The third scenario is conducted to test the proposed ASSOA algorithm’s ability as a classifier for improving the classification accuracy based on MLP. Wilcoxon’s rank-sum test is performed to verify the proposed algorithm’s superiority statistically. For the chest X-ray datasets, the images are separated randomly into training images of (60%), validation images of (20%), testing images of (20%). The data in the training process is used to train the CNN model. In contrast, the validation process data is applied for verification purposes, and the testing data evaluated the efficiency of the proposed method for the unknown chest X-ray cases.
A. First Scenario
The classification accuracy of the four CNN models namely AlexNet [56], VGGNet [57], GoogLeNet [58], and ResNet-50 [60] is claculated in this scenario for the tested chest X-ray dataset. Let  indicates true-positive value,
  represents false-positive value,
  indicates true-negative value, and
  represents false-negative value. The performance metrics, such as accuracy, precision, and F-score [29], are calculated to measure the classification performance of the CNN models as shown in Table 2. The results of this scenario including the required CPU time are shown in Table 3.
TABLE 2. Performance Metrics for Classification.
| Metric | Value |
|---|---|
| Accuracy |  |
| Specificity |  |
| Sensitivity |  |
| Negative Predictive Value (NPV) |  |
| Precision (PPV) |  |
| F-score |  |
TABLE 3. Performance Metrics Outputs of the Compared Deep Learning Approaches.
| Method/Metric | Accuracy | Sensitivity | Specificity | PPV | NPV | F-score | Time (s) |
|---|---|---|---|---|---|---|---|
| AlexNet | 0.820 | 0.840 | 0.610 | 0.670 | 0.850 | 0.745 | 724 |
| VGGNet | 0.869 | 0.741 | 0.751 | 0.997 | 0.249 | 0.850 | 747 |
| GoogLeNet | 0.880 | 0.910 | 0.890 | 0.800 | 0.920 | 0.851 | 841 |
| ResNet-50 | 0.910 | 0.950 | 0.920 | 0.840 | 0.950 | 0.892 | 203 |
Table 4 presents the settings of the CNN experimental setup in this scenario. The default parameters are used in this case since the current stage is employed for feature extraction of the chest X-ray images from the CNN model to be used for the next scenario. The highest accuracy achieved in this case, for the X-ray images, is (91.0%) by the ResNet-50 model with an F-score of (89.2%) and required time of (203) seconds. According to the promising performance of the ResNet-50 model, a set of features is extracted from the model’s earlier layers since the model accuracy should be improved for the critical cases. In the second scenario, these features are employed to extract the best classification features by the proposed ASSOA algorithm.
TABLE 4. CNN Experimental Setup.
| Parameter | Value |
|---|---|
| CNN training options (Default) | |
| RateDropFactor | 0.1000 |
| Momentum Learn | 0.9000 |
| L2Regularization | 1.0000 e-04 |
| LearnRateDropPeriod | 10 |
| GradientThreshold | Inf |
| GradientThresholdMethod | 12 norm |
| ValidationData | imds |
| VerboseFrequency | 50 |
| ValidationPatience | Inf |
| ValidationFrequency | 50 |
| ResetInputNormalization | 1 |
| CNN training options (Custom) | |
| InitialLearnRate | 1.0000 e-04 |
| ExecutionEnvironment | gpu |
| MiniBatchSize | 8 |
| MaxEpochs | 20 |
| Verbose | 0 |
| Shuffle | every-epoch |
| LearnRateSchedule | piecwise |
| Optimizer | sgdm |
B. Second Scenario
In this scenario, the efficiency of feature selection by the proposed ASSOA algorithm is investigated. ASSOA algorithm performance is compared with the basic Squirrel Search (SS) optimization algorithm [32], Grey Wolf Optimizer (GWO) [29], and Genetic Algorithm (GA) [33] based on performance metrics shown in Table 5. Let  be the number of runs of an optimizer;
  represents the best solution at the run number
  ;
;  is the size of the vector
  .
.  is the number of tested points;
  is the classifier’s output label for a point
  ;
;  is the class’s label for a point
  ; the total number of features (
 ); and matching between two inputs is calculated by
  function. The metrics used in this scenario are average error, select size, fitness, best and worst fitness, and standard deviation fitness. ASSOA algorithm configuration setting is shown in Table 6.
  parameter in the objective function is assigned to 0.99 and
  parameter to 0.01. The configuration of the SS, GWO, GA algorithms, including the number of iterations, agents, and parameters, is shown in Table 7.
TABLE 5. Performance Metrics for Feature Selection.
| Metric | Value |
|---|---|
| Average Error |  |
| Average Select Size |  |
| Average Fitness |  |
| Best Fitness |  |
| Worst Fitness |  |
| Standard Deviation |  |
TABLE 6. Proposed ASSOA Algorithm Configuration.
| Parameter | Value |
|---|---|
| Number of iterations | 50 |
| Number of agents | 10 |
 |
[0,1] |
 |
[0,1] |
 |
[0,1] |
 |
1.9 |
 |
0.1 |
 , , , ,
|
[0,1] |
 |
[0,1] |
 |
[0,1] |
 , ,  , ,  , , 
|
[0,1] |
TABLE 7. Compared Algorithms Configuration.
| Algorithm | Parameter (s) | Value (s) |
|---|---|---|
| SS | Number of iterations | 50 |
| Number of agents | 10 | |
 |
[0,1] | |
 |
[0,1] | |
 |
[0,1] | |
 |
1.9 | |
 |
0.1 | |
| GWO | No. of iterations | 50 |
| No. of wolves | 10 | |
 |
2 to 0 | |
| GA | Generations | 50 |
| Population size | 10 | |
| Mutation ratio | 0.1 | |
| Crossover | 0.9 | |
| Selection mechanism | Roulette wheel |
Table 8 shows the ASSOA, SS, GWO, and GA algorithms’ output results in this scenario. For the displayed results, if the optimizer can select the proper set of features, the error is minimized. ASSOA can achieve a minimum average error of (0.2113) for feature selection. Based on the tested problem’s minimum error, the ASSOA algorithm is the best, and GA is the worst. This means that the proposed ASSOA algorithm achieved better results than the original SS algorithm. In terms of standard deviation, the ASSOA algorithm has the lowest value than other algorithms that indicate the algorithm’s robustness and stability. Figure 6 shows the ASSOA convergence curve compared to different algorithms. The figure demonstrates the optimizer exploitation capability and the ability of the algorithm to avoid local optima. The figure results show the reliability and robustness of the ASSOA algorithm to get the optimal set of features in a minimum time.
TABLE 8. Performance of the Proposed ASSOA Algorithm for Feature Selection Compared to Other Algorithms.
| Metric / Optimizer | ASSOA | SS | GWO | GA |
|---|---|---|---|---|
| Average error | 0.2113 | 0.2956 | 0.3243 | 0.3317 |
| Average Select size | 0.7333 | 0.7967 | 0.8000 | 0.8000 |
| Average Fitness | 0.1236 | 0.1602 | 0.1673 | 0.1752 |
| Best Fitness | 1.2812 | 1.3012 | 1.3909 | 1.4009 |
| Worst Fitness | 1.4061 | 1.4854 | 1.5057 | 1.5142 |
| Standard deviation Fitness | 0.0047 | 0.0055 | 0.0061 | 0.0067 |
FIGURE 6.

Proposed ASSOA Convergence curves compared to other techniques; Green, purple, red, and yellow lines indicates ASSOA, SS, GWO, GA algorithms, respectively.
The p-values of the ASSOA algorithm are tested compared to SS, GWO, and GA algorithms by Wilcoxon’s rank-sum test. The employed test can get if there is a significant difference between the ASSOA algorithm and other algorithms. If the p-value < 0.05, this indicates that the ASSOA algorithm results are significantly different from other algorithms. If p-value >0.05, this indicates that the algorithm results have no significant difference. The p-value results in this scenario are shown in Table 9. Results show that the p-values are less than 0.05, proving the superiority of the proposed ASSOA algorithm and that the algorithm has statistically significant.
TABLE 9. Proposed ASSOA Algorithm’s p-Values in Comparison to Other Algorithms Using Wilcoxon’s Rank-Sum Based on Average Error Metric.
| Compared Algorithms | SS | GWO | GA |
|---|---|---|---|
| p-value | 1.21E-05 | 1.21E-05 | 1.21E-05 |
C. Third Scenario
The last scenario checks the classification accuracy of the ASSOA algorithm based on MLP (ASSOA + MLP) in comparison with other algorithms of SS + MLP, GWO + MLP, and GA + MLP. The classification performance is tested for chest X-ray cases and other cases based on chest X-ray COVID-19. The configuration of the proposed ASSOA algorithm and the compared algorithms are shown in Table 6 and Table 7, respectively. Metrics of the classification performance used in this scenario are presented in Table 2.
1). Chest X-Ray Classification Results
The results of the ASSOA + MLP algorithm and other algorithms regarding accuracy are shown in Table 10. The proposed algorithm (ASSOA + MLP) from the descriptive statistics, as shown in Table 10, can achieve a mean accuracy of (99.26%) and a standard deviation of (0.001098) within (135) seconds to classify a new input X-ray chest image which outperforms other algorithms. The ROC curves of the proposed ASSOA algorithm based on MLP versus the compared classification algorithms are shown in Figure 7. From this figure, the proposed algorithm can highly distinguish among the X-ray chest images with a high AUC value equal to (0.9875). The Box plot accuracy and Histogram of accuracy are also tested, and the output figures are shown in Figures 8 and 9. These figures show the stability and consistency of the proposed algorithm for the classification of different cases.
TABLE 10. Descriptive Statistics and the Classification Accuracy of the ASSOA Algorithm Based on MLP in Comparison to Other Algorithms for Chest X-Ray Images.
| ASSOA + MLP | SS + MLP | GWO + MLP | GA + MLP | |
|---|---|---|---|---|
| Number of values | 20 | 20 | 20 | 20 |
| Minimum (Accuracy) | 0.991 | 0.9681 | 0.9541 | 0.9359 |
| 25% Percentile | 0.9914 | 0.9718 | 0.9594 | 0.9387 |
| Median (Accuracy) | 0.9926 | 0.9777 | 0.9624 | 0.9431 |
| 75% Percentile | 0.9938 | 0.9825 | 0.969 | 0.9469 |
| Maximum (Accuracy) | 0.9938 | 0.9853 | 0.9718 | 0.9531 |
| Range | 0.002737 | 0.01715 | 0.01763 | 0.01722 |
| Mean (Accuracy) | 0.9926 | 0.9773 | 0.9633 | 0.9435 |
| Std. Deviation | 0.001098 | 0.0057 | 0.005878 | 0.005367 |
| Std. Error of Mean | 0.0002455 | 0.001275 | 0.001314 | 0.0012 |
| Lower 95% CI of mean | 0.9921 | 0.9746 | 0.9606 | 0.9409 |
| Upper 95% CI of mean | 0.9931 | 0.98 | 0.9661 | 0.946 |
| Coefficient of variation | 0.1106% | 0.5832% | 0.6102% | 0.5688% |
| Geometric mean | 0.9926 | 0.9773 | 0.9633 | 0.9434 |
| Geometric SD factor | 1.001 | 1.006 | 1.006 | 1.006 |
| Lower 95% CI of geo. mean | 0.9921 | 0.9746 | 0.9606 | 0.9409 |
| Upper 95% CI of geo. mean | 0.9931 | 0.98 | 0.9661 | 0.946 |
| Harmonic mean | 0.9926 | 0.9773 | 0.9633 | 0.9434 |
| Lower 95% CI of harm. mean | 0.9921 | 0.9746 | 0.9606 | 0.9409 |
| Upper 95% CI of harm. mean | 0.9931 | 0.9799 | 0.9661 | 0.9459 |
| Lower 95% CI of quad. mean | 0.9921 | 0.9746 | 0.9606 | 0.941 |
| Upper 95% CI of quad. mean | 0.9931 | 0.98 | 0.9661 | 0.946 |
| Skewness | −0.1304 | −0.1544 | −0.04561 | 0.2562 |
| Kurtosis | −1.721 | −1.269 | −1.248 | −0.8069 |
| Sum | 19.85 | 19.55 | 19.27 | 18.87 |
FIGURE 7.

ROC curves for ASSOA algorithm versus compared algorithms.
FIGURE 8.

Box plot accuracy of the proposed ASSOA + MLP algorithm compared to other algorithms for chest X-ray dataset.
FIGURE 9.

Histogram of accuracy of the proposed ASSOA + MLP algorithm compared to other algorithms for chest X-ray dataset.
Wilcoxon’s rank-sum and ANOVA tests are performed in this scenario to get the ASSOA + MLP algorithm’s p-values compared to SS + MLP, GWO + MLP, GA + MLP classification algorithms. These tests can indicate the significant difference between the ASSOA + MLP algorithm results and compared algorithms. The output p-values are shown in Table 12 for Wilcoxon’s rank-sum test, and in Table 11 for ANOVA test. Note that the p-values are less than 0.05, which indicates the superiority of the ASSOA + MLP algorithm and that the algorithm is statistically significant.
TABLE 12. The ASSOA + MLP Algorithm’s p-Values in Comparison to Other Algorithms Using Wilcoxon’s Rank-Sum Based on Accuracy Metric.
| Compared Algorithms | SS + MLP | GWO + MLP | GA + MLP |
|---|---|---|---|
| p-value | 1.11E-05 | 1.11E-05 | 1.11E-05 |
TABLE 11. ANOVA Test Results of the Proposed ASSOA + MLP Algorithm for Chest X-Ray Dataset.
| ANOVA table | SS | DF | MS | F (DFn, DFd) | P value |
|---|---|---|---|---|---|
| Treatment (between columns) | 0.02618 | 3 | 0.008728 | F (3, 76) = 359.7 | P ¡ 0.0001 |
| Residual (within columns) | 0.001844 | 76 | 2.43E-05 | – | – |
| Total | 0.02803 | 79 | – | – | – |
The possible problems can be observed from the residual values, and residual plots rather than the original dataset plot since some datasets are not good candidates for classification. The ideal case is achieved if the residual values are equally and randomly spaced around the horizontal axis. The residual value can be calculated as (Actual value - Predicted value) with the mean and sum of the residuals are equal to zero. A residual plot is used to present the vertical axis’s residual values and the independent variable on the horizontal axis. Figure 10 shows the residual plot. A linear or a nonlinear model can be decided from plot patterns in a residual plot, and an appropriate one can be determined.
FIGURE 10.
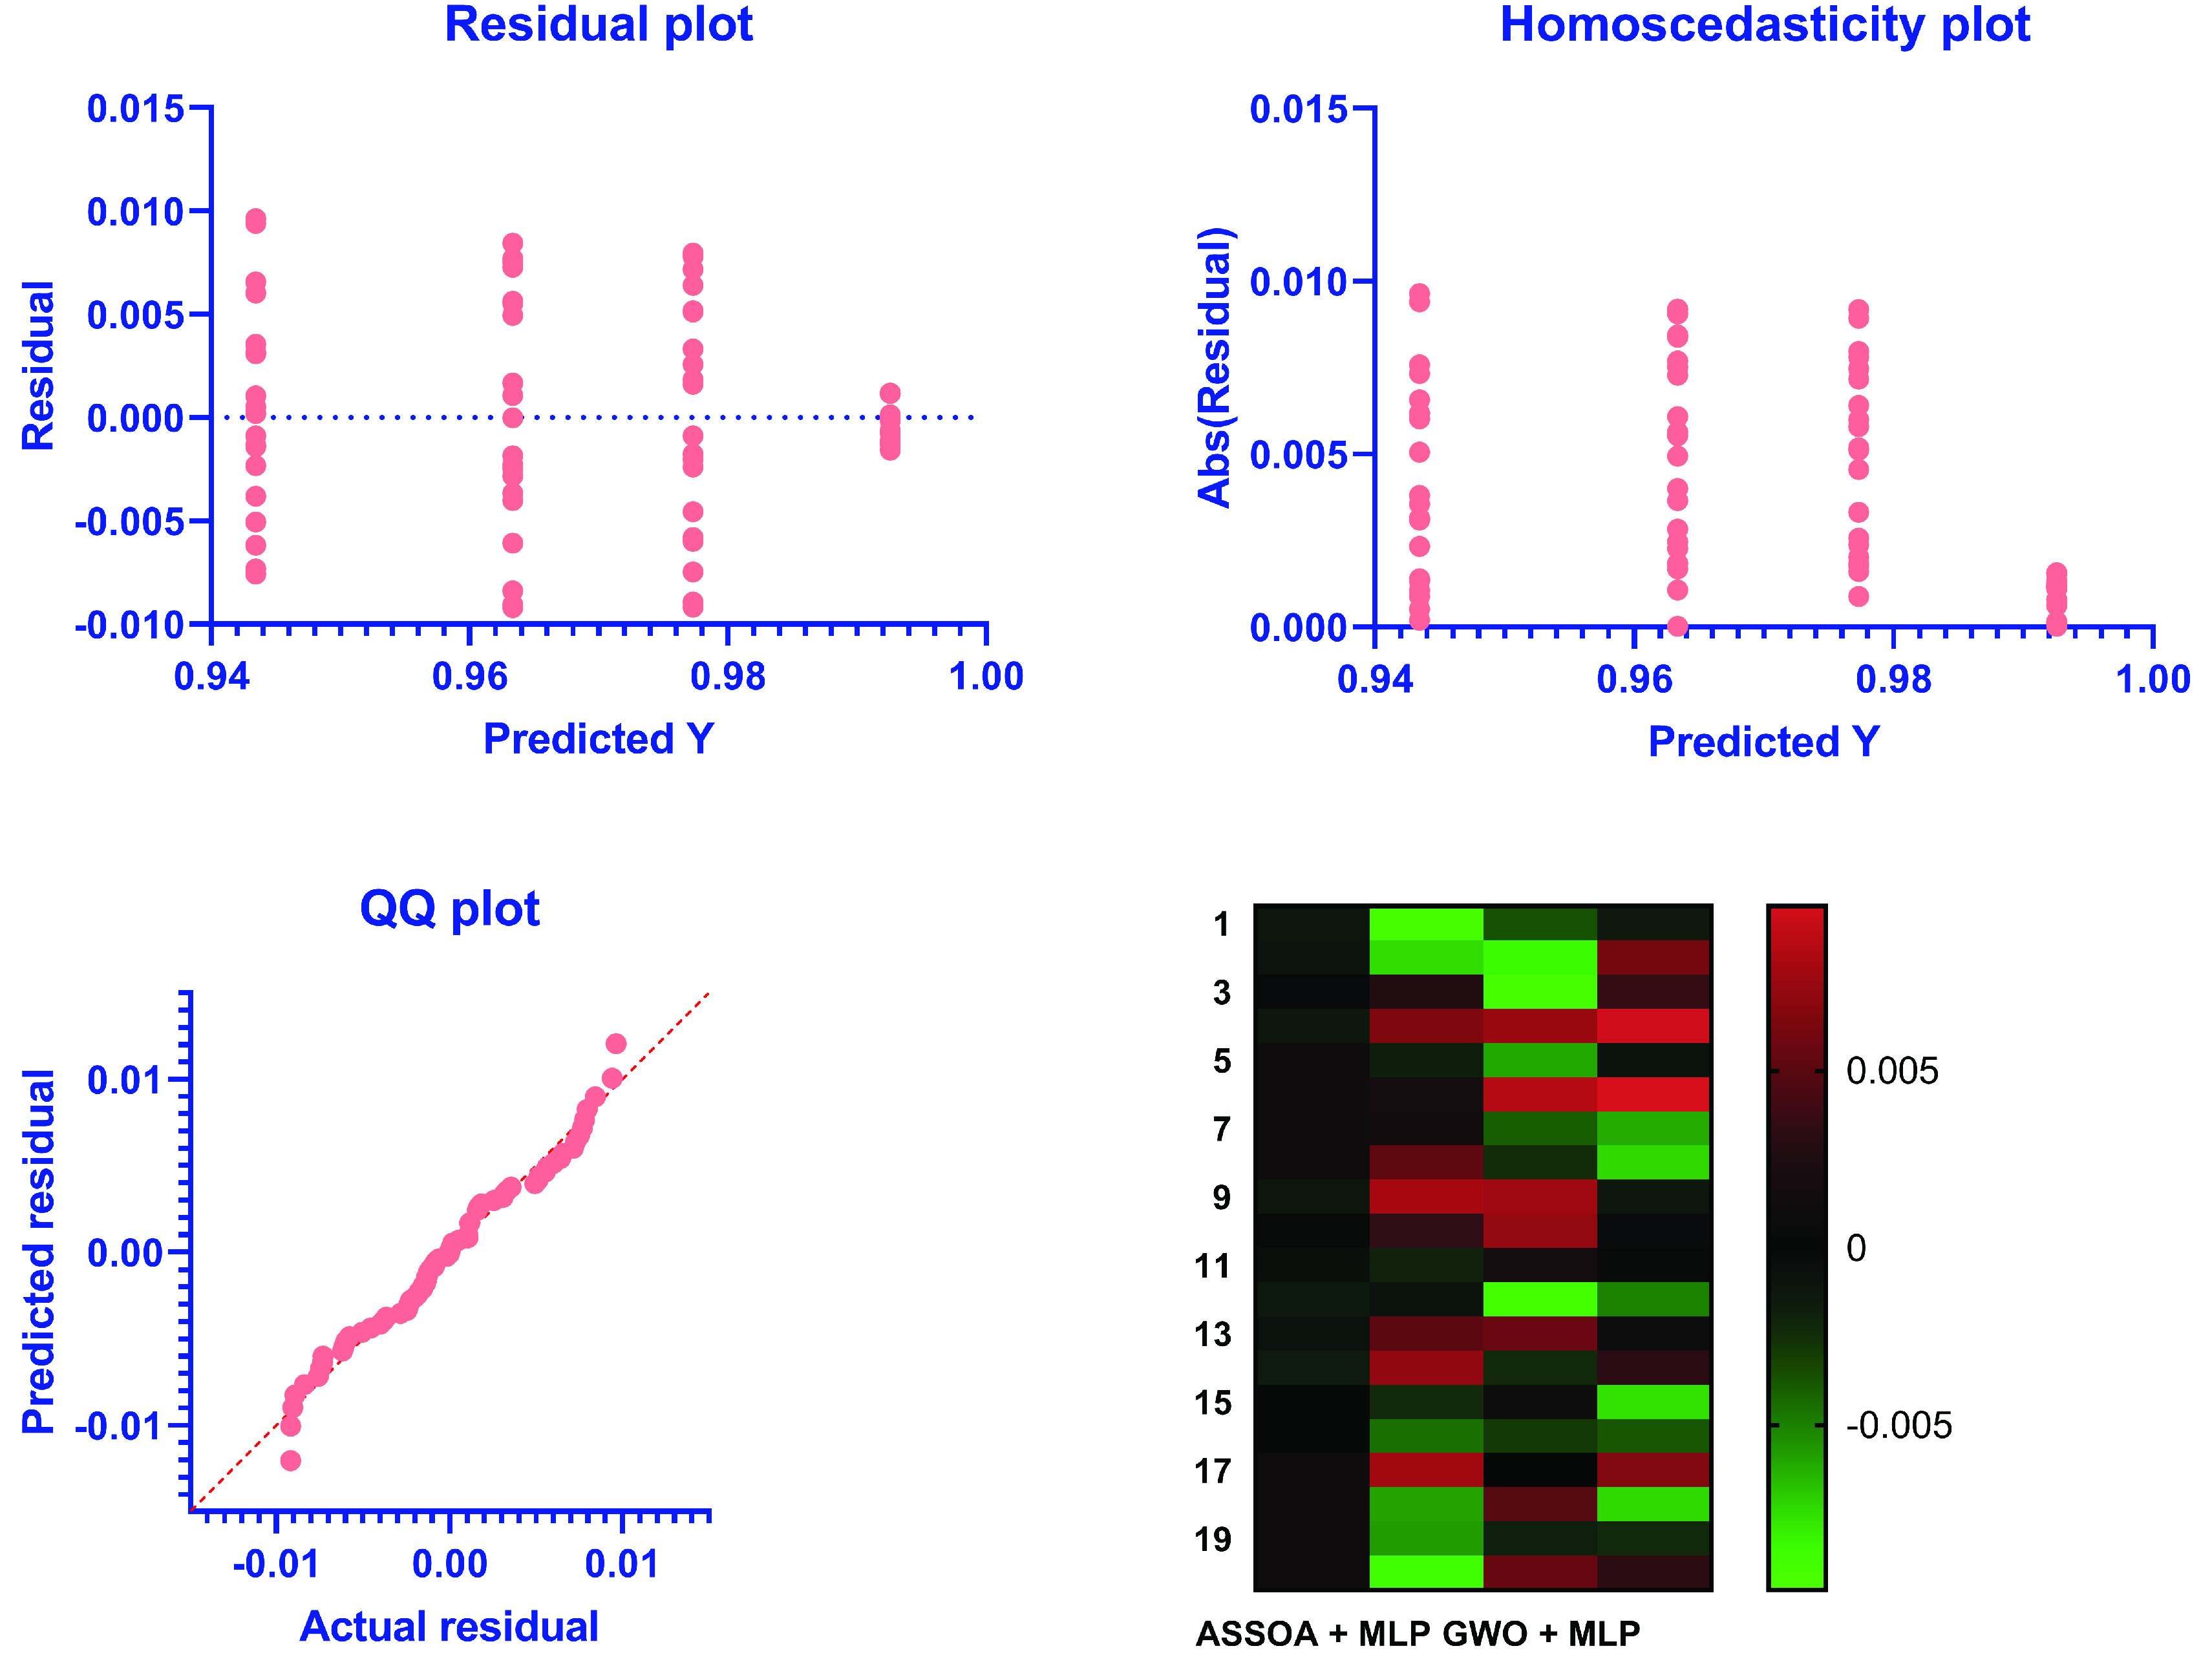
Residuals Versus Fits Plot of the proposed ASSOA + MLP algorithm compared to other algorithms for chest X-ray dataset.
The homogeneity of variance (heteroscedasticity) provides a visual examination between the prediction errors and the predicted dependent variable scores. The heteroscedasticity plot, shown in Figure 12, can quickly determine any violation and easily improve the research findings’ accuracy. Homoscedasticity describes a situation in which the error term (random disturbance in the relationship between the dependent variable and the independent variables, or noise) is the same across the independent variables’ values.
The quantile-quantile (QQ) plot is also shown in Figure 12. It is known as a probability plot. It is mainly used by plotting their quantiles against each other to compare two probability distributions. It is noted from the figure that the points distributions in the QQ plot are approximately fit on the line. Thus, the actual and the predicted residuals are linearly related, confirming the proposed ASSOA + MLP classifier’s performance to identify the chest X-ray images.
2). Chest X-Ray COVID-19 Classification Results
A chest X-ray COVID-19 dataset [31] is tested in the experiments to test the performance of the proposed ASSOA + MLP algorithm for the classification of chest X-ray COVID-19 cases. The output descriptive statistics of this experiment are shown in Table 13. The proposed (ASSOA + MLP) algorithm achieved a mean accuracy of (99.7%) for the COVID-19 dataset. The mean accuracy of compared algorithms of SS + MLP, GWO + MLP, and GA + MLP are (99.1%), (97.1%), and (95.9%), respectively. These results show that the proposed algorithm can improve the classification accuracy of COVID-19 patients from their chest X-ray images. The Box plot accuracy is tested, and the output figure is shown in Fig. 11. This figure shows the stability and consistency of the proposed algorithm for the classification of COVID-19 cases.
TABLE 14. ANOVA Test Results of the Proposed Algorithm for Chest X-Ray COVID-19 Dataset.
| ANOVA table | SS | DF | MS | F (DFn, DFd) | P value |
|---|---|---|---|---|---|
| Treatment (between columns) | 0.01861 | 3 | 0.006204 | F (3, 76) = 293.4 | P ¡ 0.0001 |
| Residual (within columns) | 0.001607 | 76 | 2.12E-05 | – | – |
| Total | 0.02022 | 79 | – | – | – |
TABLE 13. Descriptive Statistics and the Classification Accuracy of the ASSOA Algorithm Based on MLP in Comparison to Other Algorithms for Chest X-Ray COVID-19 Images.
| ASSOA + MLP | SS + MLP | GWO + MLP | GA + MLP | |
|---|---|---|---|---|
| Number of values | 20 | 20 | 20 | 20 |
| Minimum (Accuracy) | 0.994 | 0.986 | 0.961 | 0.929 |
| 25% Percentile | 0.997 | 0.991 | 0.971 | 0.959 |
| Median (Accuracy) | 0.997 | 0.991 | 0.9712 | 0.9596 |
| 75% Percentile | 0.9974 | 0.991 | 0.9715 | 0.9598 |
| Maximum (Accuracy) | 0.998 | 0.995 | 0.987 | 0.969 |
| Range | 0.004 | 0.009 | 0.026 | 0.04 |
| Mean (Accuracy) | 0.997 | 0.991 | 0.971 | 0.959 |
| Std. Deviation | 0.0007615 | 0.001478 | 0.00491 | 0.007597 |
| Std. Error of Mean | 0.0001703 | 0.0003305 | 0.001098 | 0.001699 |
| Lower 95% CI of mean | 0.9967 | 0.9903 | 0.9687 | 0.9555 |
| Upper 95% CI of mean | 0.9974 | 0.9917 | 0.9733 | 0.9626 |
| Coefficient of variation | 0.07638% | 0.1492% | 0.5057% | 0.7922% |
| Geometric mean | 0.997 | 0.991 | 0.971 | 0.959 |
| Geometric SD factor | 1.001 | 1.001 | 1.005 | 1.008 |
| Lower 95% CI of geo. mean | 0.9967 | 0.9903 | 0.9687 | 0.9554 |
| Upper 95% CI of geo. mean | 0.9974 | 0.9917 | 0.9733 | 0.9626 |
| Harmonic mean | 0.997 | 0.991 | 0.971 | 0.959 |
| Lower 95% CI of harm. mean | 0.9967 | 0.9903 | 0.9687 | 0.9553 |
| Upper 95% CI of harm. mean | 0.9974 | 0.9917 | 0.9733 | 0.9626 |
| Lower 95% CI of quad. mean | 0.9967 | 0.9903 | 0.9687 | 0.9555 |
| Upper 95% CI of quad. mean | 0.9974 | 0.9917 | 0.9733 | 0.9625 |
| Skewness | −3.421 | −1.099 | 1.029 | −3.388 |
| Kurtosis | 14.35 | 9.79 | 7.08 | 14.38 |
| Sum | 19.94 | 19.82 | 19.42 | 19.18 |
FIGURE 11.

Box plot accuracy of the proposed ASSOA + MLP algorithm compared to other algorithms for chest X-ray COVID-19 dataset.
ANOVA test is also performed for this experiment to test the ASSOA + MLP algorithm’s p-values compared to SS + MLP, GWO + MLP, GA + MLP classification algorithms. The output p-values are shown in Table 11 for the ANOVA test. Note that the p-values are less than 0.05, which indicates the superiority of the ASSOA + MLP algorithm and that the algorithm is statistically significant.
VI. Discussion
The experiments are divided into three different scenarios to assess the proposed method performance to classify chest X-ray images. According to the promising performance, the first scenario shows that the features can be extracted from the earlier layers of the ResNet-50 model. The extracted features are fed to the next scenario for feature selection. The second scenario shows the robustness and reliability of the ASSOA algorithm in finding the optimal subset of features in a reasonable amount of time. In this scenario, Wilcoxon’s rank-sum test emphasizes the superiority of the proposed ASSOA algorithm and shows that the algorithm is statistically significant. In the third scenario, the experiments show that the proposed algorithm (ASSOA + MLP) can achieve a mean accuracy of (99.26%) and an AUC value equal to (0.9875) within (135) seconds to classify a new input X-ray chest image which outperforms other algorithms. The ASSOA + MLP algorithm also achieved a classification mean accuracy of (99.7%) for a chest X-ray COVID-19 dataset. Wilcoxon’s rank-sum and ANOVA tests confirm the proposed algorithm’s superiority and that the algorithm is statistically significant. The results and statistical tests demonstrate the high effectiveness of the proposed method in determining the infected cases.
VII. Conclusion
Developing a classification model for diagnosing infected cases is considered one of the most critical problems, which is still much too pricey for the mass selection. This paper proposes a classification model to detect the afflicted instances from the chest X-ray images, which may dramatically minimize the diagnosis prices, particularly in cultivating nations. The training and feature extraction processes are based on a convolutional neural network (CNN) based model (ResNet50) with fine-tuning and image augmentation. The X-ray images’ classification to viral, normal, and bacterial, and popular scenarios are based upon an MLP neural network along with the proposed ASSOA algorithm. In this work, the chest X-ray images (Pneumonia) dataset composed of 5,863 X-ray images are utilized in the experiments. In the proposed model, a transfer learning technique is applied during the training stage and feature extraction. Experimental results show the proposed classification model’s efficiency in classifying the afflicted situations and a mean accuracy of (99.26%), which surpasses the cutting-edge strategies discovered in the literature. The proposed (ASSOA + MLP) algorithm also achieved a classification mean accuracy of (99.7%) for another chest X-ray COVID-19 dataset.
Acknowledgment
The authors would like to thank Dr. Mohamed Elsayed Gawish and Dr. Shaaban Omar for their support in interpreting the X-ray datasets. and separate X-ray images of the affected patients from other non-infected
Biographies

El-Sayed M. El-Kenawy (Member, IEEE) is currently an Assistant Professor with the Delta Higher Institute for Engineering and Technology (DHIET), Mansoura, Egypt. Inspiring and motivating students by providing a thorough understanding of a variety of computer concepts. He has published over 25 publications with over 550 citations and an H-index of 17. He has pioneered and launched independent research programs. Adept at sometimes explaining complex concepts in an easy-to-understand manner. His research interests include optimization, artificial intelligence, machine learning, deep learning, data science, and digital marketing. He serves as a Reviewer for the journal IEEE Access.

Seyedali Mirjalili (Senior Member, IEEE) is currently the Director of the Centre for Artificial Intelligence Research and Optimization, Torrens University Australia, Brisbane, QLD, USA. He is internationally recognized for his advances in swarm intelligence and optimization, including the first set of algorithms from a synthetic intelligence standpoint—a radical departure from how natural systems are typically understood—and a systematic design framework to reliably benchmark, evaluate, and propose computationally cheap robust optimization algorithms. He has published over 200 publications with over 27 000 citations and an H-index of 58. As the most cited researcher in robust optimization, he is in the list of 1% highly cited researchers and named as one of the most influential researchers in the world by the Web of Science. He is working on the applications of multi-objective and robust meta-heuristic optimization techniques as well. His research interests include robust optimization, engineering optimization, multi-objective optimization, swarm intelligence, evolutionary algorithms, and artificial neural networks. He is an Associate Editor of several journals, including Neurocomputing, Applied Soft Computing, Advances in Engineering Software, Applied Intelligence, PLOS One, and IEEE Access.

Abdelhameed Ibrahim (Member, IEEE) received the bachelor’s and master’s degrees in engineering from the Computer Engineering and Systems Department, in 2001 and 2005, respectively, and the Ph.D. degree in engineering from the Faculty of Engineering, Chiba University, Japan, in 2011. From 2001 to 2007, he was with the Faculty of Engineering, Mansoura University, Egypt, where he is currently an Associate Professor of computer engineering. He has published over 50 publications with over 750 citations and an H-index of 17. His research interests include pattern recognition, optimization, machine learning, virtualization, and live virtual machine migration. He serves as a Reviewer for the Journal of Electronic Imaging, Optical Engineering, the IEEE Journal of Biomedical and Health Informatics, IEEE Access, Computer Standards and Interfaces, Journal of Healthcare Engineering, IET Image Processing, Multimedia Tools and Applications, and other respected journals.

Mohammed Alrahmawy received the B.E. degree in electronics engineering from the University of Mansoura, Egypt, in 1997, the M.Sc. degree in automatic control engineering from Mansoura University, in 2001, and the Ph.D. degree in computer science from the University of York, U.K., in 2011. He was awarded a fully-funded scholarship by the Egyptian government to join the Realtime Systems Research Group, University of York, as a Ph.D. Research Student, in 2005. He joined the Department of Computer Science, Mansoura University, as a Lecturer, in 2011, where he became an Associate Professor, in 2017. His current research interests include realtime systems and languages, cloud computing, distributed and parallel computing, soft computing, image processing, computer vision, the IoT, and big data. He was the receptionist of the best M.Sc. thesis award from Mansoura University in 2003.

M. El-Said received the B.Sc. (Hons.), M.Sc., and Ph.D. degrees in electric power engineering from Mansoura University, Egypt, in 1981, 1987, and 1992, respectively. Since 2005, he has been a Professor of electric power systems with the Department of Electrical Engineering, Faculty of Engineering, Mansoura University. He had held several administrative positions. From 2010 to 2011, he was the Vice-Dean for Community Services and Environmental Development, Faculty of Engineering, Mansoura University. From 2014 to 2016, he was also Director of the Communication and Information Technology Centre (CITC), Mansoura University. From 2016 to 2018, he was the Dean of the Faculty of Engineering, Mansoura University. He is currently the Dean of the Delta Higher Institute of Engineering and Technology, Ministry of Higher Education, Egypt. His main research interests include power system operation and control, smart grids, and renewable energy. He is a Regular Reviewer of many scientific journals, such as the IEEE Transactions on Power Systems and Power Delivery, Electric Power Components and Systems. He is also an Official Reviewer for Egyptian Universities Promotion Committees -Supreme Council of Universities in Egypt.

Rokaia M. Zaki received the master’s degree from Benha University, Egypt, in 2007. She is currently an Assistant Professor with the Shoubra Faculty of Engineering, Benha University. Her research interests include mobile communications, wireless networks, and cognitive radio.

Marwa Metwally Eid received the Ph.D. degree in electronics and communications engineering from the Faculty of Engineering, Mansoura University, Egypt, in 2015. Since 2011, she has been working as an Assistant Professor with the Delta Higher Institute for Engineering and Technology. Her current research interests include image processing, encryption, wireless communication systems, and field programmable gate array (FPGA) applications.
Contributor Information
El-Sayed M. El-Kenawy, Email: skenawy@ieee.org.
Abdelhameed Ibrahim, Email: afai79@mans.edu.eg.
References
- [1].Ibrahim A. and El-Kenawy E.-S. M., “Image segmentation methods based on superpixel techniques: A survey,” J. Comput. Sci. Inf. Syst., vol. 15, no. 3, pp. 1–11, 2020. [Online]. Available: http://www.jcsis.org/papers/15-46 [Google Scholar]
- [2].Li C., Zhang D., Du S., and Tian Z., “Deformation and refined features based lesion detection on chest X-ray,” IEEE Access, vol. 8, pp. 14675–14689, 2020, doi: 10.1109/access.2020.2963926. [DOI] [Google Scholar]
- [3].Ibrahim A., Mohammed S., Ali H. A., and Hussein S. E., “Breast cancer segmentation from thermal images based on chaotic salp swarm algorithm,” IEEE Access, vol. 8, pp. 122121–122134, 2020, doi: 10.1109/access.2020.3007336. [DOI] [Google Scholar]
- [4].Ibrahim A., Mohammed S., and Ali H. A., “Breast cancer detection and classification using thermography: A review,” in Proc. Int. Conf. Adv. Mach. Learn. Technol. Appl. (AMLTA), Hassanien A. E., Tolba M. F., Elhoseny M., and Mostafa M., Eds. Cham, Switzerland: Springer, 2018, pp. 496–505. [Google Scholar]
- [5].Xu S., Wu H., and Bie R., “CXNet-m1: Anomaly detection on chest X-rays with image-based deep learning,” IEEE Access, vol. 7, pp. 4466–4477, 2019, doi: 10.1109/access.2018.2885997. [DOI] [Google Scholar]
- [6].El-Kenawy E.-S. M. and Eid M., “Hybrid gray wolf and particle swarm optimization for feature selection,” Int. J. Innov. Comput. Inf. Control, vol. 16, no. 3, pp. 831–844, 2020. [Google Scholar]
- [7].Ibrahim A., Gaber T., Horiuchi T., Snasel V., and Hassanien A. E., “Human thermal face extraction based on superpixel technique,” in Proc. 1st Int. Conf. Adv. Intell. Syst. Inform. (AISI), Suef E. B., Gaber T., Hassanien A. E., El-Bendary N., and Dey N., Eds. Cham, Switzerland: Springer, 2016, pp. 163–172. [Google Scholar]
- [8].Gaber T., Tharwat A., Ibrahim A., Snael V., and Hassanien A. E., “Human thermal face recognition based on random linear oracle (RLO) ensembles,” in Proc. Int. Conf. Intell. Netw. Collaborative Syst., Sep. 2015, pp. 91–98, doi: 10.1109/incos.2015.67. [DOI] [Google Scholar]
- [9].Shi G., Huang H., and Wang L., “Unsupervised dimensionality reduction for hyperspectral imagery via local geometric structure feature learning,” IEEE Geosci. Remote Sens. Lett., vol. 17, no. 8, pp. 1425–1429, Aug. 2020, doi: 10.1109/lgrs.2019.2944970. [DOI] [Google Scholar]
- [10].Luo F., Du B., Zhang L., Zhang L., and Tao D., “Feature learning using spatial-spectral hypergraph discriminant analysis for hyperspectral image,” IEEE Trans. Cybern., vol. 49, no. 7, pp. 2406–2419, Jul. 2019, doi: 10.1109/tcyb.2018.2810806. [DOI] [PubMed] [Google Scholar]
- [11].Hang R. and Liu Q., “Dimensionality reduction of hyperspectral image using spatial regularized local graph discriminant embedding,” IEEE J. Sel. Topics Appl. Earth Observ. Remote Sens., vol. 11, no. 9, pp. 3262–3271, Sep. 2018, doi: 10.1109/jstars.2018.2847042. [DOI] [Google Scholar]
- [12].Dong Y., Du B., Zhang L., and Zhang L., “Dimensionality reduction and classification of hyperspectral images using ensemble discriminative local metric learning,” IEEE Trans. Geosci. Remote Sens., vol. 55, no. 5, pp. 2509–2524, May 2017, doi: 10.1109/tgrs.2016.2645703. [DOI] [Google Scholar]
- [13].Abbas A., Abdelsamea M. M., and Gaber M. M., “DeTrac: Transfer learning of class decomposed medical images in convolutional neural networks,” IEEE Access, vol. 8, pp. 74901–74913, 2020, doi: 10.1109/access.2020.2989273. [DOI] [Google Scholar]
- [14].Choy G., Khalilzadeh O., Michalski M., Do S., Samir A. E., Pianykh O. S., Geis J. R., Pandharipande P. V., Brink J. A., and Dreyer K. J., “Current applications and future impact of machine learning in radiology,” Radiology, vol. 288, no. 2, pp. 318–328, Aug. 2018, doi: 10.1148/radiol.2018171820. [DOI] [PMC free article] [PubMed] [Google Scholar]
- [15].Dunnmon J. A., Yi D., Langlotz C. P., Ré C., Rubin D. L., and Lungren M. P., “Assessment of convolutional neural networks for automated classification of chest radiographs,” Radiology, vol. 290, no. 2, pp. 537–544, Feb. 2019, doi: 10.1148/radiol.2018181422. [DOI] [PMC free article] [PubMed] [Google Scholar]
- [16].El-Kenawy E.-S. M., Ibrahim A., Mirjalili S., Eid M. M., and Hussein S. E., “Novel feature selection and voting classifier algorithms for COVID-19 classification in CT images,” IEEE Access, vol. 8, pp. 179317–179335, 2020, doi: 10.1109/access.2020.3028012. [DOI] [PMC free article] [PubMed] [Google Scholar]
- [17].El-Kenawy E.-S. M., Eid M. M., and Ibrahim A., “An advanced patient health monitoring system,” J. Comput. Sci. Inf. Syst., vol. 17, no. 11, pp. 1–7, 2021. [Online]. Available: http://www.jcsis.org/papers/17-49 [Google Scholar]
- [18].El-Kenawy E.-S. M., Eid M. M., and Ibrahim A., “Anemia estimation for COVID-19 patients using a machine learning model,” J. Comput. Sci. Inf. Syst., vol. 17, no. 11, pp. 1–7, 2021. [Online]. Available: http://www.jcsis.org/papers/17-51 [Google Scholar]
- [19].Chumbita M., Cillóniz C., Puerta-Alcalde P., Moreno-García E., Sanjuan G., Garcia-Pouton N., Soriano A., Torres A., and Garcia-Vidal C., “Can artificial intelligence improve the management of pneumonia,” J. Clin. Med., vol. 9, no. 1, p. 248, Jan. 2020, doi: 10.3390/jcm9010248. [DOI] [PMC free article] [PubMed] [Google Scholar]
- [20].Chouhan V., Singh S. K., Khamparia A., Gupta D., Tiwari P., Moreira C., Damaševičius R., and de Albuquerque V. H. C., “A novel transfer learning based approach for pneumonia detection in chest X-ray images,” Appl. Sci., vol. 10, no. 2, p. 559, Jan. 2020, doi: 10.3390/app10020559. [DOI] [Google Scholar]
- [21].Bacanin N., Bezdan T., Tuba E., Strumberger I., and Tuba M., “Optimizing convolutional neural network hyperparameters by enhanced swarm intelligence metaheuristics,” Algorithms, vol. 13, no. 3, p. 67, Mar. 2020, doi: 10.3390/a13030067. [DOI] [Google Scholar]
- [22].Banharnsakun A., “Towards improving the convolutional neural networks for deep learning using the distributed artificial bee colony method,” Int. J. Mach. Learn. Cybern., vol. 10, no. 6, pp. 1301–1311, Jun. 2019. [Google Scholar]
- [23].Eid M. M. and Elawady Y. H., “Efficient pneumonia detection for chest radiography using ResNet-based SVM,” Eur. J. Electr. Eng. Comput. Sci., vol. 5, no. 1, pp. 1–8, Jan. 2021, doi: 10.24018/ejece.2021.5.1.268. [DOI] [Google Scholar]
- [24].Fouad M. M., El-Desouky A. I., Al-Hajj R., and El-Kenawy E.-S. M., “Dynamic group-based cooperative optimization algorithm,” IEEE Access, vol. 8, pp. 148378–148403, 2020, doi: 10.1109/access.2020.3015892. [DOI] [Google Scholar]
- [25].Ibrahim A., Tharwat A., Gaber T., and Hassanien A. E., “Optimized superpixel and AdaBoost classifier for human thermal face recognition,” Signal, Image Video Process., vol. 12, no. 4, pp. 711–719, May 2018, doi: 10.1007/s11760-017-1212-6. [DOI] [Google Scholar]
- [26].Hassib E. M., El-Desouky A. I., El-Kenawy E.-S. M., and El-Ghamrawy S. M., “An imbalanced big data mining framework for improving optimization algorithms performance,” IEEE Access, vol. 7, pp. 170774–170795, 2019. [Google Scholar]
- [27].Ibrahim A., Noshy M., Ali H. A., and Badawy M., “PAPSO: A power-aware VM placement technique based on particle swarm optimization,” IEEE Access, vol. 8, pp. 81747–81764, 2020, doi: 10.1109/access.2020.2990828. [DOI] [Google Scholar]
- [28].Hassib E. M., El-Desouky A. I., Labib L. M., and El-Kenawy E.-S. M., “WOA + BRNN: An imbalanced big data classification framework using whale optimization and deep neural network,” Soft Comput., vol. 24, no. 8, pp. 5573–5592, Mar. 2019, doi: 10.1007/s00500-019-03901-y. [DOI] [Google Scholar]
- [29].El-Kenawy E.-S. M., Eid M. M., Saber M., and Ibrahim A., “MbGWO-SFS: Modified binary grey wolf optimizer based on stochastic fractal search for feature selection,” IEEE Access, vol. 8, no. 1, pp. 107635–107649, 2020, doi: 10.1109/access.2020.3001151. [DOI] [Google Scholar]
- [30].Kermany D.et al. , “Identifying medical diagnoses and treatable diseases by image-based deep learning,” Cell, vol. 172, no. 5, pp. 1122–1131, 2018, doi: 10.1016/j.cell.2018.02.010. [DOI] [PubMed] [Google Scholar]
- [31].Cohen J. P., Morrison P., Dao L., Roth K., Duong T. Q., and Ghassemi M., “COVID-19 image data collection: Prospective predictions are the future,” Oct. 2020, arXiv:2006.11988. [Online]. Available: https://arxiv.org/abs/2006.11988 and https://github.com/ieee8023/covid-chestxray-dataset
- [32].Jain M., Singh V., and Rani A., “A novel nature-inspired algorithm for optimization: Squirrel search algorithm,” Swarm Evol. Comput., vol. 44, pp. 148–175, Feb. 2019. [Online]. Available: http://www.sciencedirect.com/science/article/pii/S2210650217305229 [Google Scholar]
- [33].Kabir M. M., Shahjahan M., and Murase K., “A new local search based hybrid genetic algorithm for feature selection,” Neurocomputing, vol. 74, no. 17, pp. 2914–2928, Oct. 2011. [Online]. Available: http://www.sciencedirect.com/science/article/pii/S0925231211002748 [Google Scholar]
- [34].Stephen O., Sain M., Maduh U. J., and Jeong D.-U., “An efficient deep learning approach to pneumonia classification in healthcare,” J. Healthcare Eng., vol. 2019, pp. 1–7, Mar. 2019, doi: 10.1155/2019/4180949. [DOI] [PMC free article] [PubMed] [Google Scholar]
- [35].Grewal M., Deist T. M., Wiersma J., Bosman P. A. N., and Alderliesten T., “An end-to-end deep learning approach for landmark detection and matching in medical images,” 2020, arXiv:2001.07434. [Online]. Available: https://arxiv.org/abs/2001.07434
- [36].Sahoo S., Dash M., Behera S., and Sabut S., “Machine learning approach to detect cardiac arrhythmias in ecg signals: A survey,” IRBM, vol. 41, no. 4, pp. 185–194, 2020. [Online]. Available: http://www.sciencedirect.com/science/article/pii/S1959031819301654 [Google Scholar]
- [37].Grewal M., Srivastava M. M., Kumar P., and Varadarajan S., “RADnet: Radiologist level accuracy using deep learning for hemorrhage detection in CT scans,” in Proc. IEEE 15th Int. Symp. Biomed. Imag. (ISBI), Apr. 2018, pp. 281–284. [Google Scholar]
- [38].Raman R., Srinivasan S., Virmani S., Sivaprasad S., Rao C., and Rajalakshmi R., “Fundus photograph-based deep learning algorithms in detecting diabetic retinopathy,” Eye, vol. 33, no. 1, pp. 97–109, Jan. 2019. [DOI] [PMC free article] [PubMed] [Google Scholar]
- [39].Groeneveld G. H., van de Peppel R. J., de Waal M. W. M., Verheij T. J. M., and van Dissel J. T., “Clinical factors, C-reactive protein point of care test and chest X-ray in patients with pneumonia: A survey in primary care,” Eur. J. Gen. Pract., vol. 25, no. 4, pp. 229–235, Oct. 2019. [DOI] [PMC free article] [PubMed] [Google Scholar]
- [40].Sirazitdinov I., Kholiavchenko M., Mustafaev T., Yixuan Y., Kuleev R., and Ibragimov B., “Deep neural network ensemble for pneumonia localization from a large-scale chest X-ray database,” Comput. Electr. Eng., vol. 78, pp. 388–399, Sep. 2019. [Online]. Available: http://www.sciencedirect.com/science/article/pii/S0045790618332890 [Google Scholar]
- [41].Jaiswal A. K., Tiwari P., Kumar S., Gupta D., Khanna A., and Rodrigues J. J. P. C., “Identifying pneumonia in chest X-rays: A deep learning approach,” Measurement, vol. 145, pp. 511–518, Oct. 2019. [Online]. Available: http://www.sciencedirect.com/science/article/pii/S0263224119305202 [Google Scholar]
- [42].Huang Z., Li Q., Zhang T., Sang N., and Hong H., “Iterative weighted sparse representation for X-ray cardiovascular angiogram image denoising over learned dictionary,” IET Image Process., vol. 12, no. 2, pp. 254–261, Feb. 2018, doi: 10.1049/iet-ipr.2017.0518. [DOI] [Google Scholar]
- [43].Huang Z., Zhang Y., Li Q., Zhang T., and Sang N., “Spatially adaptive denoising for X-ray cardiovascular angiogram images,” Biomed. Signal Process. Control, vol. 40, pp. 131–139, Feb. 2018. [Online]. Available: http://www.sciencedirect.com/science/article/pii/S1746809417302288 [Google Scholar]
- [44].Sezgin C., Gunalp M., Genc S., Acar N., Ustuner E., Oguz A. B., Tanriverdi A. K., Demirkan A., and Polat O., “Diagnostic value of bedside lung ultrasonography in pneumonia,” Ultrasound Med. Biol., vol. 46, no. 5, pp. 1189–1196, May 2020. [DOI] [PubMed] [Google Scholar]
- [45].Yan C., Hui R., Lijuan Z., and Zhou Y., “Lung ultrasound vs. chest X-ray in children with suspected pneumonia confirmed by chest computed tomography: A retrospective cohort study,” Exp. Therapeutic Med., vol. 19, no. 2, pp. 1363–1369, Dec. 2019. [DOI] [PMC free article] [PubMed] [Google Scholar]
- [46].Varshni D., Thakral K., Agarwal L., Nijhawan R., and Mittal A., “Pneumonia detection using CNN based feature extraction,” in Proc. IEEE Int. Conf. Electr., Comput. Commun. Technol. (ICECCT), Feb. 2019, pp. 1–7. [Google Scholar]
- [47].Chhikara P., Singh P., Gupta P., and Bhatia T., “Deep convolutional neural network with transfer learning for detecting pneumonia on chest X-rays,” in Advances in Bioinformatics, Multimedia, and Electronics Circuits and Signals, Jain L. C., Virvou M., Piuri V., and Balas V. E., Eds. Singapore: Springer, 2020, pp. 155–168. [Google Scholar]
- [48].Zhang K.et al. , “Clinically applicable AI system for accurate diagnosis, quantitative measurements, and prognosis of COVID-19 pneumonia using computed tomography,” Cell, vol. 181, no. 6, pp. 1423.e11–1433.e11, Jun. 2020, doi: 10.1016/j.cell.2020.04.045. [DOI] [PMC free article] [PubMed] [Google Scholar]
- [49].Butt C., Gill J., Chun D., and Babu B. A., “Deep learning system to screen coronavirus disease 2019 pneumonia,” Appl. Intell., pp. 1–7, Apr. 2020, doi: 10.1007/s10489-020-01714-3. [DOI] [PMC free article] [PubMed]
- [50].Panwar H., Gupta P. K., Siddiqui M. K., Morales-Menendez R., and Singh V., “Application of deep learning for fast detection of COVID-19 in X-rays using nCOVnet,” Chaos, Solitons Fractals, vol. 138, Sep. 2020, Art. no. 109944. [Online]. Available: http://www.sciencedirect.com/science/article/pii/S096007792030343X [DOI] [PMC free article] [PubMed] [Google Scholar]
- [51].Nour M., Cömert Z., and Polat K., “A novel medical diagnosis model for COVID-19 infection detection based on deep features and Bayesian optimization,” Appl. Soft Comput., vol. 97, Dec. 2020, Art. no. 106580, doi: 10.1016/j.asoc.2020.106580. [DOI] [PMC free article] [PubMed] [Google Scholar]
- [52].Hu S., Gao Y., Niu Z., Jiang Y., Li L., Xiao X., Wang M., Fang E. F., Menpes-Smith W., Xia J., Ye H., and Yang G., “Weakly supervised deep learning for COVID-19 infection detection and classification from CT images,” IEEE Access, vol. 8, pp. 118869–118883, 2020, doi: 10.1109/access.2020.3005510. [DOI] [Google Scholar]
- [53].Elaziz M. A., Hosny K. M., Salah A., Darwish M. M., Lu S., and Sahlol A. T., “New machine learning method for image-based diagnosis of COVID-19,” PLoS ONE, vol. 15, no. 6, Jun. 2020, Art. no. e0235187, doi: 10.1371/journal.pone.0235187. [DOI] [PMC free article] [PubMed] [Google Scholar]
- [54].Ibrahim A. and El-Kenawy E.-S. M., “Applications and datasets for superpixel techniques: A survey,” J. Comput. Sci. Inf. Syst., vol. 15, no. 3, pp. 1–6, 2020. [Online]. Available: http://www.jcsis.org/papers/15-47 [Google Scholar]
- [55].Mathworks. Convolutional Neural Network. Accessed: Apr. 4, 2020. [Online]. Available: https://ch.mathworks.com/solutions/deep-learning/convolutional-neural-network.html
- [56].Han J., Zhang D., Cheng G., Liu N., and Xu D., “Advanced deep-learning techniques for salient and category-specific object detection: A survey,” IEEE Signal Process. Mag., vol. 35, no. 1, pp. 84–100, Jan. 2018. [Google Scholar]
- [57].Simonyan K. and Zisserman A., “Very deep convolutional networks for large-scale image recognition,” 2014, arXiv:1409.1556. [Online]. Available: https://arxiv.org/abs/1409.1556
- [58].Al-Dhamari A., Sudirman R., and Mahmood N. H., “Transfer deep learning along with binary support vector machine for abnormal behavior detection,” IEEE Access, vol. 8, pp. 61085–61095, 2020. [Google Scholar]
- [59].Shalu and Kamboj A., “A color-based approach for melanoma skin cancer detection,” in Proc. 1st Int. Conf. Secure Cyber Comput. Commun. (ICSCCC), 2018, pp. 508–513. [Google Scholar]
- [60].Yu S., Xie L., Liu L., and Xia D., “Learning long-term temporal features with deep neural networks for human action recognition,” IEEE Access, vol. 8, pp. 1840–1850, 2020. [Google Scholar]
- [61].Bezdan T., Tuba E., Strumberger I., Bacanin N., and Tuba M., “Automatically designing convolutional neural network architecture with artificial flora algorithm,” in ICT Systems and Sustainability, Tuba M., Akashe S., and Joshi A., Eds. Singapore: Springer, 2020, pp. 371–378. [Google Scholar]
- [62].Shih P.-C., Li H., Lin X., and Zhang Y., “Application of metaheuristic algorithms for determining the structure of a convolutional neural network with a small dataset,” in Proc. 3rd Int. Conf. Comput. Sci. Appl. Eng. (CSAE), 2019, pp. 1–7. [Google Scholar]
- [63].Wang Y., Zhang H., and Zhang G., “CPSO-CNN: An efficient PSO-based algorithm for fine-tuning hyper-parameters of convolutional neural networks,” Swarm Evol. Comput., vol. 49, pp. 114–123, Sep. 2019. [Online]. Available: http://www.sciencedirect.com/science/article/pii/S2210650218310083 [Google Scholar]
- [64].Jiang J., Han F., Ling Q., Wang J., Li T., and Han H., “Efficient network architecture search via multiobjective particle swarm optimization based on decomposition,” Neural Netw., vol. 123, pp. 305–316, Mar. 2020. [Online]. Available: http://www.sciencedirect.com/science/article/pii/S0893608019303971 [DOI] [PubMed] [Google Scholar]
- [65].Mukherjee S., Adhikari A., and Roy M., “Malignant melanoma detection using multi layer perceptron with optimized network parameter selection by PSO,” in Contemporary Advances in Innovative and Applicable Information Technology, Mandal J. K., Sinha D., and Bandopadhyay J., Eds. Singapore: Springer, 2019, pp. 101–109. [Google Scholar]
- [66].Shorten C. and Khoshgoftaar T. M., “A survey on image data augmentation for deep learning,” J. Big Data, vol. 6, no. 1, pp. 1–48, Dec. 2019. [DOI] [PMC free article] [PubMed] [Google Scholar]