

Summary:
Endoplasmic reticulum (ER) dysregulation is associated with pathologies including neurodegenerative, muscular, and diabetic conditions. Depletion of ER calcium can lead to the loss of resident proteins in a process termed exodosis. To identify compounds that attenuate the redistribution of ER proteins under pathological conditions, we performed a quantitative high-throughput screen using the GLuc-SERCaMP assay, which monitors secretion of ER resident proteins triggered by calcium depletion. Several clinically used drugs, including bromocriptine, were identified and further characterized using assays to measure effects on ER calcium, ER stress, and ER exodosis. Bromocriptine elicited protective effects in cell-based models of exodosis as well as in vivo models of stroke and diabetes. Bromocriptine analogs with reduced dopamine receptor activity retained similar efficacy in stabilizing the ER proteome, indicating a non-canonical mechanism of action. This study describes a strategic approach to identify small molecule drugs capable of improving ER proteostasis in human disease conditions.
Introduction:
The endoplasmic reticulum (ER) and sarcoplasmic reticulum (SR) is a site of essential cellular functions including protein maturation and trafficking, lipid synthesis and metabolism, drug catabolism and calcium storage. The high concentration of calcium within the ER lumen is needed for proper functioning of the ER (Burdakov et al., 2005; Fu et al., 2012) and dysregulation of ER calcium can trigger an ER stress response that leads to cell death if unresolved (Metcalf et al., 2020). The diverse processes of the ER are catalyzed by resident luminal proteins which contain a carboxy-terminal ER retention signal (ERS). If ER resident proteins move from the ER to Golgi, the ERS is recognized by a KDEL receptor (KDELR) which initiates retrograde transport to return the proteins to the ER lumen (Munro and Pelham, 1987; Semenza et al., 1990). We recently discovered that ER calcium depletion causes ER resident proteins (e.g. chaperones, isomerases, etc.) to escape the KDELR retrieval pathway and be secreted from the cell. The massive departure of ER resident proteins from the cell or ‘exodosis’ is a process that appears to contribute to a variety of disease states associated with ER calcium depletion (Trychta et al., 2018a).
ER stress and ER calcium dysregulation are observed in diverse pathologies, including pancreatic (diabetes, Wolfram syndrome), neuronal (Alzheimer’s, Huntington’s, and Parkinson’s disease and Wolfram Syndrome), cardiovascular (chronic heart failure, atherosclerosis, diabetic cardiomyopathy), muscular (Brody disease, central core disease) and viral (hepatitis C, human cytomegalovirus, rotavirus) diseases (Hetz et al., 2020; Mekahli et al., 2011). Monogenic diseases, such as Brody myopathy (SERCA1, OMIM #601003), Darier Disease (SERCA2, OMIM #124200), ryanodine receptor 1 related myopathies (OMIM #180901), and Wolfram syndrome (WFS1, OMIM #222300) have a defined connection between ER calcium depletion and pathogenesis (Lu et al., 2014). Other diseases exhibit a more complex etiology, where the relationships between ER calcium dysfunction and disease progression are not fully understood. Heart failure, for instance, is associated with decreased SERCA activity (Dash et al., 2001; Piacentino et al., 2003) and increased calcium efflux through the ryanodine receptor (RyR) (Marx et al., 2000); however, whether these molecular events drive myopathy or are a downstream effect is unclear. For both monogenic and complex diseases associated with ER calcium dysfunction, pursuing approaches that restore and maintain ER homeostasis provides opportunities to characterize pathogenesis and develop therapeutics.
We postulated that a target-agnostic phenotypic screen for small molecule modulators of ER exodosis would identify a set of compounds that could be used to improve outcome in disease models where ER calcium and ER proteostasis are disrupted. Towards this goal, we performed a quantitative high-throughput screen using the Secreted ER Calcium Modulated Protein (SERCaMP) technology. SERCaMP was initially developed as a reporter of ER calcium homeostasis using a Gaussia luciferase with a modified signal peptide and carboxy-terminus (GLuc-SERCaMP), modifications that confer secretion of the reporter in response to ER calcium depletion (Henderson et al., 2014). The assay was used to screen 9,501 compounds, including a collection of drugs approved by the FDA (US), EMA (EU), NHI (Japan), and HC (Canada) regulatory agencies (Huang et al., 2011). Since the SERCaMP reporter reflects the exodosis phenomenon (Trychta et al., 2018a), compounds identified in the screen have the potential to prevent exodosis by different mechanisms such as stabilizing ER calcium, reducing anterograde movement or augmenting ERS retrieval from the Golgi to the ER. Here, we describe the characterization of several approved drugs identified in this screen that help retain resident proteins of the ER. These studies provide the foundation for future efforts aimed at further characterizing the in vivo efficacy of drugs that stabilize the resident ER proteome. Additionally, we identified several approved drugs that could potentially be repurposed for indications associated with ER calcium depletion and exodosis.
Results:
High-throughput screening and orthogonal assays identify small molecule modulators of exodosis
The previously described SERCaMP assay can be used to monitor the release of ER-localized proteins (referred to as exodosis) in response to ER calcium depletion by measuring secretion of a reporter from as few as 20 cells (Henderson et al., 2014). We adapted this assay to perform a quantitative high-throughput screen (qHTS) for small molecule modulators of ER exodosis using SH-SY5Y human neuroblastoma cells stably expressing GLuc-SERCaMP. After pre-treating cells for 16 hours with candidate compounds, thapsigargin (Tg) was added to inhibit SERCA, deplete the ER calcium store, and trigger exodosis (Figure 1A). We anticipated that anti-exodosis compounds would reduce GLuc-SERCaMP secretion and could be identified by measuring luciferase activity in the medium. The GLuc-SERCaMP assay was miniaturized to 1536-well format and the luciferase substrate (coelenterazine, CTZ) was added directly to wells containing cells to measure extracellular GLuc. Under these conditions, the luminescent signal was almost entirely attributable to extracellular, not intracellular, luciferase (Figure S1A, B). GLuc-SERCaMP expressing cells showed a dose-dependent release of the reporter in response to thapsigargin, whereas the cells expressing an unmodified GLuc control reporter were unaffected by thapsigargin (Figure 1B). Dantrolene, a well characterized RyR antagonist that was previously shown to attenuate Tg-induced SERCaMP release (Henderson et al., 2014), was tested using compound sourced from five vendors (Figure 1C). Each of the dantrolene samples reduced SERCaMP release with IC50 values ranging from 12 to 69 micromolar, consistent with reported plasma levels at effective therapeutic doses used to treat malignant hyperthermia (Flewellen et al., 1983). A screen of 9,501 compounds (14,689 samples; Table S1), including a collection of approximately 2,500 drugs approved for use in humans, was performed at three-concentrations (1.5, 7.7, and 38.3 μM). Assay performance was deemed acceptable for screening, with a median Z’ factor 0.51 (mean = 0.36) for thapsigargin-induced SERCaMP release (Figure S1C). The 578 compounds that demonstrated inhibitory activity in the primary screen (Table S1) were sourced and re-tested at 11 concentrations (1.3 nM – 76.6 μM). Of the 578 compounds, 315 compounds (54%; Table S2), confirmed in the follow-up SERCaMP assay (Figure 1D).
Figure 1: High-throughput screening (HTS) approach to identify small molecules that stabilize ER resident proteins.
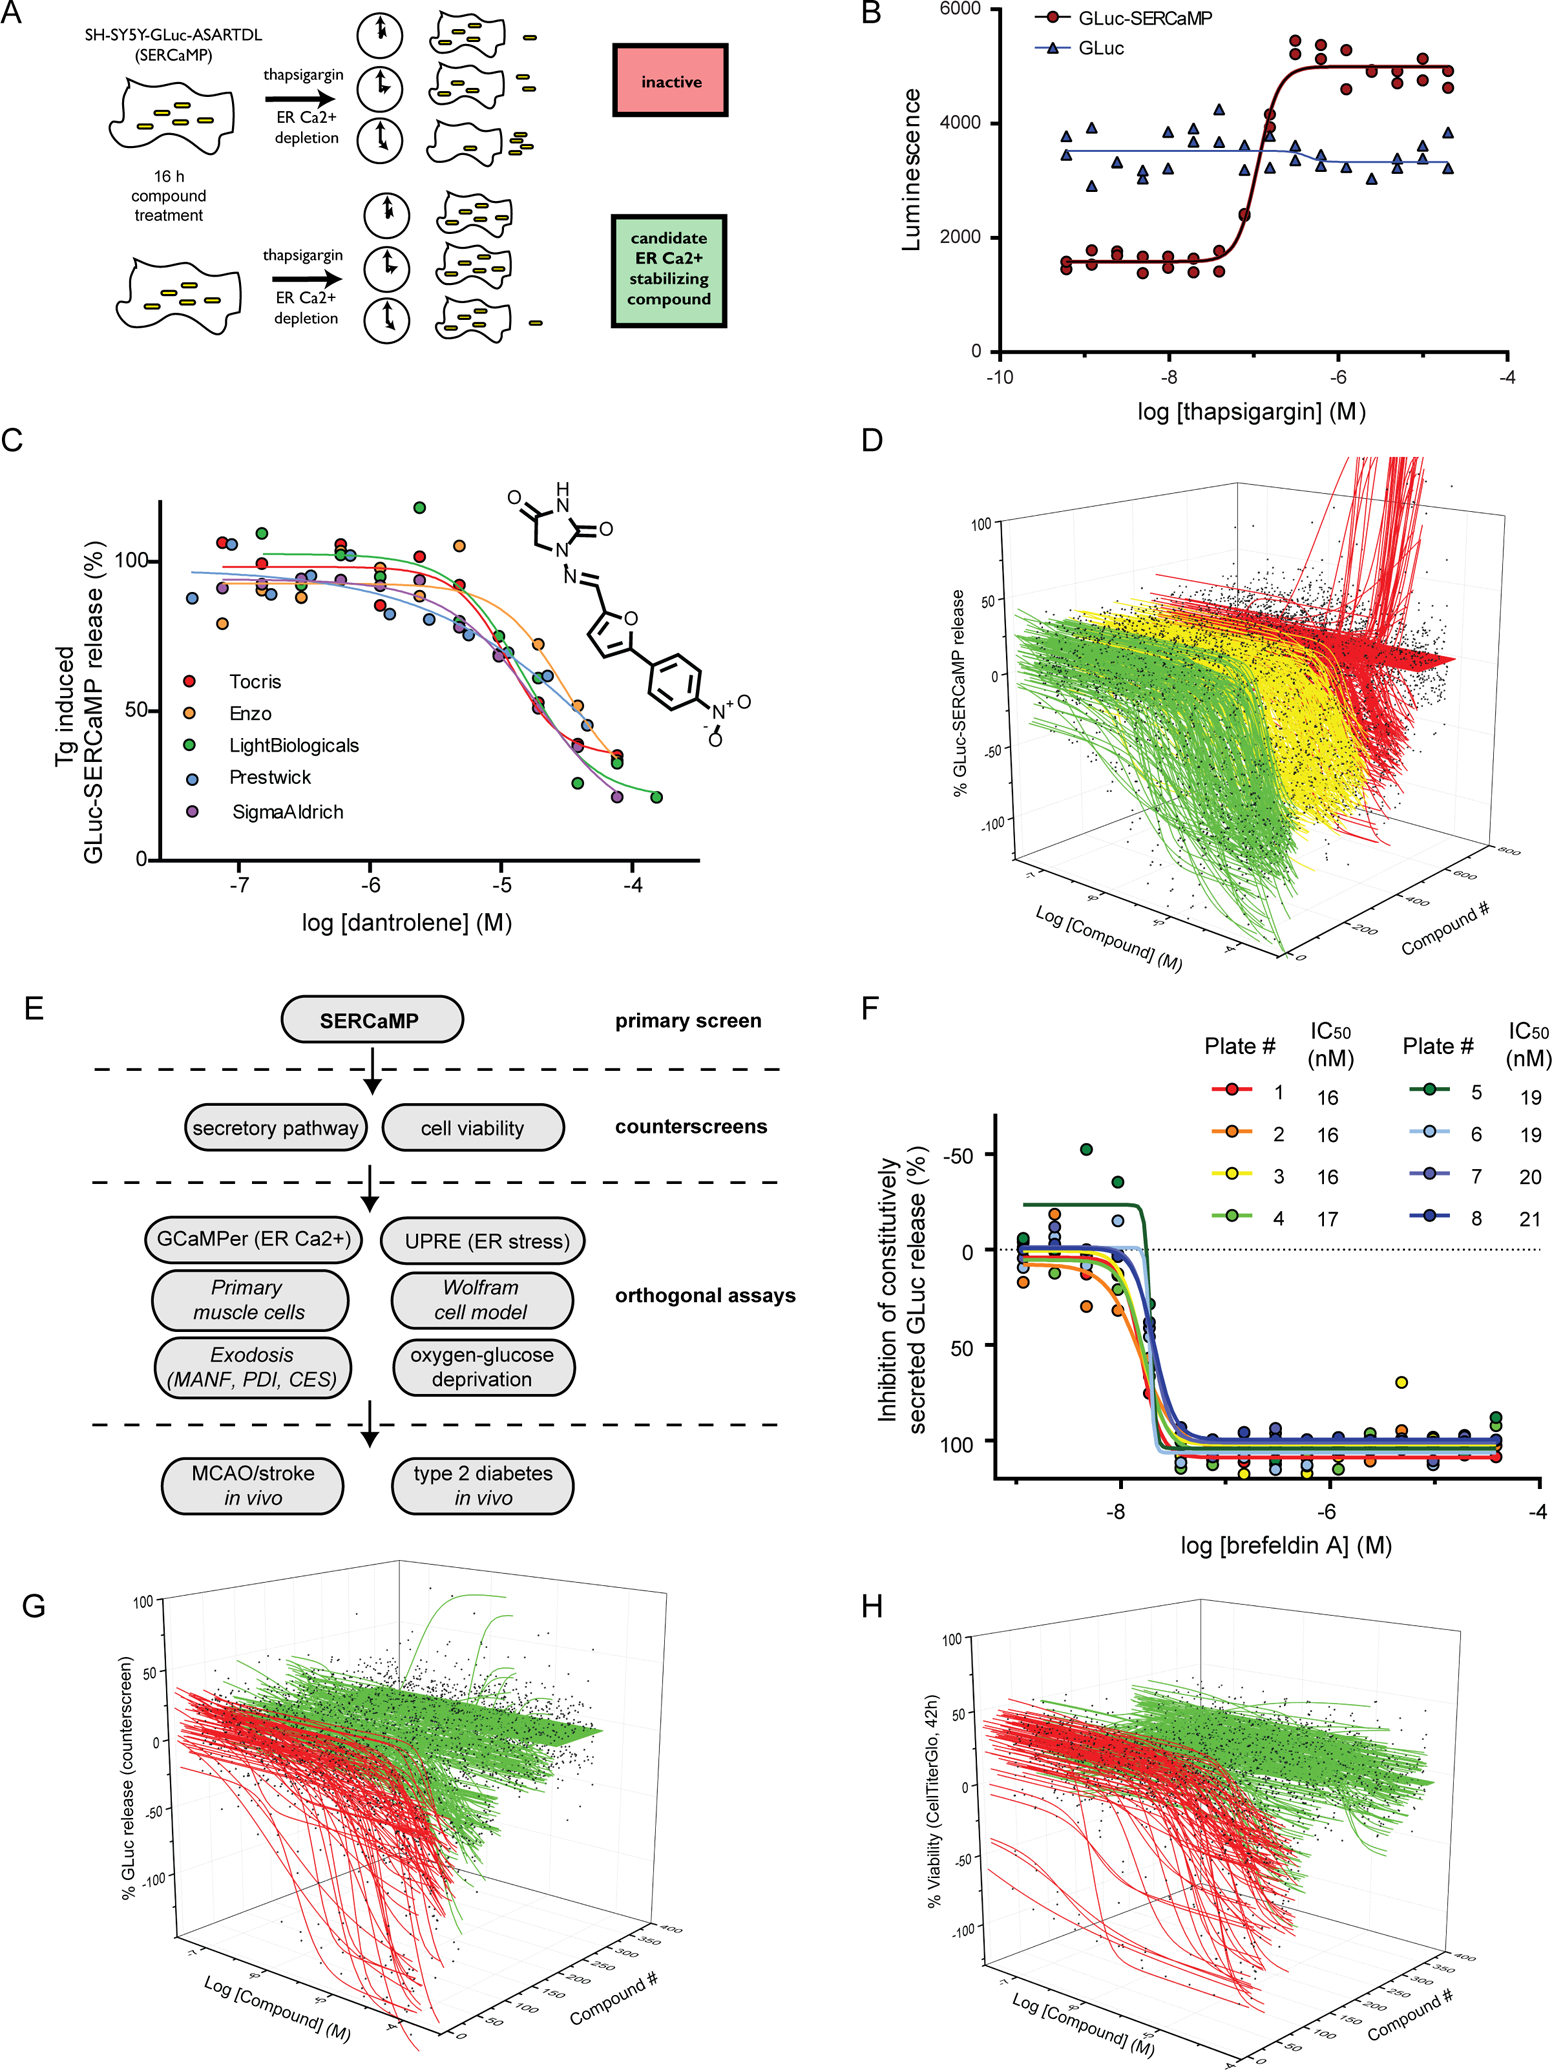
(A) Schematic of SERCaMP-based HTS approach. Cells were pre-treated with compound for 16 h before the addition of 100 nM thapsigargin. Compounds that stabilize ER calcium or augment KDELR retrieval should decrease SERCaMP release. (B) GLuc-SERCaMP is secreted in response to thapsigargin treatment. Reporter cells (or GLuc control cells) were seeded in 1536 well format and GLuc activity was measured after 4 h of thapsigargin treatment (n=2 per concentration). Thapsigargin EC50 = 112 nM in GLuc-SERCaMP cells. (C) The RyR antagonist dantrolene inhibits GLuc-SERCaMP release. Cells were pre-treated with dantrolene (from five vendors) for 16 h, and GLuc-SERCaMP was measured in the medium 4 hrs after 100 nM thapsigargin treatment. (D) 578 compounds identified in the 3-concentration primary screen (of 9,501 compounds) were re-tested at 11 concentrations. Waterfall plot depicts inhibition of GLuc-SERCaMP after 4 hrs treatment with thapsigargin. Compounds are grouped into the following classes of inhibitors: full (>80% inhibition, curve class −1.1, −2.1; green), partial (<80% inhibition, curve class −1.2, −2.2; yellow), or inactives and lower confidence curves (red). (E) Diagram of the screening approach, outlining the primary screen, counterscreens, and orthogonal assays used to identify compounds that stabilize ER resident proteins. (F) GLuc counterscreen (constitutively secreted reporter) to identify compounds that alter secretory pathway function. The ER-to-Golgi transport inhibitor Brefeldin A was added to cells for 19 h. Dose-response curves for Brefeldin A were generated for eight 1536 well plates from the counterscreen (mean, n=2 per concentration). (G) Waterfall plot summarizing activity of 578 hit compounds in the constitutively secreted GLuc counterscreen (SH-SY5Y-GLuc-NoTag, 19 h treatment). Active (inhibits secretion, red) and inactive (no effect on secretion, green) compounds are shown. (H) Waterfall plot summarizing cytotoxicity counterscreen. SH-SY5Y-GLuc-SERCaMP viability was assessed by CellTiter Glo after 43 h compound treatment. Cytotoxic compounds (red) and inactive compounds (green) are indicated. See also Figure S1.
A decrease in SERCaMP release, while suggestive of improved ER proteostasis, would also be expected for small molecules that inhibit the secretory pathway, transgene expression, or cell viability. Therefore, active compounds from the primary screen were counterscreened using: 1) SH-SY5Y cells stably expressing a constitutively secreted GLuc (SH-SY5Y-GLuc) to assess effects on secretory capacity and transgene expression and 2) a CellTiter Glo assay to examine viability (Figure 1E). For the SH-SY5Y-GLuc counterscreen, the ER-to-Golgi transport inhibitor Brefeldin A was used as a positive control (Figure 1F). Of the 315 confirmed SERCaMP actives, 68 compounds (22%; Table S2, Figure S1F) showed inhibitory activity in the SH-SY5Y-GLuc counterscreen (Figure 1G), including cycloheximide, a protein synthesis inhibitor (Figure S1D). For the cell viability counterscreen, the cytotoxic proteasome inhibitor bortezomib was used as a positive control (Figure S1E). The viability counterscreen identified 82 compounds (26%; Table S2, Figure S1F) as cytotoxic at 42 hours (Figure 1H). Following the counterscreens, 185 compounds from the initial 578 (32%, Table S2) met the following criteria: 1) confirmed in the primary SERCaMP assay, 2) did not exhibit activity in the GLuc counterscreen, and 3) did not show toxicity in the cell viability assay.
Of the 185 remaining actives, 71 compounds have a developmental status (according to NCATS portal for drug development information; drugs.ncats.io; Table S1c). We focused our efforts on five FDA-approved drugs for further assessment (dextromethorphan, bromocriptine, dantrolene, verapamil, and diltiazem), due to both known associations with calcium modulation or secretion and the potential to be repurposed for diseases where ER calcium dysregulation and exodosis have been detected (Figure 2A). To confirm the screening results, the compounds were tested in 96-well format for SERCaMP activity (Figure 2B), inhibition of the secretory pathway (Figure S2A), and effects on cell viability (Figure S2B). These experiments confirmed the results from the qHTS, supporting potential activity on stabilizing the ER proteome. We predicted that compounds acting directly on ER calcium regulators (e.g. RyR and IP3R) would retain activity when tested in an acute treatment paradigm. All five compounds inhibited SERCaMP release when added 30 min pre- to 2 hours post-thapsigargin but were inactive when added 4 hours post-thapsigargin (Figure 2C, Figure S2C–G), supporting a rapid effect on exodosis and not a preconditioning effect.
Figure 2: Five clinically-approved drugs were selected for additional characterization.

(A) Efficacy (percent inhibition of SERCaMP secretion) and potency determined in the 1536 well assay (11 concentrations). (B) Inhibition of GLuc-SERCaMP secretion was confirmed in in 96-well format assays. Cells were treated with compound for 16 h followed by 4 h of 100 nM Tg. Medium was collected and GLuc-SERCaMP activity measured (mean ± SEM; n = at least 3 independent experiments). (C) Acute treatment paradigm to examine rapid effects on GLuc-SERCaMP release. Cells were treated with 30 μM of the compounds at the indicated time relative to 200 nM thapsigargin treatment. GLuc-SERCaMP was measured in the medium 8 h after thapsigargin treatment (mean ± SEM; n=3 independent experiments). (D) A genetically-encoded ER calcium indicator (GCaMPer) was used to monitor ER calcium depletion caused by thapsigargin. Cells were treated for 30 min with 50 nM thapsigargin and fluorescence intensity was calculated on a per cell basis (mean ± SEM, n=75 cells per group). ***p<0.001 (two-tailed t-test). (E) Effect of compounds on ER calcium store was assessed using GCaMPer. Compounds were added 16 h prior to 50 nM thapsigargin treatment. GCaMPer fluorescence was measured 30 min after thapsigargin administration (mean ± SEM, n=75 cells per group) and normalized to the thapsigargin (100% loss of fluorescence) and vehicle (0%) controls. ***p<0.001 (Dunnett’s multiple comparison test versus Tg-only). See also Figure S2.
We hypothesized that some compounds prevent exodosis by directly stabilizing ER calcium and utilized the genetically encoded ER calcium indicator, GCaMPer (Henderson et al., 2015a), to examine ER calcium dynamics after drug treatment. GCaMPer has low affinity calcium-binding domains and shows reduced fluorescence as the ER calcium store is depleted. SERCA inhibition with Tg decreased GCaMPer fluorescence in SH-SY5Y cells (Figure 2D), and the effect of compounds (16 hour pre-treatment) on GCaMPer fluorescence was examined. Bromocriptine and verapamil showed a stabilizing effect on ER calcium, whereas dextromethorphan and diltiazem showed no effect (Figure 2E). Dantrolene was not assessed as it produces fluorescence that overlaps with the spectral properties of GCaMP-based reporters (Dehpour et al., 1982).
One of the major consequences of Tg treatment is the activation of the unfolded protein response (UPR). We predicted that some compounds identified in the screen would also alter the UPR. ATF6 and IRE1 signaling, which are activated by ER stress, were examined using a reporter containing UPR transcriptional elements (UPRE) driving NanoLuc expression (Wires et al., 2017). SH-SY5Y cells were transiently transfected with UPRE-NLuc and thapsigargin-induced expression of the reporter was confirmed (Figure 3A). Bromocriptine, verapamil, and dextromethorphan diminished UPRE-NLuc activation, whereas dantrolene and diltiazem were inactive in the assay (Figure 3B). The compounds showed no effects on NLuc activity when applied to cells transfected with a control construct containing a minimal promoter lacking the UPRE (Figure S3A). Next, we examined endogenous UPR genes by measuring BiP, ERdj4, and ASNS mRNA levels, to assess the ATF6, XBP1, and PERK arms of the UPR, respectively. Bromocriptine and verapamil treatment reduced expression of BiP, whereas the other compounds did not significantly alter transcript levels (Figure 3C). ERdj4 and ASNS were not significantly altered by any of the compounds. Furthermore, compound treatment alone did not have any effect on BiP, ERdj4, or ASNS mRNA expression (Figure S3B). BiP/GRP78 protein levels were also examined, and bromocriptine and verapamil reduced thapsigargin-induced accumulation (Figure 3D,E).
Figure 3: HTS compound effects on unfolded protein response (UPR) pathways.
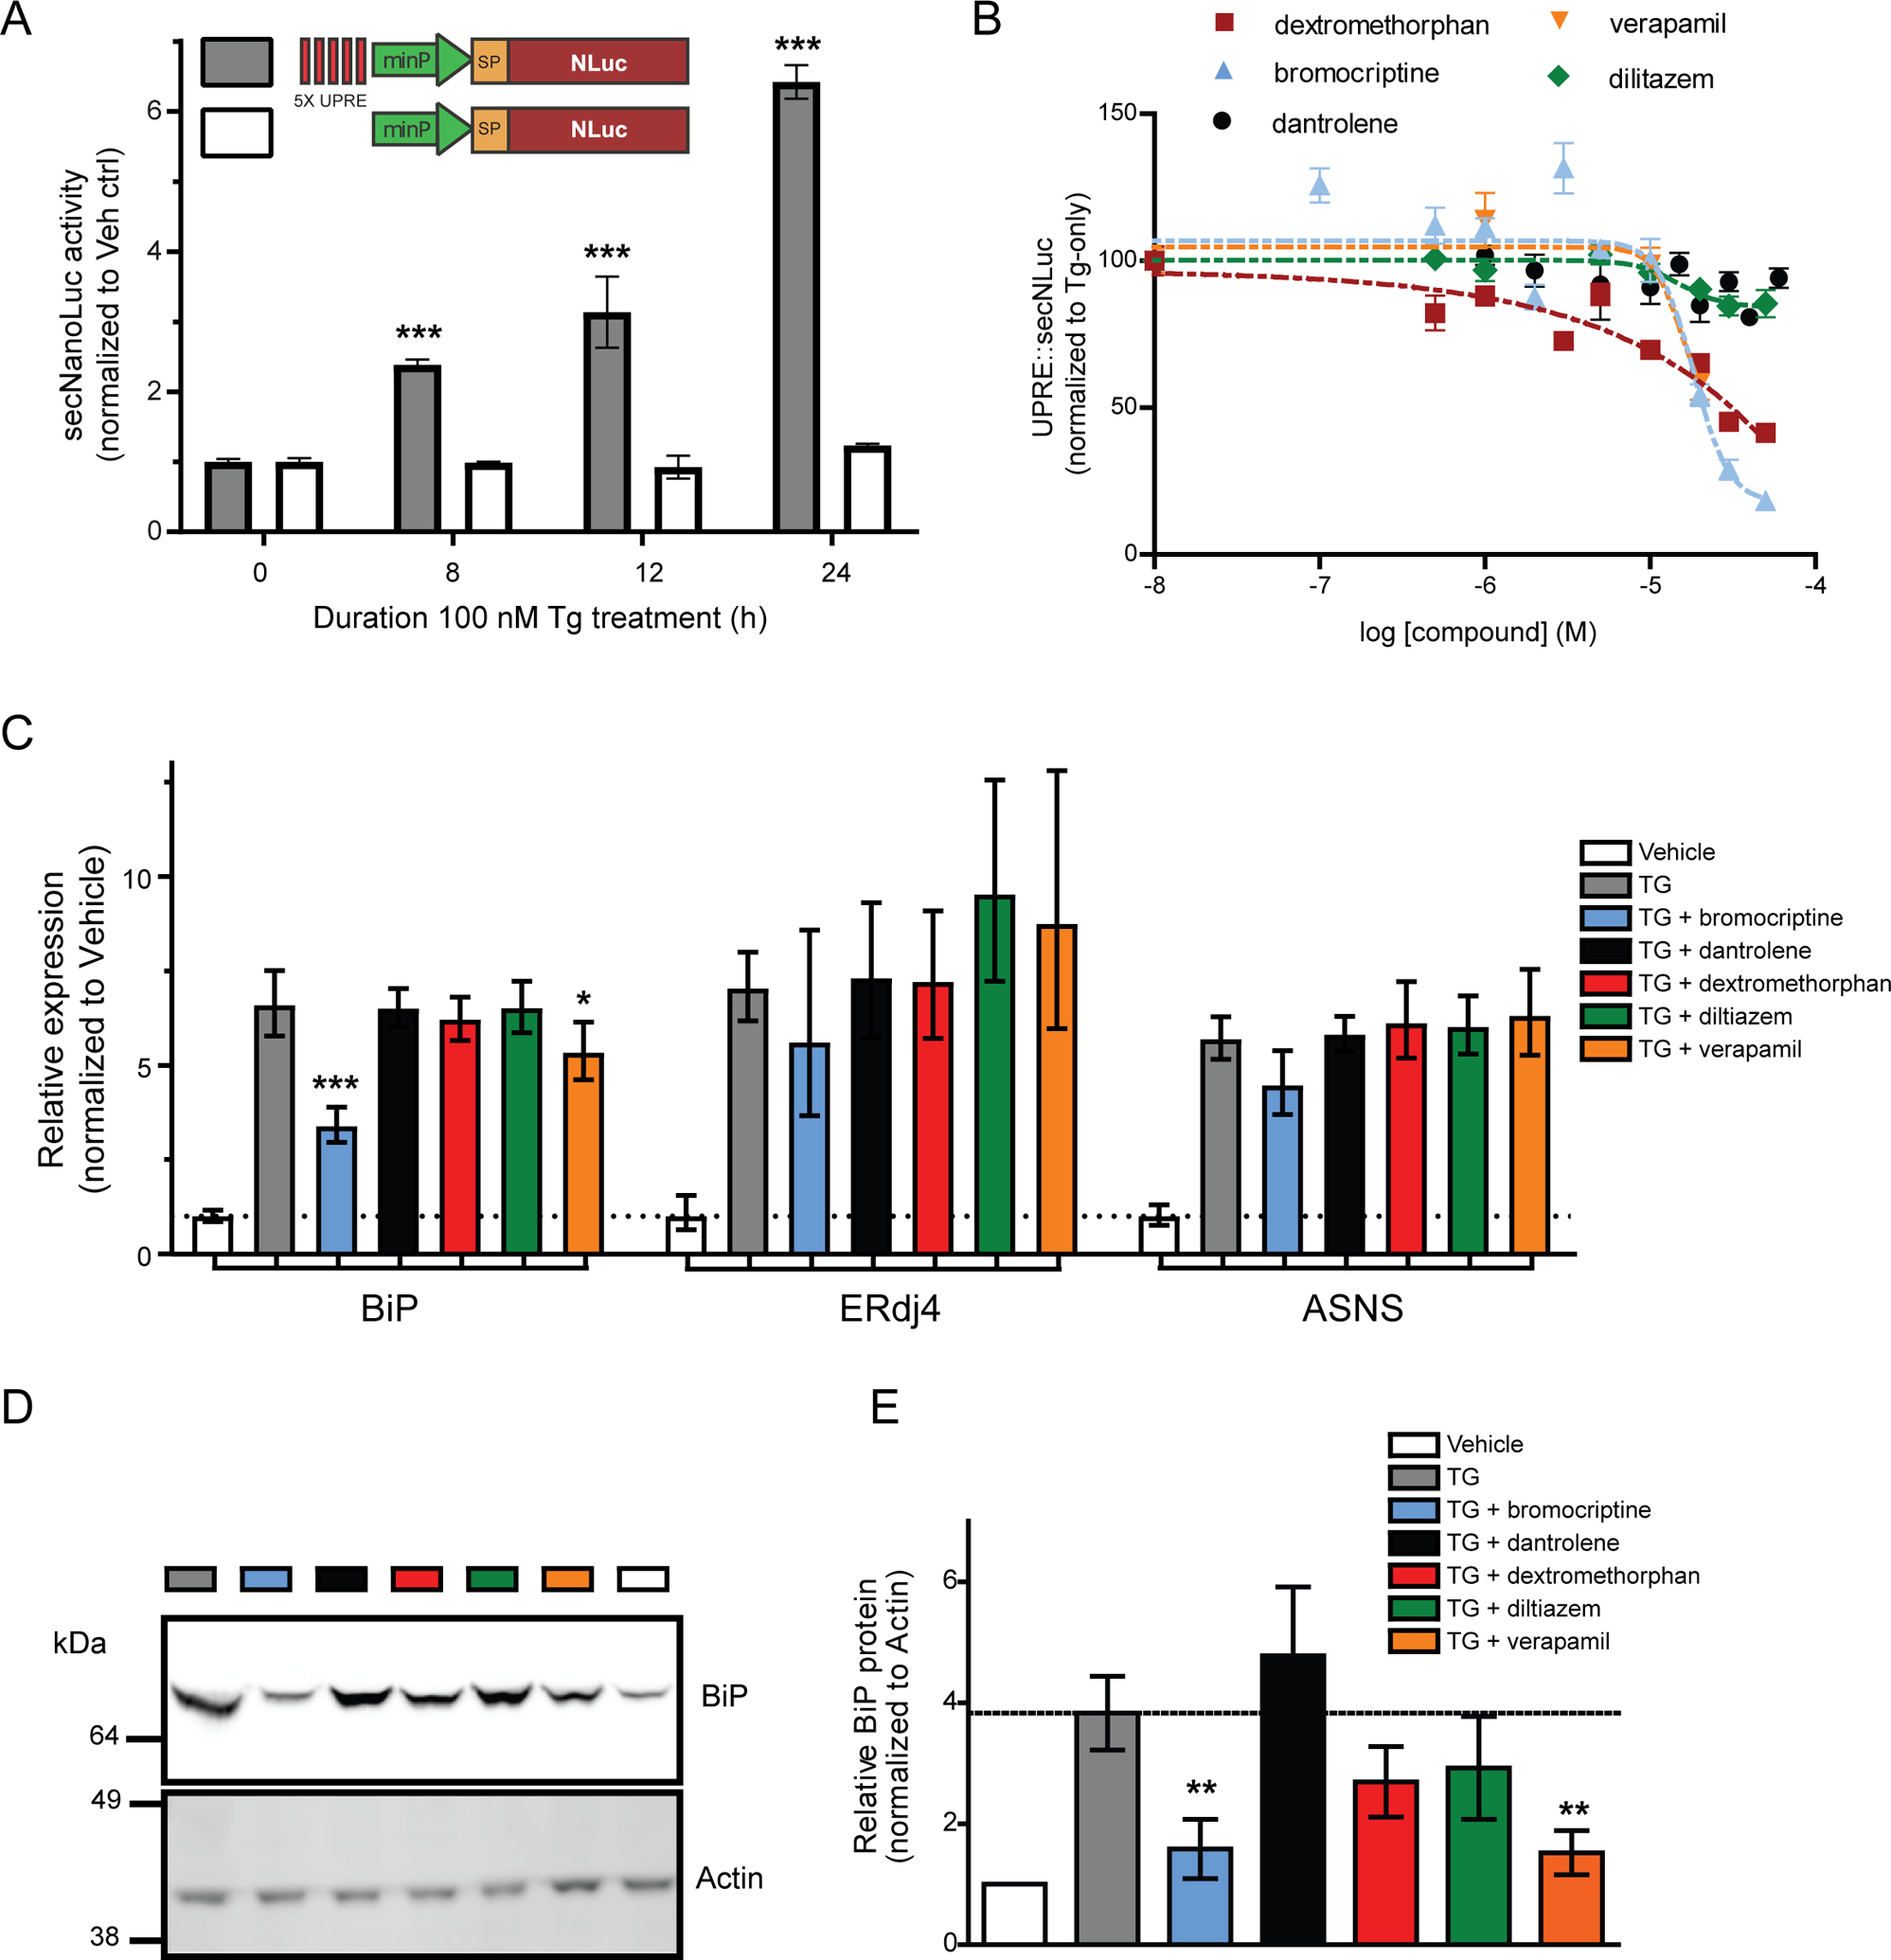
(A) A secreted reporter of UPR activity was measured after 100 nM Tg treatment by collecting medium at different timepoints (gray bars; mean ± SEM, treated: n=6, control: n=18 wells; one-way ANOVA with Dunnett’s multiple comparison test, *** p ≤ 0.001). A control reporter, lacking the 5X UPRE elements, does not respond to thapsigargin (white bars; mean ± SEM, treated: n=6, control: n=18 wells). (B) Verapamil, bromocriptine, and dextromethorphan reduce 5X-UPRE-secNLuc. Cells were treated with compound for 24 h followed by an additional 24 h in the presence of 100 nM thapsigargin. 5X-UPRE-secNLuc activity was normalized to the thapsigargin-only control (mean ± SEM, n=3 independent experiments). (C) Quantitative RT-PCR analysis of BiP, ERdj4, and ASNS mRNA levels to assess ATF6, XBP1, and PERK signaling pathways of the UPR. Cells were pre-treated with 30 μM compounds 16 h prior to a 4 h incubation with 100 nM thapsigargin (2−ddCq ± upper and lower limits, n=6, ***p<0.001, *p<0.05 as compared to thapsigargin only, one-way ANOVA and Dunnett’s multiple comparisons test). (D) BiP protein levels were examined using the same treatment paradigm described for panel C. Actin was immunoblotted as a loading control. (E) Summary of BiP expression for four independent experiments described in panel D (mean ± SEM, **p<0.01, one-way ANOVA and Dunnett’s multiple comparison test). See also Figure S3.
Anti-exodosis activity of compounds examined using in vitro models of ER/SR calcium depletion
Next, we sought to model exodosis caused by ER calcium depletion in disease relevant contexts. Towards monitoring other cell types that are highly dependent on ER calcium fluctuations, primary human skeletal muscle cells were transduced with an AAV vector expressing GLuc-SERCaMP and treated with thapsigargin to cause ER/SR calcium efflux. As expected, thapsigargin treatment elicited a dose-dependent increase in secreted GLuc activity (Figure 4A). Dextromethorphan, bromocriptine, dantrolene, verapamil, and diltiazem all partially attenuated GLuc-SERCaMP release following a 30-minute pre-treatment, with bromocriptine and dextromethorphan having the greatest effect (Figure 4B; Figure S4A,B). This could have implications for the treatment of neuromuscular diseases in which ER calcium dysfunction is observed, such as in ryanodine receptor isoform 1-related myopathies (RYR1-RM).
Figure 4: HTS compound activity in other in vitro models of ER/SR Ca2+ depletion.

(A) Thapsigargin-induced GLuc-SERCaMP release in primary human skeletal muscle cells. Primary human skeletal muscle cells were treated with 3–300 nM thapsigargin. GLuc-SERCaMP release was measured 8 h after thapsigargin treatment and normalized to vehicle control (mean ± SEM, n=9–10 wells, one-way ANOVA, Dunnett’s multiple comparison test vehicle vs Tg). (B) Effect of compound pre-treatment on GLuc-SERCaMP release in primary human skeletal muscle cells. Luminescence was measured 8 h after 100 nM thapsigargin treatment (mean ± SEM, n=11–12 wells per drug concentration, (C) Tetracycline-inducible Wfs1 knockdown in INS1 832/13 cells induces UPR. BiP, ERdj4, and ASNS transcript levels were measured 48 h after doxycycline treatment (2−ddCq ± upper and lower limits, n=9 wells, two-way ANOVA with Sidak multiple comparisons, **p<0.01). (D) UPR is not induced in parental INS1 832/13 cells (n=3 wells). (E) Wfs1 knockdown induces caspase 3/7 activity. Cells were incubated with 2 μg/mL doxycycline for 48 h and caspase 3/7 was measured using Caspase-Glo Assay reagents (n=64 wells per group). (F) Compound effect on caspase 3/7 induction following Wfs1 knockdown. Cells were treated with compounds and doxycycline for 48 h and caspase 3/7 activity was measured. Values were normalized using a CellTiterGlo ATP assay, to account for changes in cell viability (mean ± SEM, n = 3). (G, H) SH-SY5Y cells were exposed to increasing duration of oxygen-glucose deprivation (OGD), followed by return to normoxic conditions for 24 h. (G) Viability was assessed using CellTiterGlo ATP assay (mean ± SEM, normoxia: n=18 wells, OGD timepoints: n=6 wells). (H) GLuc-SERCaMP was measured in the medium (secreted) and in lysates (intracellular), and the secreted ratio was calculated (mean ± SEM, normoxia: n=18 wells, OGD timepoints: n=6 wells). (I) Viability after OGD (16 h hypoxia plus 24 h normoxia). All drugs were added concurrent with the beginning of OGD. CellTiterGlo luminescence was normalized to normoxia controls (mean ± SEM; n=6 independent experiments). (J) Micrographs of cells after exposure to OGD (16 h hypoxia plus 24 h normoxia). All compounds were dosed at 20 μM, except dantrolene, which was used at 30 μM. (K) GLuc-SERCaMP release was measured after OGD (16 h hypoxia plus 24 h normoxia) and normalized to vehicle treated controls (mean ± SEM; n=6 independent experiments). See also Figure S4.
As a second in vitro model of exodosis triggered by ER calcium depletion, we examined Wolfram syndrome, a rare monogenic disorder characterized by juvenile-onset diabetes, optic nerve atrophy, and neurodegeneration. Pathogenic variants in the Wolfram Syndrome 1 (WFS1) gene, which encodes an ER localized protein, result in dysregulation of the ER calcium store (Lu et al., 2014; Osman et al., 2003). We used a previously characterized rat pancreatic beta cell model in which doxycycline-induced knockdown of Wfs1 triggers caspase-dependent cell death (Fonseca et al., 2012), and hypothesized the SERCaMP screening hits would attenuate caspase activation via stabilization of ER proteome. Forty-eight hours after doxycycline treatment, markers of ER stress were elevated in the knockdown cells (Figure 4C), but not parental cells (Figure 4D), confirming activation of the UPR in the cell model. Wfs1 knockdown also increased extracellular carboxylesterase activity (Figure S4C), a previously identified biomarker of ERS proteins undergoing exodosis caused by ER calcium depletion (Trychta et al., 2018b). Wfs-1 knockdown induced activation of caspase 3/7 (Figure 4E) and the assay was miniaturized to a 1536-well format to facilitate high throughput drug testing (Figure S4D). Bromocriptine, verapamil, and diltiazem each reduced caspase 3/7 activation associated with Wfs1 knockdown (Figure 4F). We next tested the compounds in an in vitro oxygen-glucose deprivation (OGD) model of stroke. Stroke represents a disease with a complex pathology driven by many mechanisms including ER calcium dysregulation (Bodalia et al., 2013; Bull et al., 2008; Trychta et al., 2018a). First, we demonstrated that in vitro oxygen glucose deprivation of SH-SY5Y cells (timeline in Figure S4E), elicited a time-dependent decrease in cell viability (Figure 4G), an increase in the exodosis phenotype based on GLuc-SERCaMP (Figure 4H), and an increase in secretion of the endogenous ERS-containing protein, MANF (Figure S4F). Dantrolene, diltiazem, and bromocriptine all improved cell attachment and viability (Figure 4I,J) and decreased GLuc-SERCaMP secretion (Figure 4K), consistent with reversal of the exodosis phenotype. The effect of bromocriptine was particularly compelling, given it also showed activity in the aforementioned assays; therefore, we focused our efforts on further investigating bromocriptine’s ability to attenuate exodosis.
Bromocriptine and its GPCR-defective analogs attenuate exodosis caused by oxygen glucose deprivation in vitro
In addition to secretion of the GLuc-SERCaMP reporter, our previous studies revealed the departure of endogenous ER resident proteins, such as ER luminal chaperones, in response to thapsigargin or oxygen-glucose deprivation, which could be partially reversed by dantrolene administration (Trychta et al., 2018a). To explore whether bromocriptine could similarly affect secretion of protein with diverse ER retention sequences (ERS), representing resident proteins of the ER, we examined a set of 94 reporter proteins that were tagged with ERS and non-ERS tails derived from the human proteome (Table S2, Figure S5A). Bromocriptine broadly inhibited thapsigargin-induced release of the reporter proteins (Figure 5A). Furthermore, bromocriptine and dantrolene had similar effects in the thapsigargin-induced model of ERS protein secretion (Figure S5B). The effect on PDI, MANF, and carboxylesterases, which represent three endogenous ERS containing proteins, was also examined. Bromocriptine reduced thapsigargin-induced secretion of all three proteins (Figure 5B–D) but had minimal effect on their secretion under non-stressed conditions (Figure S5C). Oxygen-glucose deprivation also promotes an exodosis phenotype (Trychta et al., 2018a) (Figure S5A) and bromocriptine broadly reduced the OGD-induced release of the reporter proteins (Figure 5E). Again, the exodosis response to bromocriptine and dantrolene exhibited similar profiles (Figure 5F) and the OGD-induced release of carboxylesterases was decreased in bromocriptine treated cells (Figure 5G). In summary, these results indicate that bromocriptine can counteract exodosis caused by ER calcium dysfunction related to thapsigargin and oxygen-glucose deprivation, similar to what was previously observed for dantrolene (Trychta et al., 2018a).
Figure 5. Effects of bromocriptine on ER calcium triggered release of ERS proteins (exodosis).
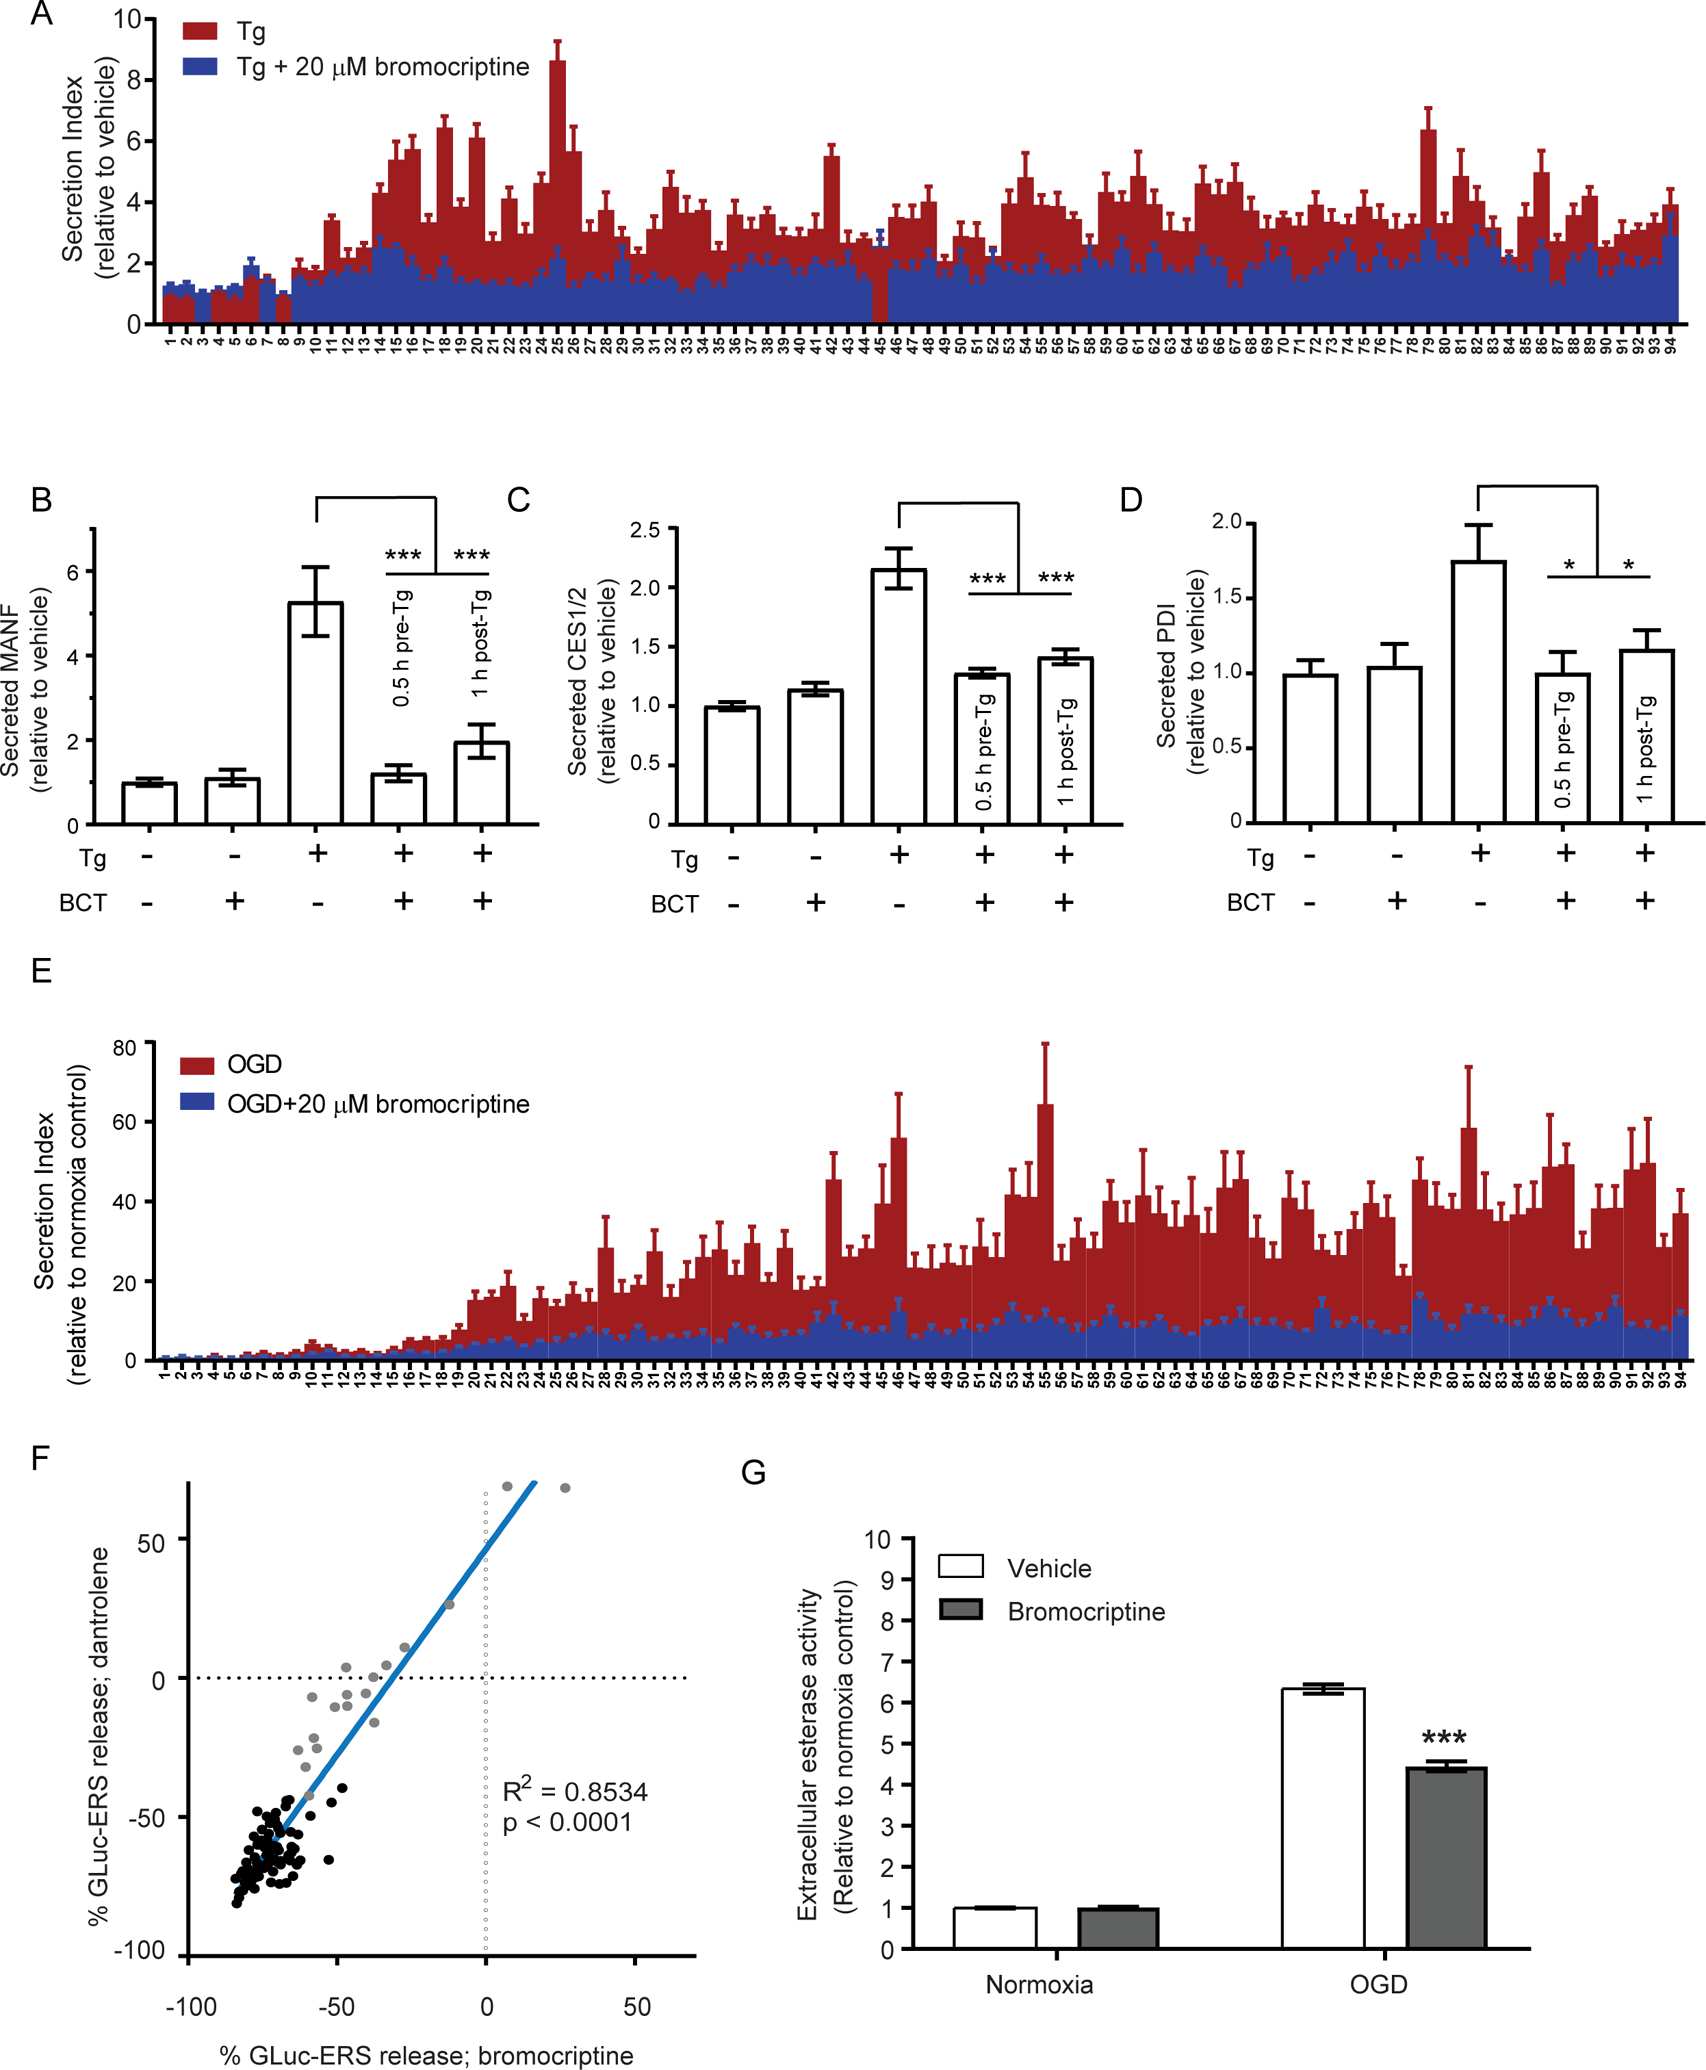
(A) SH-SY5Y cells were transfected with GLuc-ERS constructs and exchanged into growth media containing 1.5% BGS after 28 h. Treatments began 16 h after the media exchange. Effects of a 30 min pre-treatment with 20 μM bromocriptine on the GLuc-ERS reporter library secretion following an 8 h treatment with 200nM thapsigargin were measured. Each number along the X-axis represents a GLuc reporter protein with an appended seven amino acid ERS tail that corresponds to the C-terminus of a human ER luminal protein (see Table S2 for key). This ERS tail library represents a majority of identified ERS proteins. (B-D) Bromocriptine (BCT; 20 μM) reduces secretion of ERS-containing proteins when applied 0.5 h before or 1 h following thapsigargin treatment (200 nM). (B) Fold change in extracellular MANF measured using an HTRF assay (mean ± SEM, n=9 wells, ***p<0.001, one-way ANOVA). (C) Fold change in esterase activity measured using a fluorescent substrate (mean ± SEM, n=22 wells, ***p<0.001, one-way ANOVA). (D) Secreted PDI was assessed by immunoprecipitating from cell culture media and detected by immunoblot. Western blots were quantified by densitometry (mean ± SEM, n=9, *p<0.05, one-way ANOVA). (E) Fold change in secretion of GLuc-ERS reporters following OGD (16 h hypoxia plus 24 h normoxia) without bromocriptine (mean ± SEM, n=15 wells) or with 20 μM bromocriptine (mean ± SEM, n=9 wells). (F) Secretion of GLuc-ERS reporters from SH-SY5Y cells treated with dantrolene (30 μM; mean, n=6 wells) and bromocriptine (20 μM; mean, n=9 wells) while exposed to OGD (16 h hypoxia plus 24 h normoxia). (G) Bromocriptine (20 μM) attenuates the release of an esterase (ERS-containing protein) from SH-SY5Y cells following OGD (16 h hypoxia plus 24 h normoxia). Esterase activity was measured in culture medium using a fluorogenic substrate (mean ± SEM, n=24 wells, ***p<0.001, two-way ANOVA). See also Figure S5.
Bromocriptine has been extensively characterized as a dopamine receptor 2 (D2R/DRD2) agonist and has been used clinically for hyperprolactinemia and Parkinson’s disease. In 2008, the compound was approved for the treatment of type 2 diabetes (T2D). Notably, it has been difficult to ascribe bromocriptine’s pharmacodynamic effects in various human conditions solely to its dopamine-related activity (Michael Besser et al., 2018). To examine the possibility that D2R agonism was driving the anti-exodosis phenotype, four additional D2R agonists of different chemotypes were examined, which showed no activity in the SERCaMP assay (Figure S6A). To more directly assess the dopaminergic activity of bromocriptine on exodosis, we modified the molecule by placing adducts on the nitrogen atom of indole ring of the lysergic acid portion, which we predicted would reduce its dopamine receptor activity (analogs 686 and 688, Figure 6A). The two novel bromocriptine analogs were both equally effective as bromocriptine in the SERCaMP assay (Figure 6B). In contrast, the activity of the analogs was significantly right-shifted in D2R coupling assays for both β-arrestin (100–300 fold; Figure 6C) and Gi recruitment (40–100 fold; Figure 6D), confirming reduced dopamine receptor 2 activity. The activity of the bromocriptine analogs on other dopamine receptors (D1R, D3R, D4R, and D5R) was also assessed using the G protein recruitment assay. Drug response curves for all four receptors were right-shifted relative to the parent bromocriptine, consistent with lower affinity profile of the analogs to the entire dopamine receptor family (Figure S6B–E). Since bromocriptine is known to also activate non-dopaminergic GPCRs, we screened the parent molecule and 688 analog in the NIMH Psychoactive Drug Screening Program (Kroeze et al., 2015), examining 320 receptors at 3 μM. Several non-dopamine receptors showed activity, including ADRA2C (Table S3). Next, we directly compared activity of the analog and bromocriptine at concentrations ranging from 1 pM to 30 μM for the receptors that showed the highest activation in the single dose screen (Figure S6F–O). The 688 analog had decreased affinity than bromocriptine for receptors including DRD2, DRD3, ADRA2A and ADRA2C, but not others including GPR34, MT1, ADORA1, and GPR120. In light of the equipotent activity for the analogs in the SERCaMP assay, these data support an exodosis modulating activity of bromocriptine that is not driven by the dopamine receptor, and potentially imparted via a non-GPCR target. We next tested the analogs in the OGD model; similar to bromocriptine, the analogs reduced OGD-induced secretion of GLuc-SERCaMP (Figure 6E), improved cell viability (Figure 6F, Figure S6P), and reduced secretion of the ER resident protein MANF (Figure S6Q).
Figure 6: Bromocriptine analogs have diminished dopamine receptor activity but retain effects on SERCaMP release.

(A) Bromocriptine and two analogs modified at the nitrogen atom of indole ring of lysergic acid portion. (B) Bromocriptine and two analogs show similar attenuation of Tg-induced SERCaMP release. Both analogs of bromocriptine have diminished potencies for dopamine receptor 2 activation in a (C) β−arrestin recruitment assay (mean ± SEM, n=4) and (D) Gi protein engagement assay (mean ± SEM, n=12). (E) GLuc-SERCaMP secretion in response to oxygen-glucose deprivation (OGD) is attenuated by 20 μM bromocriptine and analogs (mean ± SEM, n=24 wells, ***p<0.001, two-way ANOVA with Dunnett’s multiple comparisons test). (F) Micrographs were captured at the end of OGD. Scale bar is 200 μm. See also figure S6.
Bromocriptine and its GPCR-defective analogs reduce ischemic injury in a rodent model of stroke
The efficacy of bromocriptine against ischemic injury was examined in vivo using a transient, distal middle cerebral artery occlusion (MCAO) model of stroke in rats causing a cortical injury (Chen et al., 1986). Dantrolene and ER stress inhibitors confer protective effects in this model (Li et al., 2005), indicating a possible connection with stabilizing the ER proteome. We first examined the effects of dantrolene on stroke outcomes using an intracerebroventricular injection (30 nmol in 20 μL) immediately prior to the occlusion of the MCA. Dantrolene reduced the infarction volume and improved body asymmetry caused by a 60 minute middle cerebral artery occlusion (Figure S7A–C). Next, we tested bromocriptine and the analogs (686 and 688), which we hypothesized would also confer protection against ischemic injury in the MCAO model. Compared to vehicle injected animals, all three compounds showed significant reduction in infarction volume, body asymmetry, and Bederson’s neurological score (Figure 7A–E). Analog 686 was more effective than bromocriptine at reducing infarction volume (Figure 7C).
Figure 7. Bromocriptine and analogs tested in a rat model of stroke and mouse model of diet-induced obesity.
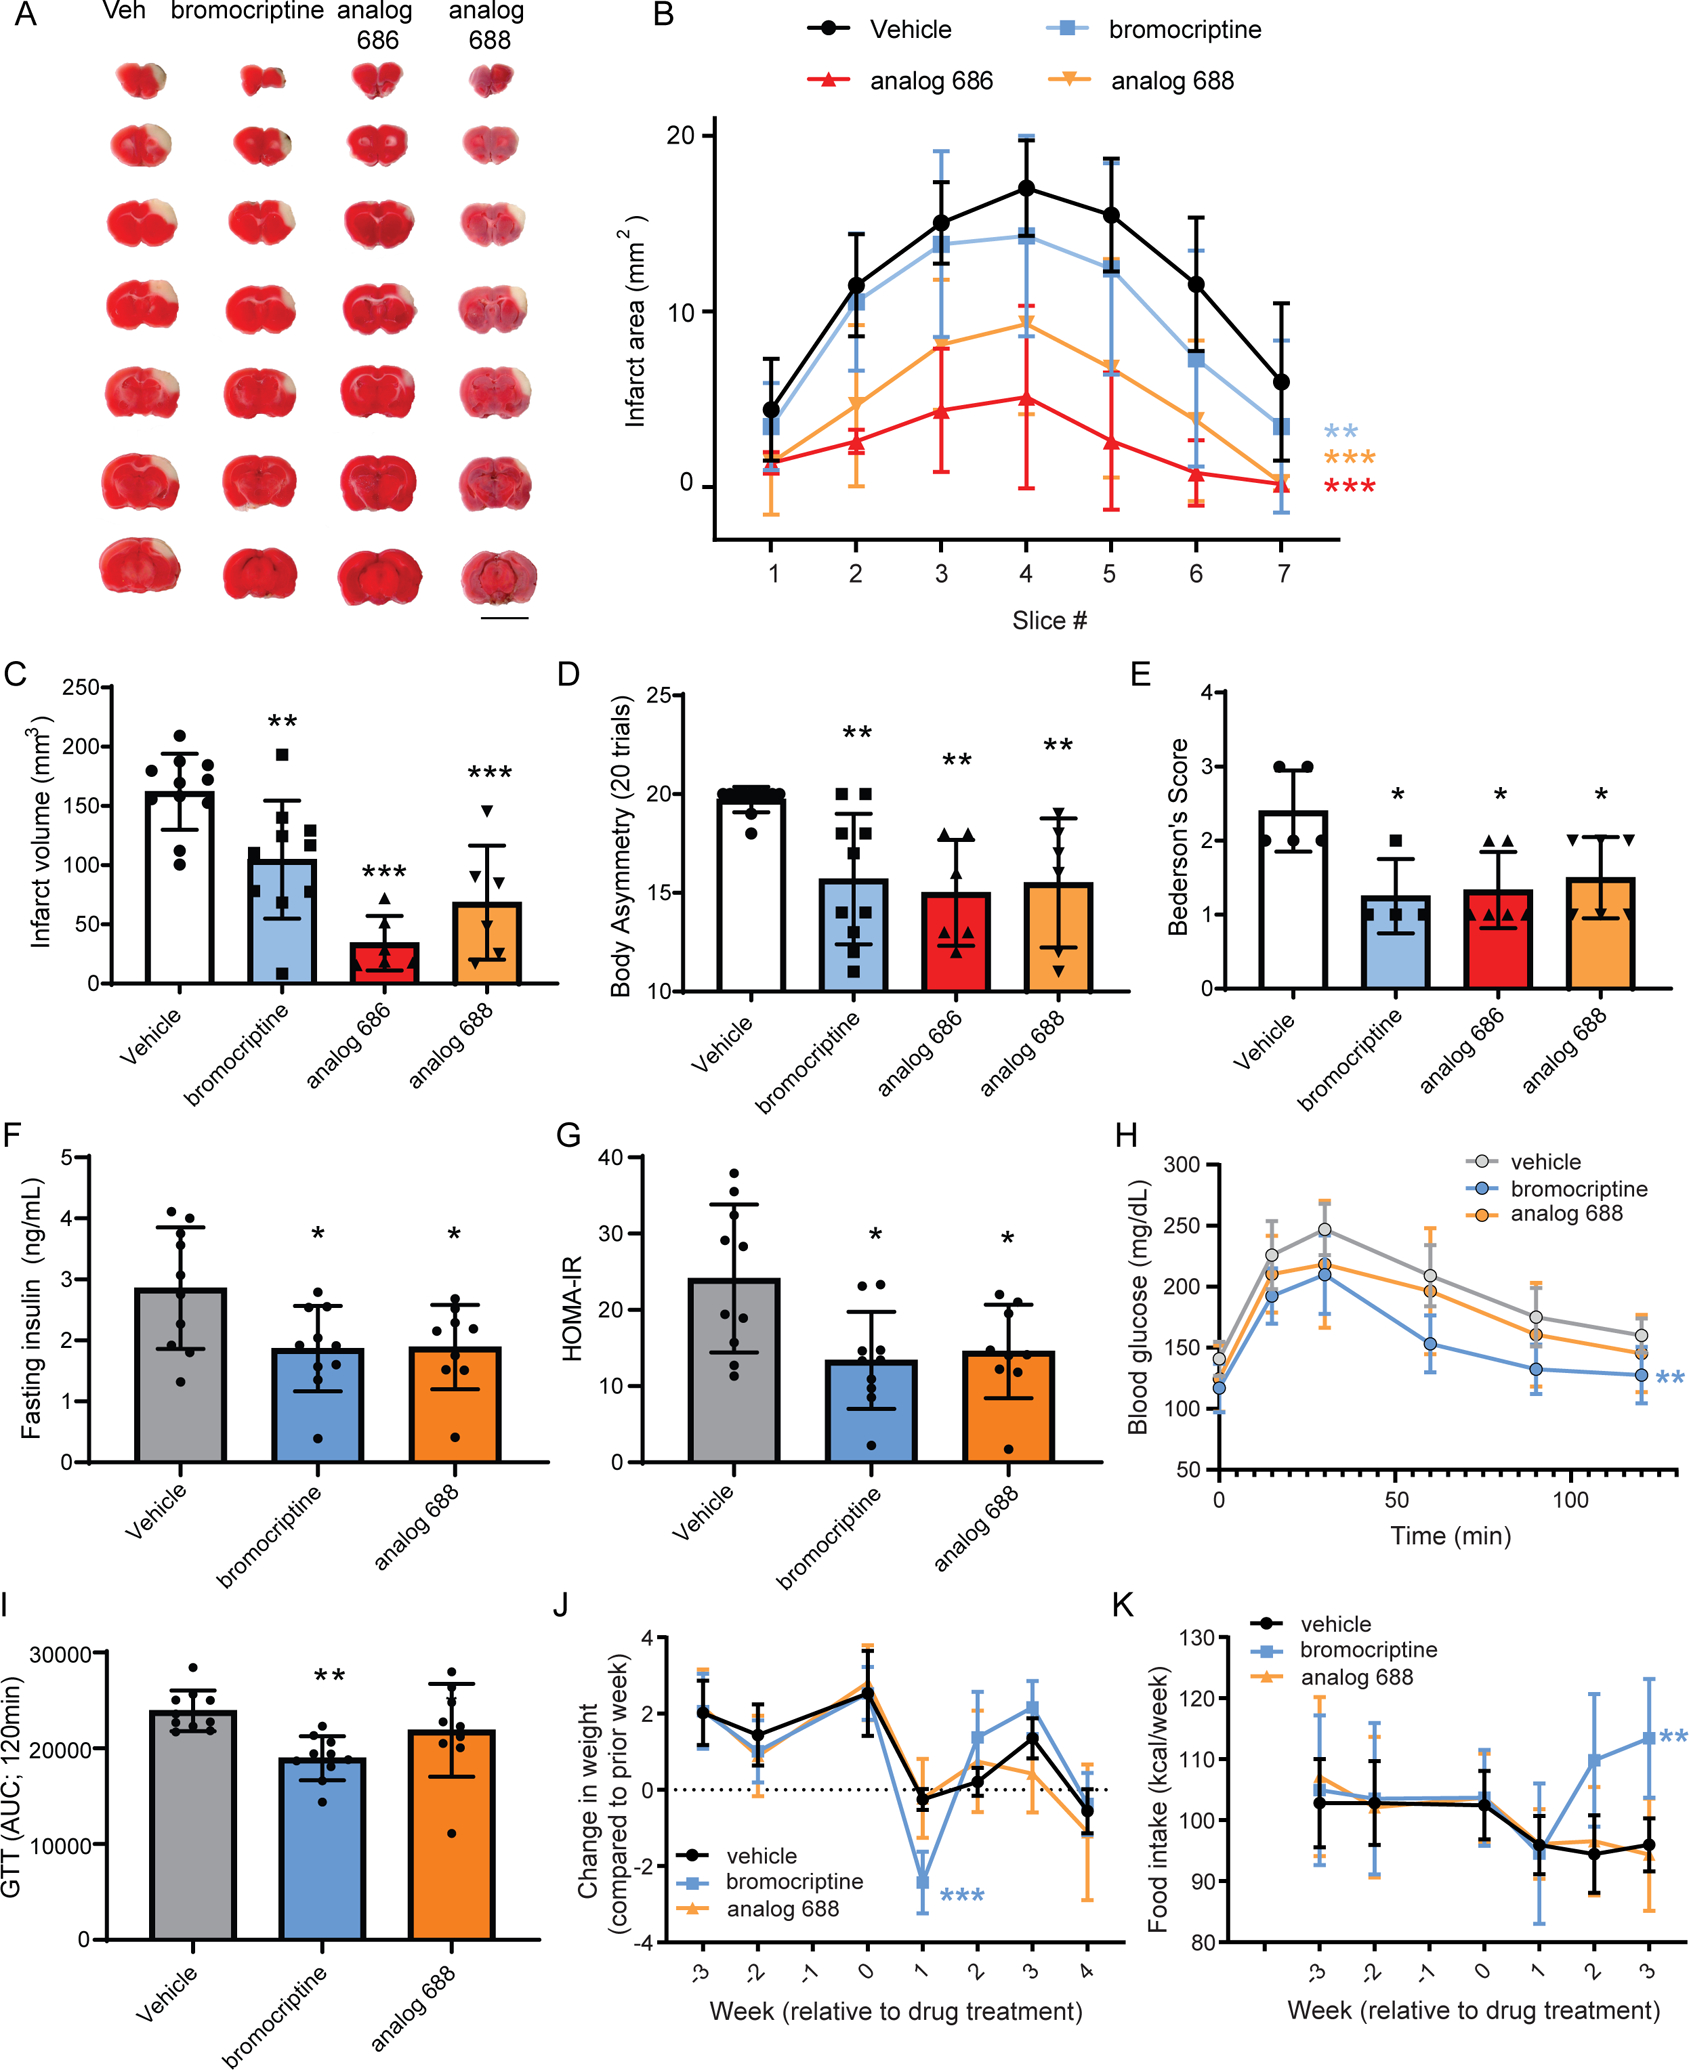
(A) Representative TTC stained rat brain slices (2 mm) showing the area of infarction 2 days following administration of bromocriptine analogs and MCAo. Red indicates metabolically active brain areas, while white areas are indicative of infarct tissue. Scale bar is 1 cm. (B) Quantitative analysis of the area of infarction per 2-mm brain slice from rostral to caudal (n=6–11 rats per each group, two-way ANOVA with Dunnett’s multiple comparisons test versus vehicle, **p<0.01, ***p<0.001). (C) Total infarct volume measured across slices (n=6–11 rats, one-way ANOVA with Dunnett’s multiple comparisons test versus vehicle, ** p<0.01, *** p<0.001). (D) Body asymmetry test and (E) Bederson’s test for neurological abnormality scores were performed to assess stroke-related behaviors (n=6–11 rats body asymmetry and n=4–6 rats Bederson’s test, one-way ANOVA with Dunnett’s multiple comparisons test versus vehicle, *p<0.05, ** p<0.01, *** p<0.001). All data mean ± SD. (F,G) Adult male mice on a high fat diet for eight weeks were injected daily (i.p.) with vehicle, 12 mg/kg bromocriptine, or 12 mg/kg analog 688 over 3 weeks while remaining on the high fat diet. (F) Fasting insulin and (G) insulin resistance index (HOMA-IR) were measured after 3 weeks of drug treatment. (H) Glucose clearance is improved by bromocriptine. (I) The area under the curve analysis of the glucose clearance in panel C. (J) Weight change per week identifies a significant decline after the first week of bromocriptine injections compared to vehicle or analog 688. (K) Food intake significantly increased following bromocriptine administration during the 2nd and 3rd weeks of injection. Data are mean +/− SD. Statistical differences are based on one-way ANOVA followed by Tukey post hoc multiple comparisons test, *p<0.05 vs vehicle (F,G), **p<0.01 bromocriptine vs vehicle (I) ***p<0.001 bromocriptine vs vehicle and analog 688 at 1 week post-injection (J); two-way ANOVA, Dunnett’s post hoc test, **p<0.01 bromocriptine vs vehicle (H) and (K) week 1–3 drug treatment period. See also Figure S7.
Comparing metabolic effects of bromocriptine and its analog in a mouse model of diet-induced obesity
Bromocriptine is currently used clinically to treat T2D, a disease that has been linked to ER calcium depletion (Kang et al., 2016; Park et al., 2010). Studies support a central nervous system mediated mechanism of action for bromocriptine, acting to reset dopaminergic and sympathetic tone, although this remains incompletely defined (Defronzo, 2011; Framnes-DeBoer et al., 2020). Given the connection between ER calcium homeostasis in peripheral tissues (e.g. liver, pancreas) and glucose homeostasis, we hypothesized that bromocriptine’s effects may also derive from its apparent non-dopaminergic effects on the ER calcium store and exodosis. First, we assessed the pharmacokinetics (PK) of bromocriptine and the two analogs in plasma, liver, pancreas and brain. Tissue exposure was similar for the three compounds, with highest levels detected in the pancreas (Table S4A). Importantly, we observed minimal metabolic conversion of analog 686 to the parent bromocriptine molecule (<1% in brain), and no detectable conversion of analog 688. Based on these PK results, dopaminergic agonism in the CNS is expected to be substantially reduced for the 686 and 688 compounds, which provided a means to test the hypothesis that bromocriptine acts peripherally via a non-D2R mechanism. To explore this possibility, we examined bromocriptine and analog 688 in a high-fat diet induced obesity (DIO) mouse model. Animals were placed on high fat diet for 8 weeks then given intraperitoneal injections of compounds daily (12 mg/kg) for 4 weeks while maintaining the high fat diet. Both bromocriptine and analog 688 reduced fasting insulin and insulin resistance index (HOMA-IR) compared to vehicle treated animals (Figure 7F,G; Table S5). Both bromocriptine and analog 688 reduced fasting glucose levels at 4 hours but the bromocriptine group showed a larger decrease (Table S5). Only bromocriptine reduced the glucose excursion AUC in glucose tolerance tests suggesting bromocriptine was more effective at reducing hyperglycemia (Figure 7H,I). There were no significant differences in body weight, fat mass or lean mass throughout the experiment (Figure S7D–F); however, when comparing changes in weight from week to week, bromocriptine caused a significant decrease in body weight following the first week of injections compared to vehicle and analog 688 (Figure 7J). At the end of the second and third week of injections, food intake was elevated in bromocriptine-injected animals relative to other groups (Figure 7K). Cumulative caloric intake and energy expenditure during the three weeks of treatment were also significantly higher only in the bromocriptine group (Figure S7G 9D and Table S5). PK analysis confirmed similar plasma levels between animals treated with bromocriptine and analog 688 in the diet-induced obesity model (Table S4B). Collectively, these data suggest that like bromocriptine, the bromocriptine analog 688 is capable of altering fasting insulin, insulin resistance and fasting glucose. The analog, however, did not show the transient weight loss, increased food intake, or elevated energy expenditure that was observed with bromocriptine.
Discussion:
Human diseases have been associated with disruptions in ER homeostasis (Hetz et al., 2020; Mekahli et al., 2011) and therapeutic strategies aimed at restoring ER functions remain an area of active investigation (Gonzalez-Teuber et al., 2019). ER calcium dysregulation is observed in various pathologic states (Mekahli et al., 2011), with depletion triggering the release of ER resident proteins (Trychta et al., 2018a). We sought to identify small molecules that could reverse this phenotype. In the most straightforward approach, this could be accomplished by increasing calcium uptake into the ER/SR (targeting SERCA) or by reducing calcium efflux (targeting IP3R or RyR). These mechanisms have been the focus of significant research efforts, resulting in clinical trials and approved drugs. Much attention has been devoted to enhancing SERCA activity to restore ER calcium homeostasis, primarily via AAV-based gene therapy. Advanced heart failure is currently the major indication for this approach, where increasing SERCA expression was beneficial in both animal models and early human trials (Jessup et al., 2011; Miyamoto et al., 2000; Prunier et al., 2008). The efficacy of SERCA-based gene therapy, however, remains uncertain as the largest clinical trial (CUPID2, ClinicalTrials.gov ID NCT01643330) reported a failure to meet primary endpoints (Greenberg et al., 2016). Given that significant efforts have already gone towards identifying modulators of ER calcium, our approach was to screen for drugs that inhibit the exodosis phenotype that arises from decreased ER calcium.
In addition to SERCA, IP3R, and RyR, there are additional proteins and signaling pathways that modulate ER calcium dynamics. We hypothesized that these represent viable therapeutic targets that could be identified using the SERCaMP assay, which reports on exodosis independent of a pre-defined molecular target. In addition, drugs that affect ER to Golgi transport and the KDELR retrieval pathway may also be identified in our screen. Because the primary screen was target agnostic, the hit compounds were not expected to show uniform activity across the set of orthogonal assays. For example, a compound’s target might not be present in all cell types (e.g. beta cells versus neurons), or modulation of a target could be insufficient to prevent exodosis in a particular disease model. Therefore, the absence of activity in an assay or model was not interpreted as a compound lacking bona fide ER proteome modulating activity. The clinically approved and investigational compounds identified by our approach provide a rational starting point for further investigation into the broad range of human pathologies associated with exodosis triggered by ER calcium depletion; this set includes 42 FDA-approved drugs (Table S1c).
Dantrolene is a RyR antagonist that stabilizes the resting state of the channel (Choi et al., 2017) and shows protective effects in neurodegenerative diseases associated with ER calcium dysfunction (Sun and Wei, 2020). This compound was active in the primary screen, which provided confidence in the ability to detect relevant small molecules and served as a benchmark for the in vitro and in vivo studies. Our finding that dantrolene is protective in a stroke model is consistent with previous reports that demonstrate RyR antagonism can reduce neuronal loss associated with hypoxia-reperfusion injury (Boys et al., 2010), reduce infarct volume (Hong and Chiou, 1998; Li et al., 2005) and reduce ER stress markers (Li et al., 2005). Notably, dantrolene was administered acutely prior to arterial occlusion in each of these studies; the development of treatments that are effective in the post-stroke period are imperative, as acute prophylactic care is challenging due to the unpredictable nature of the event. A Phase I study of dantrolene for the treatment of stroke-associated spasticity found reduced clinical spasticity and improved motor abilities, and only placebo treated patients continued to show signs of deterioration in Phase II (Ketel and Kolb, 1984). Given that dantrolene can stabilize ER calcium and the ER proteome and improve cell viability following oxygen-glucose deprivation (Trychta et al., 2018a), revisiting the use of dantrolene as a post-stroke therapeutic is warranted.
The HTS also identified several clinically-approved drugs that are not known to directly bind RyR, IP3R, or SERCA. The most potent of these was dextromethorphan, a high affinity inhibitor of the serotonin transporter and sigma-1 receptor, which is used clinically for cough suppression (Taylor et al., 2016). Dextromethorphan showed limited activity in the set of orthogonal assays, so it is unclear whether this compound is a bona fide exodosis modulator or a false positive. Sigma-1 receptor activity of dextromethorphan was of interest, owing to its reported ER localization and a role in cellular calcium signaling and ER stress (Hayashi and Su, 2007; Rosen et al., 2019). To explore this further we tested additional sigma-1 receptor agonists and antagonists; however, SERCaMP response did not track with expected pharmacologic activity (Figure S8A,B). Dextromethorphan has also been linked to cellular calcium via its antagonism of both L-type and N-type calcium channels (Carpenter et al., 1988); however, this possible mechanism was not further explored.
Two additional L-type calcium channel antagonists identified in the screen were verapamil and diltiazem, which are used clinically to treat cardiovascular disease via their effects on the AV node and smooth muscle cells lining the vasculature. L-type calcium channel antagonism is expected to decrease calcium-induced-calcium release through RyR (Bodi et al., 2005; Chavis et al., 1996) and diltiazem and verapamil have been reported to directly inhibit RyR (Shoshanbarmatz et al., 1991; Valdivia et al., 1990). It was postulated that their RyR activity was responsible for improved protein folding in a Gaucher’s disease model (Ong et al., 2010). Additionally, these compounds improve outcomes in models of diabetes and ischemia, which may be due to effects on ER calcium and ER proteostasis (Fansa et al., 2009; Maniskas et al., 2016; Ouardouz et al., 2003; Ovalle et al., 2018).
Of the compounds identified in this study, bromocriptine showed the most compelling activity across the panel of assays, including protective effects in models of skeletal muscle calcium dysregulation, Wolfram syndrome, oxygen glucose deprivation, T2D, and stroke. Bromocriptine was previously reported to protect hippocampal neurons from ischemic insult in gerbils (Liu et al., 1995), and was similarly reported to improve ischemia/reperfusion injury in heart (Gao et al., 2013) and kidney (Narkar et al., 2004). Ergot alkaloids such as bromocriptine have been postulated to cause myocardial infarction and stroke when used clinically (Larrazet et al., 1993); however, this view is controversial, as subsequent studies have found no association with ischemic injury (Arbouw et al., 2012). In fact, a study of approximately 2000 individuals taking bromocriptine for T2D revealed a 40% reduction in composite cardiovascular events (Gaziano et al., 2010) and bromocriptine improved peripartum cardiomyopathy (Hilfiker-Kleiner et al., 2017). Currently, the mechanistic underpinnings of bromocriptine’s cardioprotective effects are not known, but in light of the findings presented herein, ER calcium homeostasis and ER proteostasis may be positively affected.
The anti-exodosis activity of bromocriptine was consistently observed across the disease models we tested. Over 50 years ago, bromocriptine was discovered as an inhibitor of prolactin secretion (Fluckiger and Wagner, 1968) which later led to its clinical use for hyperprolactinemia to treat acromegaly by reducing circulating growth hormone levels (Lutterbeck et al., 1971; Thorner et al., 1975). Subsequent work suggested dopamine inhibits prolactin secretion (MacLeod and Lehmeyer, 1974) and bromocriptine-like molecules stimulate dopamine activity (Corrodi et al., 1973). The effects of bromocriptine as a dopamine agonist led to exploratory use in Parkinson’s disease patients, where it showed beneficial effects (Calne et al., 1974). Once the dopamine receptors had been identified, bromocriptine was shown to bind the D2 dopamine receptor but also bind other receptors such as adrenergic receptors and serotonin receptors (Jahnichen et al., 2005; Millan et al., 2002; Newman-Tancredi et al., 2002). The ability of bromocriptine to signal through non-dopaminergic receptors was confirmed in the current study using a GPCR screen performed by the Psychoactive Drug Screening Program (PDSP, UNC Chapel Hill; Figure S6). Historically, many of bromocriptine’s effects are ascribed to its dopamine-related activity, however, its ability to alter other GPCR-mediated signaling supports additional non-dopaminergic mechanisms of action. Throughout the many pre-clinical and clinical applications of bromocriptine over the past 50 years, the physiological changes have been viewed through the lens of dopamine receptor modulation, and alterations in ER calcium homeostasis have not received substantive investigation. A notable exception is a study that identified bromocriptine as cytoprotective in a thapsigargin-induced model of cell death. The bromocriptine-mediated protection was observed in cell lines that lacked the D2R, leading the authors to speculate the mechanism was unrelated to its canonical D2 receptor activity (Kim et al., 2012). In line with this interpretation, we found that bromocriptine, but not other D2 receptor agonists, could alter SERCaMP secretion. Furthermore, the bromocriptine analogs we designed, by functionalizing at the indole nitrogen of the lysergic acid portion, had reduced D2R activity (2–3 orders of magnitude) but demonstrated equipotent SERCaMP activity and were equally or more efficacious in the stroke models. The analog modifications are expected to disrupt the interaction within a deep pocket surrounded by TM3, TM5 and TM6 of D2R, based on a recent cryo-electron microscopy structure of bromocriptine bound to the lipid membrane embedded receptor (Yin et al., 2020). We tested molecules containing only the lysergic acid half of bromocriptine in the SERCaMP assay and found they had no effect (Figure S8C) further supporting that the ER calcium stabilizing effects are mediated through the tripeptide portion of bromocriptine. It remains possible that a non-dopamine receptor type GPCR mediates the SERCaMP effect; however, we hypothesize that the ER calcium and ER proteome stabilizing activity of bromocriptine is mediated by a distinct target that has not yet been identified, and our attempts to identify the target(s) have been unsuccessful to date. Importantly, the development of bromocriptine analogs represents an opportunity to evaluate therapeutic effects of bromocriptine without unwanted side effects arising from its activity on dopamine receptors and other GPCRs.
Bromocriptine’s action on hormone release led to its clinical use for T2D (Pijl et al., 2000). Using a diet-induced obesity mouse model of diabetes, we found that bromocriptine and analog 688 reduced fasting insulin and insulin resistance index HOMA-IR compared to vehicle treated animals, suggesting that bromocriptine-induced improvement of fasting glucose metabolism was independent of D2R activation. In contrast, only bromocriptine significantly improved the glucose tolerance test suggesting that bromocriptine was more effective than analog 688 at reducing hyperglycemia due to its dopaminergic activity. Of note, a transient drop in animal weight during the first week of drug administration and an increase in food intake during the 2nd and 3rd weeks were observed only in the bromocriptine treated animals, which we hypothesize may be mediated by dopamine-receptor activity. It has been postulated that bromocriptine affects glucose homeostasis via prolactin, the melanocortin system, and/or circadian rhythms related to its dopaminergic activity, however, a recent study demonstrated that the disruption of these three systems have no impact on bromocriptine’s effects in treating diabetes in mice (Framnes-DeBoer et al., 2020). Our findings support a model in which bromocriptine modulates ER stress response by altering the ER calcium store, and our observations for analog 688 raise the possibility that the beneficial effects of the T2D drug Cycloset (quick release bromocriptine mesylate) may be, in part, due to its effects on ER calcium and exodosis. There is substantial evidence that pancreatic beta cells and hepatocytes demonstrate ER calcium dysregulation in models of diabetes and obesity (Kang et al., 2016; Park et al., 2010; Santulli et al., 2015; Zhang et al., 2020), suggesting this hypothesis warrants further attention.
Stabilization of ER calcium has been shown to reduce exodosis; however, three of the five compounds tested in the GCaMPer fluorescence assay did not acutely prevent a decrease in ER calcium caused by thapsigargin treatment. These compounds may function by augmenting activity of the KDEL receptor retrieval pathway, which returns ERS-containing proteins from Golgi to the ER (Munro and Pelham, 1987; Semenza et al., 1990). Notably, the reversal of ER exodosis via stabilizing ER calcium and augmenting KDELR retrieval would be expected to have similar consequences in cells and tissues. For example, ERS-protein functions would be preserved within the ER lumen (e.g. protein folding, protein modification). Additionally, ERS-proteins would be not be released into the extracellular space, where the gain of function may have deleterious effects. Defining the consequences of exodosis in disease settings is an area of ongoing research that will benefit from the drugs identified in this study. In summary, our study identifies a collection of small molecules (Table S1) that can prevent the loss of ER resident proteins and may have therapeutic utility in diseases associated with ER calcium dysfunction.
STAR METHODS
RESOURCE AVAILABILITY
Lead Contact
Further information and requests for resources and reagents should be directed to and will be fulfilled by the Lead Contact, Brandon Harvey (BHarvey@intra.nida.nih.gov).
Materials Availability
This study did not generate new unique reagents.
Data and code availability
The high-throughput screening datasets generated during this study are available at Pubchem, AID numbers 1508627–1508630.
EXPERIMENTAL MODEL AND SUBJECT DETAILS
Animal studies
MCAO stroke model
Adult male Sprague-Dawley rats (8–12 weeks, weight 250–300 g; n=6–11 per treatment group) surgeries were done in accordance with the animal care guidelines of the “Principles of Laboratory Care” (National Institutes of Health publication No. 86‐23, 1996) and were approved by the National Health Research Institutes (Taiwan) Animal Care and Use Committee (Protocol No. 105079‐A; 105080).
Diet induced obesity model
C57Bl/6J male mice (15 weeks) were obtained from Jackson Laboratories (Bar Harbor, ME). Animals were assigned to treatment groups (n=10 per group, mean starting weight was 40g in each group). All animal studies related to high fat diet were carried out according to the US National Institutes of Health Guidelines for Animal Research and were approved by the NIDDK Institutional Animal Care and Use Committee. We complied with all relevant ethical regulations for animal testing and research.
Pharmacokinetics
Adult male CD-1 mice (8 weeks, n=3/sampling time point) were purchased from Charles River Laboratories (Wilmington, MA). All experimental procedures were approved by the Animal Care and Use Committee (ACUC) of the NIH Division of Veterinary Resources (DVR).
Cell Lines
SH-SY5Y
Human neuroblastoma cells (ATCC CRL-2266) were maintained in Dulbecco’s Modified Eagle Medium (DMEM + GlutaMAX, 4.5 g/L D-glucose, 110 mg/L sodium pyruvate; Thermo Fisher Scientific, Waltham, MA) supplemented with 10 units/mL penicillin, 10 μg/mL streptomycin (Thermo Fisher Scientific), and 10% bovine growth serum (BGS; GE Life Sciences). Cells were grown at 37°C with 5.5% CO2 in a humidified incubator. Cell lines stably expressing Gaussia luciferase SERCaMP reporter variants were generated by lentiviral transduction as previously described (Henderson et al., 2014).
HEK293T
Embryonic kidney cells (ATCC CRL-3216) were maintained in Dulbecco’s Modified Eagle Medium (DMEM, 4.5 g/L D-glucose, Glutamax, 110 mg/L sodium pyruvate; Thermo Fisher Scientific, Waltham, MA) supplemented with 10 units/mL penicillin, 10 μg/mL streptomycin (Thermo Fisher Scientific).
INS-1 832/13
Rat insulinoma cell line INS-1 832/13 pTetR TO shWfs1 cells were generated as previously described (Abreu et al., 2020). Cells were cultured in RPMI-1640 medium (Thermo #11875) supplemented with 10% tetracycline screened fetal bovine serum (Hyclone SH30070.03), 1 mM sodium pyruvate, 10 U/ml penicillin (Gibco), 10 μg/ml streptomycin (Gibco), and b-mercaptoethanol (1:200,000).
CHO-K1 (DRD2:bArrestin reporter)
Chinese hamster ovary cells (expressing DRD2 long isoform tagged with ProLink and β-Arrestin tagged with Enzyme acceptor) were obtained from DiscoverX (catalog 93-0579). Frozen cells were seeded to assay plates as described below.
Human Skeletal Muscle Cells
Primary human myoblasts (obtained through the National Disease Research Interchange and provided by Drs. Joshua Todd and Katy Meilleur, National Institute of Nursing Research) were cultured in a 37°C humidified incubator with 5.5% CO2 with in DMEM (4.5 g/L D-glucose; Thermo Fisher), 20% FBS (Sigma), 1% penicillin-streptomycin (ThermoFisher Scientific), 5 μg/ml human insulin (Sigma), 25 ng/ml human fibroblast growth factor (Peprotech) on dishes pre-coated with extracellular matrix (ABMGood, #G422).
METHOD DETAILS
qHTS primary screen (SERCaMP) and counterscreens
SH-SY5Y human neuroblastoma cells stably expressing GLuc-SERCaMP (SH-SY5Y-GLuc-SERCaMP) cells were seeded at 1,000 cells per well (5 μl volume) in 1,536 well white tissue culture treated plates (Corning, Cat #7464) in DMEM-high glucose-sodium pyruvate (ThermoFisher Scientific, Cat #10569) supplemented with 10% bovine growth serum (Hyclone), 10 U/ml penicillin (Gibco), 10 μg/ml streptomycin (Gibco), and 20 mM HEPES. Cells were incubated for 5 h at 37°C in a humidified incubator containing 5% CO2. qHTS libraries (23 nl, final concentrations of 1.53 μM, 7.67 μM, 38.3 μM) or controls (neutral control: DMSO, positive control: dantrolene) were added using a Kalypsis pin-tool. Cells were incubated for 16 h (37°C, 5% CO2) and thapsigargin was added at 100 nM to deplete ER calcium stores. Cells were incubated for 4 h (37°C, 5% CO2) and Gaussia luciferase in the medium was measured by adding 1 μl of 0.5x coelenterazine (final concentration 0.07x) prepared in Gaussia Luciferase Glow Assay Buffer (Pierce), without addition of the Cell Lysis Buffer Reagent. Luminescence was measured using a ViewLux high-throughput CCD imaging system (Perkin Elmer) equipped with clear filters. Compounds exhibiting inhibitory activity (defined as curve class −1.1, −1.2, −1.3, −1.4, −2.1, −2.2, −2.3, −2.4, −3) were identified by normalizing plate-wise to corresponding intra-plate controls (neutral control = Tg only; positive control (100% inhibition) = DMSO vehicle) with percent activity derived using in-house software (https://tripod.nih.gov/curvefit). The same controls were also used for the calculation of the Z’ factor, a measure of assay quality control, as previously described (Zhang et al., 1999). For the initial validation of activity in the SERCaMP assays, hits from the primary screen were assayed again at 11-concentrations (1.3 nM – 76.6 μM). SH-SY5Y-GLuc-SERCaMP cells were assayed for ER Ca2+ depletion as outlined above. All screening results are publicly available at PubChem [DEPOSITION OF DATA IS IN PROGRESS AND WILL BE COMPLETE WITH PUBLICATION].
SERCaMP assay (96 well format)
SH-SY5Y-GLuc-SERCaMP cells were cultured in a 37°C humidified incubator with 5.5% CO2 in DMEM (4.5 g/L D-glucose, 110 mg/L sodium pyruvate) containing 2 mM GlutaMAX, 10% bovine growth serum (Hyclone), 10 U/ml penicillin (Gibco), and 10 μg/ml streptomycin (Gibco). Cells were plated at 5 × 10⁴ cells per well (100 μl volume), returned to the incubator for 5 h for attachment, and treated with compounds (or DMSO control). Compound-treated cells were incubated for 16 h (standard SERCaMP screening assay) or 0.5 h (acute ER Ca2+ protocol) prior to adding 100 nM thapsigargin (Sigma). After thapsigargin treatment, 5 μl of medium was collected for enzymatic assay as previously described (Henderson et al., 2015b). Briefly, 5 μl medium was transferred to an opaque walled plate, 100 μl of 8 μM coelenterazine (diluted in 1x PBS) was injected using a BioTek Synergy II Plate reader equipped with injection, and luminescence was measured. For the testing drug efficacy relative to timing of Tg (30 min pre-Tg to 4 h post-Tg) SH-SY5Y-GLuc-SERCaMP cells were plated and incubated for 48 h before being treated with 200 nM thapsigargin. All drugs were given at indicated time relative to Tg at 30 μM final concentration. 5 μl of cell culture media was collected immediately before adding thapsigargin as well as 8 h after thapsigargin addition and assayed as described above.
Oxygen-glucose deprivation (OGD)
SH-SY5Y-Gluc-SERCaMP were seeded at 5 × 10⁴ cells per well in 96 well plates (100 μl volume). Cells were maintained in a humidified incubator at 37°C with 5.5% CO2 in DMEM (4.5 g/L D-glucose) + 110 mg/L sodium pyruvate + 10% fetal bovine serum + 10 U/ml penicillin, + 10 μg/ml streptomycin. Cells were incubated for 24 h before beginning the OGD procedure. For plates subjected to OGD, DMEM (10% FBS; without Glucose) was deoxygenated by bubbling a gas mixture containing 5% CO2, 10% H2, 85% N2 air mixture through a glass filter stick (ACE glass, Vineland NJ) for 15 minutes. Compounds were added to the deoxygenated media and immediately added to the plate by complete media exchange. The plates were placed into hypoxia chamber (Billups-Rothenberg, Modular Incubator Chamber) and the air inside the chamber was replaced with a 5% CO2, 10% H2, 85% N2 air mixture to remove oxygen. The hypoxia chamber was returned to the 37°C incubator. After 16 h of oxygen-glucose deprivation, the deoxygenated medium was exchanged with complete growth media and plates were returned to normoxic incubator conditions (reperfusion). Cell viability was measured 24 h post-normoxia using a CellTiter-Glo assay kit (Promega), as outlined below. GLuc-SERCaMP activity was measured in medium collected from the cells, as described above. For normoxia control plates, all medium exchanges occurred concurrently with OGD samples, using standard culture medium and returning the cells to oxygen-containing incubators (ambient air, 5% CO2). For endogenous SERCaMP (esterase) experiments, the reperfusion media exchange consisted of a full media exchange into esterase assay medium (150 mM NaCl, 5 mM KCl, 1 mM MgCl2, 20 mM HEPES, 1 mM CaCl2, and 1.9 g/L glucose) and media was collected 8 h after reperfusion.
Cell viability/ATP assay
Cell viability was measured using the CellTiter-Glo Luminescent Cell Viability Assay (Promega). Briefly, an equal volume of reagent was added to each well. Plates were rotated for 2 min and incubated for 10 min at room temperature. 100 μl of the solution was transferred from clear walled tissue culture plates to opaque walled assay plates, and luminescence was measured using a BioTek Synergy II plate reader (Winooski, VT).
Immunoblots
SH-SY5Y-SERCaMP cells were plated at 7.5 × 10⁵ cells per well (1.5 ml volume) in 12-well plates, returned to incubator for 6 h to adhere, incubated with compounds overnight, and treated with thapsigargin (or vehicle control) for 4 h. Cells were rinsed in PBS and lysed in a modified RIPA buffer containing 50 mM Tris-HCl (pH 7.4), 150 mM NaCl, 1 mM EDTA, 1% Nonidet P-40, and 1× protease inhibitors (Sigma). Plates were rotated for at least 20 minutes at 4°C. Lysates were centrifuged for 10 min at 13,000 × g (4°C) and quantified using a DC assay (Bio-Rad). Equal amounts of total protein were loaded on 4–12% NuPAGE gels with MOPS running buffer (ThermoFisher, Waltham MA). Proteins were transferred to 0.20 μm polyvinylidene fluoride membranes (Life Technologies) and immunoblotted with the primary antibodies diluted in LI-COR blocking reagent (LI-COR Biosciences, Lincoln, NE). Secondary antibodies were IR700 and IR800 (Rockland Immunochemicals, Gilbertsville, PA), and blots were scanned using an Odyssey scanner (LI-COR).
GCaMPer assay
SH-SY5Y cells were seeded in 25 cm2 flasks at 4 × 10⁵ cells per ml (5 ml volume) and allowed to adhere overnight. Cells were transfected with pAAV-EF1a-GCaMPer-10.19 (Addgene #63885) (Henderson et al., 2015a), using 6 μg plasmid DNA and 10 μl of Lipofectamine 2000. After 48 h, cells were detached using trypsin and re-seeded in 96 well plates at 5 × 10⁴ cells per well (100 μl volume) in DMEM (4.5 g/L D-glucose, 110 mg/L sodium pyruvate) + 2mM GlutaMAX, 10% bovine growth serum, 10 U/ml penicillin, and 10 μg/ml streptomycin. After overnight incubation, cells were rinsed with 150 μl imaging medium (150 mM NaCl, 20 mM HEPES, 5 mM KCl, 1 mM MgCl2, 1 mM CaCl2, 1.9 g/L D-glucose, 1.9 g/L bovine serum albumin, pH 7.4). 90 μl of fresh imaging medium was added and cells were allowed to equilibrate for 1 h at room temperature. Pre-treatment images were captured on a Nikon EclipseTE2000-E inverted microscope equipped with a Nikon 20x (0.45 NA) Plan Fluor objective and an Andor iXon3 high sensitivity EMCCD camera (Andor Technology, Belfast, UK). Multi-point x-y-z coordinates were set using a Prior Proscan III motorized stage (Prior Scientific, Rockland, MA). To account for Z-drift, images were captured in five Z-planes (10 micron below initial plane to 10 microns above) with the Elements AR software used to determine the in-focus plane for collection. For fluorescence quantitation, individual cells were selected using ImageJ software. Background-subtracted fluorescence intensity was measured at each timepoint (to derive Ft). Relative fluorescence (Ft/F0) was calculated as a ratio relative to fluorescence at timepoint zero.
UPRE luciferase reporter assay
SH-SY5Y cells were plated in 25 cm2 flasks at 1.75 × 10⁵ cells (5 ml volume) and incubated overnight. Cells were transfected with 5 μg of pAAV-5xUPRE-secNanoLuc or pAAV-minimal promoter(cfos)-secNanoLuc (Wires et al., 2017) and 10 μl lipofectamine 2000 diluted in Opti-MEM Reduced Serum Media (ThermoFisher). After 3 h of incubation, the transfection media was replaced with 5 ml complete cell culture media and cells were incubated for 48 h. Cells were then trypsinized, counted, and re-plated to 96-well plates at 5.0×10⁴ cells per well (100 μL volume). After allowing to adhere for 4 h cells were treated with compound and incubated at 37C overnight. Cells were then treated with 100 nM thapsigargin (or vehicle control) and returned to the incubator for 16 h. 5 μL of culture medium was transferred to an opaque 96-well plate and 100 uL of furimazine (Promega) substrate (prepared according to the manufacturer’s protocol and then diluted 20-fold in 1x PBS) was injected to each well and luminescence recorded using a BioTek Synergy II plate reader (BioTek).
ER stress response transcriptional analysis
Total RNA was isolated from cells maintained on 24-well (plating density 2.5×10⁵ SH-SY5Y cells/500μl) or 12-well (plating density 5 × 10⁵ INS-1 832/13 cells/2 ml) plates using NucleoSpin RNA kit (Takara), including an on-column DNA digest treatment. RNA (0.5 μg) was reversed transcribed using iScript cDNA synthesis kit (Bio-Rad), and diluted 1:20 with nuclease-free water. 5 μl of cDNA were applied onto 96-well opaque PCR plates (Bio-Rad) together with TaqMan Universal PCR Master Mix (Thermo Fisher), 450 nM primers and 100 nM probe to a final reaction volume of 20 μl. Real time qPCR was performed with C1000 Thermal Cycler CFX96 Real-Time System (Bio-Rad) using following template: pre-incubation approximately 9 min (50°C for 10 s followed by photobleach, repeat 20x, 95°C for 5 min), and amplification with 50 repeats (94°C for 20 s, 60°C for 1 min). Results were quantified using the Bio-Rad CFX Manager software with Cq values determined using the single threshold mode. All Cq values were normalized to the geometric mean of the Cq for the reference genes ubiquitin-conjugating enzyme 2i (Ube2i) and RNA polymerase II (PRNAII) (delta Cq), and results are presented as the 2−ddCq value ± upper and lower limits (limits calculated based on the standard deviation of delta Cq values). Following sequences were used for target amplification and detection: human ASNS, ggattggctgccttttatcagg (forward), ggcttctttcagctgcttcaac (reverse), tggactccagcttggttgctgcc (FAM-labeled probe); human BiP, gttgtggccactaatggagatac (forward), ggagtttctgcacagctctattg (reverse), acgctggtcaaagtcttctccaccca (FAM-labeled probe); human ERdj4, gccatgaagtaccaccctg (forward), ccactagtaaaagcactgtgtc (reverse), ctgcaatctctctgaattttgcttcagc (FAM-labeled probe); human PRNAII, gcaccacgtccaatgacattg (forward), ggagccatcaaaggagatgac (reverse), acggcttcaatgcccagcaccg (HEX-labeled probe); human Ube2i, gtgtgcctgtccatcttagag (forward), gctgggtcttggatatttggttc (reverse), caaggactggaggccagccatcac (HEX-labeled probe); rat ASNS, ggattggctgccttttatcagg (forward), ctccttgagttgcttcagcag (reverse), tggactccagcttggttgctgcc (FAM-labeled probe); rat BiP, agtggtggccactaatggagac (forward), ggagtttctgcacagctctgttg (reverse), cccgctgatcaaagtcttccccacccag (FAM-labeled probe); rat ERdj4, gccatgaagtaccaccctg (forward), ccattagtaaaagcactgtgtcc (reverse), ctgcaatctctctgaattttgcttcagc (FAM-labeled probe); rat PRNAII, tagtcctacctactccccaacttc (forward), agtagccaggagaagtgggag (reverse), actcgcccaccagtcccacctact (HEX-labeled probe); rat Ube2i, gccaccactgtttcatccaaa (forward), gccgccagtccttgtcttc (reverse), cgtgtatccttctggcacagtgtgc (HEX-labeled probe) (Integrated DNA Technologies, Coralville, IA).
SERCaMP library
A SERCaMP library was created by fusing the last seven amino acids from human proteins to the C-terminus of GLuc with a MANF N-terminal signal peptide as previously described (Trychta et al., 2018a). Inclusion criteria followed those set out by Raykhel et al. (Raykhel et al., 2007) in which only soluble proteins with a signal peptide and a putative ER retention motif defined as XX[DE][FLM] were considered. Custom oligonucleotides coding for each seven amino acid carboxy-terminal tail (synthesized by Integrated DNA Technologies) were annealed to form a duplex and then inserted into a pLenti6.3-CMV-MANF sigpep-GLuc-MCS plasmid using Ligate-IT (Affymetrix) according to the manufacturer’s protocol. The ER retention motifs used in this paper are detailed in Table S2.
Expression of GLuc-SERCaMPs in SH-SY5Y was achieved via reverse transfection using X-fect (Clontech). Briefly, transfection complexes containing 200 ng of plasmid DNA and 0.06 μL of X-fect in a final volume of 10 μL were added to opaque TC-treated 96-well plates. 5 × 10⁴ cells in 90 μL of antibiotic-free cell culture media were plated on top of the transfection complexes. In the OGD paradigm, cells were incubated for 48 h before beginning the OGD procedure as described above. At the conclusion of the experiment, both cell culture media and cell lysates were collected and assayed for GLuc. 5 μL of media was collected into an opaque walled plate and assayed as described above. Cell lysates were collected following the complete removal of cell culture media and a rinse with 1x PBS (Gibco) at which point 75 μL of lysis buffer (50 mM Tris (pH 7.5), 150 mM NaCl, 1% NP40, and 1x protease inhibitor cocktail (Sigma)) was added to the well. Cells were lysed in and GLuc was assayed from the original culture plate. Secretion index refers to the ratio of extracellular GLuc to intracellular GLuc.
Wolfram caspase 3/7 assay
INS-1 832/13 pTetR TO shWfs1 cells were seeded to 1536-well plates, allowed to adhere overnight then treated with 2 μg/mL doxycycline (Clontech) or vehicle control. After 48 h, 5 μL of Caspase-Glo 3/7 reagent was added to each well, the plate was incubated at room temperature for 30 min and luminescence was measured using a ViewLux microplate imager.
Human skeletal muscle exodosis assay
Primary human myoblasts were plated in 96 well plates pre-coated with 3 mg/ml Matrigel (Corning) at 7.3×10³cells/well. One day post-plating, myoblasts were differentiated in DMEM (4.5 g/L D-glucose), 5% horse serum (Thermo Fisher), 1% penicillin-streptomycin, and 5μg/mL human insulin for 72 h. Myotubes were transduced with AAV-GLuc-SERCaMP (1.45×10⁸ vg/well) in growth media. 48 h post-transduction myotubes were pre-treated with bromocriptine, dantrolene, dextromethorphan, verapamil, diltiazem or vehicle for 30 mins prior to the addition of 100nM of thapsigargin. Media was collected 4–8 h post-thapsigargin.
Monitoring endogenous SERCaMPs (esterase, MANF and PDI)
SH-SY5Y cells were plated with 5 × 10⁴ cells/well in a 96-well (esterase assay) or 6.3 × 10⁵ cells/well in a 12-well plate (MANF and PDI). A full media exchange into growth media containing 1.5% BGS was performed 28 h after plating. 200 nM of thapsigargin was added 16 h after the full media exchange. Bromocriptine (20 μM) was added either 30 min prior to thapsigargin addition or 1 h after. Bromocriptine/vehicle treatments were done as pre-treatments with bromocriptine being added 30 min prior to treatment with vehicle. Cell culture media was collected 8 h after the addition of Tg. Collected media samples were centrifuged at 4°C for 5 min at 1000x g and stored at −80°C until the time of use. Secreted Esterase assay: For esterase assays, at the time of drug treatment a full media exchange was performed into esterase assay medium (150 mM NaCl, 5 mM KCl, 1 mM MgCl2, 20 mM HEPES, 1 mM CaCl2, and 1.9 g/L glucose). Esterase activity was measured by fluorescence generated from fluorescein di-(1-methylcyclopropanecarboxymethyl ether) and quantified by BioTek Synergy H2 plate reader (Excitation 465 nm/Emission 528 nm) as previously described (Trychta et al., 2018b). Briefly, 50 μL of cell culture medium was transferred to a black walled clear bottomed plate (Perkin Elmer). 50 μL of 100 μM esterase substrate (pH 5) was added to each well and fluorescence was measured 1 h after substrate addition. For all esterase measurements cells were maintained in phenol red-free and serum-free media for 8 h prior to media collection. Secreted MANF HTRF assay: The concentration of MANF in cell culture media samples was determined using a MANF HTRF assay according to the manufacturer’s instructions (Cisbio). Briefly, media samples were diluted 1:2 in the provided dilution buffer. 16 μL of media sample, 2 μL of anti-Human MANF-d2 antibody, and 2 μL of anti-Human-Eu3+ cryptate antibody were incubated together in a white plate for 24 h before fluorescence was measured at 665 nm and 620 nm. Sample readouts were compared to a MANF standard curve to determine the amount of MANF in each sample. Secreted PDI assay: Magnetic Protein A beads (SureBeads, Bio-Rad) were washed with PBS + 0.1% Tween (PBS-T) then incubated with PDI antibody (Abcam Cat. ab2792) diluted 1:100 in PBS-T for 10 min at room temperature. Beads were washed with PBS-T then incubated with 400 μL of media for 1 h at room temperature. Beads were washed for a final time with PBS-T and then samples were eluted using 40 μL of 1x LDS (Thermo Fisher Scientific) and incubation at 70°C for 10 min. Equal volumes of samples were run on 4%−12% Bis-Tris NuPage gels (Thermo Fisher Scientific) using MOPS running buffer (Thermo Fisher Scientific). Proteins were transferred to 0.45 μm PVDF membranes (Thermo Fisher Scientific) and immunoblotted with PDI antibody (Abcam Cat. ab2792). Blots were scanned using an Odyssey scanner.
In vivo distal middle cerebral artery occlusion (MCAO)
Animal surgeries were done in accordance with the animal care guidelines of the “Principles of Laboratory Care” (National Institutes of Health publication No. 86-23, 1996) and were approved by the National Health Research Institutes (Taiwan) Animal Care and Use Committee (Protocol No. 105079‐A; 105080). Adult male Sprague-Dawley rats were subjected to right middle cerebral artery occlusion (MCAo) as described previously (Airavaara et al., 2010). Animals were anesthetized with an intraperitoneal injection of chloral hydrate (0.4 g/kg). Fifteen minutes prior to MCAo, rats were given 20 uL of vehicle, bromocriptine or bromocriptine analogs intracerebroventricularly, contralateral to the ischemic hemisphere. The speed of the injection was 2.5 μL/min and was controlled by a syringe pump. The needle was retained in place for 5 min following the injection. The right middle cerebral artery (MCA) was ligated with a 10–0 suture, and bilateral common carotid arteries were ligated with arterial clamps for 60 min. After 60 min of ischemia, the suture around the MCA and arterial clips were removed. After recovery from anesthesia, the rats were returned to their home cage. Core body temperature was maintained at 37°C throughout the procedure and during anesthesia recovery.
Triphenyltetrazolium chloride (TTC) staining
Two days after MCAO, animals were culled by decapitation. The brains were removed, immersed in cold saline for 5 min, and sliced into 2.0 mm thick sections. The brain slices were incubated in 2% triphenyltetrazolium chloride (Sigma), dissolved in normal saline for 10 min at room temperature, and then transferred into a 5% formaldehyde solution for fixation. The area of infarction on each brain slice was measured double blind using a digital scanner and the Image Tools program (University of Texas Health Sciences Center).
Behavioral Assay
Two days after MCAO body asymmetry was analyzed using an elevated body asymmetry test.(Borlongan et al., 1998) Rats were examined for lateral movement/turning while their bodies were suspended by their tail 20 cm above the testing table. The frequency of initial turning of the head or upper body contralateral to the ischemic side was counted in 20 consecutive trials. The maximum impairment in body asymmetry is 20 contralateral turns in 20 trials. Normal body asymmetry is 10 contralateral turns in 20 trials (animals turn in either direction with equal frequency).
Pharmacokinetics of bromocriptine, analog 686 and analog 688
Adult male CD-1 mice (n=3/sampling time point) were purchased from Charles Reviver Laboratories (Wilmington, MA). All experimental procedures were approved by the Animal Care and Use Committee (ACUC) of the NIH Division of Veterinary Resources (DVR).
A single dose of 2 mg/kg intravenous (IV) and 30 mg/kg intraperitoneal administration was conducted for all three compounds. Dosing solutions were freshly prepared on the day of administration in 20% PEG300/H2O. The blood samples were collected in K2EDTA tubes and plasma was harvested after centrifugation at 2200×g at 5°C for 10 min. Brain, liver and pancreas samples were flash frozen in liquid nitrogen in pre-weighed vials and transferred to 48-well plates. All plasma and tissue samples were stored at −80°C until analysis.
Ultra-performance liquid chromatography-tandem mass spectrometry (UPLC-MS/MS) methods were developed to determine test compounds’ concentrations in mouse plasma and tissue samples. Mass spectrometric analysis was performed on a Waters Xevo TQ-S triple quadrupole instrument using electrospray ionization in positive mode with the selected reaction monitoring. The separation of test compounds from endogenous components was performed on an Acquity BEH C18 column (50 × 2.1 mm, 1.7 μ) using a Waters Acquity UPLC system with 0.6 mL/min flow rate and gradient elution. The mobile phases were 0.1% formic acid in water and 0.1% formic acid in acetonitrile. The calibration standards and quality control samples were prepared in the blank mouse plasma and tissue homogenate. Aliquots of 10 μL plasma samples or tissue homogenate were mixed with 200 μL internal standard in acetonitrile to precipitate proteins in a 96-well plate. 0.1–1.0 μL supernatant was injected for the UPLC-MS/MS analysis of different biological matrices. Data were analyzed using MassLynx V4.1 (Waters Corp., Milford, MA).
The pharmacokinetic (PK) parameters were calculated using the non-compartmental approach of the PK software Phoenix WinNonlin, version 6.2 (Certara, St. Louis, MO). The area under the plasma concentration versus time curve (AUC) was calculated using the linear trapezoidal method. The slope of the apparent terminal phase was estimated by log linear regression using at least 3 data points and the terminal rate constant (k) was derived from the slope. AUC0-inf was estimated as the sum of the AUC0-t (where t is the time of the last measurable concentration) and Ct/k. The apparent terminal half-life (t½) was calculated as 0.693/k. The plasma clearance (CLp) and volume of distribution at steady-state (Vdss) was calculated after IV administration.
Metabolic testing in Diet Induced Obese (DIO) mice
C57Bl/6J male mice were obtained from Jackson Laboratories (Bar Harbor, ME) and were fed high fat diet (D12492, 60% fat, Research Diets Inc) for 8 weeks. Three weeks prior to the initiation of treatment mice were singly housed and randomized into 3 groups (10 mice/group): vehicle control (20% PEG300 in water), bromocriptine mesylate (BOS Sciences, Shirley, NY, CAS No.: 22260-51-1, 12 mg/kg), and bromocriptine analog 688 (NCATS, NCGC00537688–02, 12 mg/kg). Note that one mouse was excluded from analog 688 group (n=9) based on Grubbs’ outlier test in multiple endpoints. The dosing solutions were prepared fresh daily and were administered intraperitoneally at the end of the light cycle (17:00). Body weight, body composition, and food intake were measured weekly. Body composition was measured by time domain Echo MRI 3-in-1 (Echo Medical Systems, Houston, TX). Energy expenditure was calculated from the metabolizable caloric intake, corrected for the change in caloric content of the mouse (from the change in body composition over the measurement interval) (Ravussin et al., 2013). Blood samples were collected once a week from the tail vein in randomly fed state for measuring blood glucose and serum parameters. Intraperitoneal glucose (1 g/kg, with AUC calculated from 0 mg/dl) tolerance tests were performed at 09:00, following an overnight (16 h) fast. Glucose was measured with a Glucometer Contour (Bayer, Mishawaka, IN). Insulin resistance index was calculated using homeostasis model assessment HOMA-IR= [fasting insulin (mIU/L)*fasting glucose (mg/dl)]/405. Free fatty acids (FFA, Roche Diagnostics GmbH, Mannheim, Germany), triglycerides (Pointe Scientific Inc., Canton, MI), and cholesterol (Thermo Scientific, Middletown, VA) were measured using the indicated colorimetric assays. Insulin was measured by ELISA (Crystal Chem, Downers Grove, IL). Data presented are from 3 weeks of drug treatment. All animal studies related to high fat diet were carried out according to the US National Institutes of Health Guidelines for Animal Research and were approved by the NIDDK Institutional Animal Care and Use Committee. We complied with all relevant ethical regulations for animal testing and research.
Bromocriptine analogs chemistry
General Methods for Chemistry. All air or moisture sensitive reactions were performed under positive pressure of nitrogen with oven-dried glassware. Chemical reagents and anhydrous solvents were obtained from commercial sources and used as-is. Analytical analysis for purity was determined by two different methods denoted as Final QC Methods 1 and 2. Method 1: Analysis was performed on an Agilent 1290 Infinity Series HPLC. UHPLC Long Gradient Equivalent 4% to 100% acetonitrile (0.05% trifluoroacetic acid) in water over 3 minutes run time of 4.5 minutes with a flow rate of 0.8 mL/min. A Phenomenex Luna C18 column (3 micron, 3 × 75 mm) was used at a temperature of 50 °C. Method 2: analysis was performed on an Agilent 1260 with a 7 minute gradient of 4% to 100% acetonitrile (containing 0.025% trifluoroacetic acid) in water (containing 0.05% trifluoroacetic acid) over 8 minute run time at a flow rate of 1 mL/min. A Phenomenex Luna C18 column (3 micron, 3 × 75 mm) was used at a temperature of 50 °C. Purity determination was performed using an Agilent Diode Array Detector for both Method 1 and Method 2. Mass determination was performed using an Agilent 6130 mass spectrometer with electrospray ionization in the positive mode. All of the analogs for assay have purity greater than 95% based on both analytical methods. 1H NMR spectra were recorded on Varian 400 MHz spectrometers. High resolution mass spectrometry was recorded on Agilent 6210 Time-of-Flight LC/MS system.
Synthesis of (6aR,9R)-5-bromo-4-(cyclopropanecarbonyl)-N-((2R,5S,10aS,10bS)-10b-hydroxy-5-isobutyl-2-isopropyl-3,6-dioxooctahydro-8H-oxazolo[3,2-a]pyrrolo[2,1-c]pyrazin-2-yl)-7-methyl-4,6,6a,7,8,9-hexahydroindolo[4,3-fg]quinoline-9-carboxamide, HCl (analog 686). To a suspension of (6aR,9R)-5-bromo-N-((2R,5S,10aS,10bS)-10b-hydroxy-5-isobutyl-2-isopropyl-3,6-dioxooctahydro-8H-oxazolo[3,2-a]pyrrolo[2,1-c]pyrazin-2-yl)-7-methyl 4,6,6a,7,8,9-hexahydroindolo[4,3-fg]quinoline-9-carboxamide, mesylate (0.75 g, 1.0 mmol) in CH2Cl2 (12 ml) was added Et3N (0.56 ml, 4.0 mmol) and then cyclopropanecarbonyl chloride (0.21 g, 2.0 mmol). The mixture was stirred at room temperature for 3 hr. To the mixture was added H2O (10 mL) and the aqueous layer was extracted with CH2Cl2 (5 mL × 2). The combined organic layer was dried (Na2SO4) and filtered. After removal of solvent, the product was purified by silica gel chromatography using 0–100 EtOAc/hexane as the eluent to give (6aR,9R)-5-bromo-4-(cyclopropanecarbonyl)-N-((2R,5S,10aS,10bS)-10b-hydroxy-5-isobutyl-2-isopropyl-3,6-dioxooctahydro-8H-oxazolo[3,2-a]pyrrolo[2,1-c]pyrazin-2-yl)-7-methyl-4,6,6a,7,8,9-hexahydroindolo[4,3-fg]quinoline-9-carboxamide (a free base of analog 686, 372 mg, 0.52 mmol, 51.5 % yield; LC-MS (Method 1): tR = 3.10 min, m/z (M+H)+ = 722 and 724). This material (372 mg, 0.52 mmol) was then dissolved in 1,4-dioxane (6 ml) and HCl (4 M in 1,4-dioxane, 1.03 mmol, 257 ul, 2 equiv) was added. The mixture was stirred at room temperature for 5 min and hexane (15 mL) was added. The solid was filtered, washed with hexane (5 mL × 2), and then dried to give (6aR,9R)-5-bromo-4-(cyclopropanecarbonyl)-N-((2R,5S,10aS,10bS)-10b-hydroxy-5-isobutyl-2-isopropyl-3,6-dioxooctahydro-8H-oxazolo[3,2-a]pyrrolo[2,1-c]pyrazin-2-yl)-7-methyl-4,6,6a,7,8,9-hexahydroindolo[4,3-fg]quinoline-9-carboxamide, HCl (analog 686, 339 mg, 0.45 mmol, 87 % yield) as a HCl salt. 1H NMR (400 MHz, DMSO-d6) δ 11.65 (s, 1H), 9.58 (s, 1H), 7.83 (d, J = 8.2 Hz, 1H), 7.38 (t, J = 7.9 Hz, 1H), 7.27 (d, J = 7.6 Hz, 1H), 7.16 (s, 1H), 6.45 (s, 1H), 4.40 (br s, 1H), 4.32 (t, J = 6.7 Hz, 1H), 4.21 (br s, 1H), 3.81–3.69 (m, 2H), 3.61 – 3.26 (m, 4H), 3.15 – 2.97 (m, 4H), 2.68 – 2.54 (m, 1H), 2.24 – 1.54 (m, 8H), 1.27 –1.21 (m, 4H), 1.05 (d, J = 6.7 Hz, 3H), 0.91 (d, J = 6.7 Hz, 3H), 0.89 (d, J = 6.7 Hz, 3H), 0.77 (d, J = 6.7 Hz, 3H); LC-MS (Method 2): tR = 4.89 min, m/z (M+H)+ = 722 and 724; HRMS calculated for C36H45BrN5O6 (M+H)+ : 722.2548 and 724.2534, found: 722.2569 and 724.2557.
Synthesis of (6aR,9R)-5-bromo-N4-cyclopropyl-N9-((2R,5S,10aS,10bS)-10b-hydroxy-5-isobutyl-2-isopropyl-3,6-dioxooctahydro-8H-oxazolo[3,2-a]pyrrolo[2,1-c]pyrazin-2-yl)-7-methyl-6a,7,8,9-tetrahydroindolo[4,3-fg]quinoline-4,9(6H)-dicarboxamide, HCl (analog 688). To a suspension of (6aR,9R)-5-bromo-N-((2R,5S,10aS,10bS)-10b-hydroxy-5-isobutyl-2-isopropyl-3,6-dioxooctahydro-8H-oxazolo[3,2-a]pyrrolo[2,1-c]pyrazin-2-yl)-7-methyl-4,6,6a,7,8,9-hexahydroindolo[4,3-fg]quinoline-9-carboxamide, Mesylate (998 mg, 1.33 mmol) in CH2Cl2 (6 ml) was added Et3N (0.28 ml, 2.0 mmol) and then isocyanatocyclopropane (332 mg, 4.0 mmol). The mixture was stirred at rt for 6 hr. The mixture was then concentrated and then purified by silica gel chromatography using 0–100 EtOAc/hexane as the eluent to give (6aR,9R)-5-bromo-N4-cyclopropyl-N9-((2R,5S,10aS,10bS)-10b-hydroxy-5-isobutyl-2-isopropyl-3,6-dioxooctahydro-8H-oxazolo[3,2-a]pyrrolo[2,1-c]pyrazin-2-yl)-7-methyl-6a,7,8,9-tetrahydroindolo[4,3-fg]quinoline-4,9(6H)-dicarboxamide (a free base of analog 688, 566 mg, 0.77 mmol, 57.7 % yield; LC-MS (Method 1): tR = 2.88 min, m/z (M+H)+ = 737 and 739). This material (566 mg, 0.767 mmol) was then dissolved in 1,4-dioxane (6 ml) and HCl (4 M in 1,4-dioxane, 2.3 mmol, 575 ul, 3 equiv) was added. The mixture was stirred at rt for 5 min and hexane (15 mL) was added slowly. The solid was stirred for another 5 min and filtered. The solid was washed with hexane (5 mL × 2) and then dried in vacuo to give (6aR,9R)-5-bromo-N4-cyclopropyl-N9-((2R,5S,10aS,10bS)-10b-hydroxy-5-isobutyl-2-isopropyl-3,6-dioxooctahydro-8H-oxazolo[3,2-a]pyrrolo[2,1-c]pyrazin-2-yl)-7-methyl-6a,7,8,9-tetrahydroindolo[4,3-fg]quinoline-4,9(6H)-dicarboxamide, HCl (analog 688, 546 mg, 0.71 mmol, 92 % yield) as a HCl salt. 1H NMR (400 MHz, DMSO-d6) δ 11.70 (s, 1H), 9.58 (s, 1H), 8.72 (d, J = 3.5 Hz, 1H), 7.38 (d, J = 8.2 Hz, 1H), 7.29 (t, J = 7.8 Hz, 1H), 7.17 (s, 1H), 7.16 (d, J = 8.0 Hz, 1H), 6.42 (s, 1H), 4.43 – 4.34 (m, 1H), 4.32 (dd, J = 7.8, 5.6 Hz, 1H), 4.22 (br s, 1H), 3.77–3.70 (m, 2H), 3.51 – 3.27 (m, 4H), 3.16 – 2.98 (m, 4H), 2.84–2.80 (m, 1H), 2.22 – 1.53 (m, 8H), 1.04 (d, J = 6.7 Hz, 3H), 0.91 (d, J = 6.8 Hz, 3H), 0.88 (d, J = 6.6 Hz, 3H), 0.78–0.73 (m, 5H), 0.63 (t, J = 3.5 Hz, 2H); LC-MS (Method 2): tR = 4.49 min, m/z (M+H)+ = 737 and 739; HRMS calculated for C36H46BrN6O6 (M+H)+ : 737.2657 and 739.2644, found: 737.2677 and 739.2665.
Dopamine receptor BRET assays
Bioluminescence Resonance Energy Transfer (BRET) based dopamine receptor G protein engagement assays were conducted as previously published (Bonifazi et al., 2017; Bonifazi et al., 2019). G protein engagement assay uses Renilla luciferase-fused dopamine receptor and mVenus-fused Gα, specifically D1R-Rluc Gs-mVenus, D2R-Rluc Gi1-mVenus, D3R-Rluc Gi1-mVenus, D4R-Rluc Gi1-mVenus, and D5R-Rluc Gs-mVenus for each pair. Transfected HEK293T cells were harvested, washed, and resuspended in PBS. Approximately 200,000 cells/well were distributed in 96-well plates, and 5 μM coelenterazine H (substrate for BRET) was added to each well. The BRET signal was determined as the ratio of the light emitted by mVenus (520–550nm) over RLuc (460–490nm) in Pherastar FSX (BMG Labtech). Results are calculated for the BRET change (BRET ratio for the corresponding drug minus BRET ratio in the absence of the drug). In parallel, the fluorescence of the acceptor was quantified with excitation at 485 nm and emission at 520 nm for 1sec recording to confirm the constant expression levels across experiments.
D2 Arrestin assay
CHO-K1 cells expressing DRD2 (long isoform) tagged with a ProLink sequence and β-arrestin fused to the Enzyme Activator protein (DiscoveRx) were seeded in 1536-well plates at 2000 cells per well, 3 μL volume of assay medium. Plates were covered with a Breathe-Easy sealing film and incubated in a 37 °C incubator (5% CO2, 95% RH) overnight. Compounds were pin-transferred and returned to the 37 °C incubator for 90 min. 1.5 μL of detection reagent was added to each well and the plate was incubated at room temperature for 60 min. Luminescence was detected on a ViewLux microplate imager, equipped with clear filters.
QUANTIFICATION AND STATISTICAL ANALYSIS
As described in figure legends, the statistical analyses were performed using the two-tailed unpaired Student’s t-test, One-way ANOVA with post-hoc Dunnett’s multiple comparison test, Two-way ANOVA with post-hoc Sidak or Tukey multiple comparisons test using GraphPad Prism 8 (GraphPad Software). P < 0.05 was considered statistically significant. P value ranges are indicated by asterisks in figure legends. Experiments were repeated independently multiple times and similar results were obtained. The mean and error are noted for each data set.
Supplementary Material
Table S2: Seven amino acid ERS tails that correspond to the C-terminus of a human ER luminal protein and were appended to Gaussia luciferase. Related to Figure 5.
Table S1: High-throughput screening results. Related to Figure 1.
Table S3: Activity of Analog 688 on GPCRs examined in the NIMH Psychoactive Drug Screening Program GPCRome assay. Related to Figure 6.
Table S4: Pharmacokinetics of bromocriptine and analogs in mouse. Related to Figure 7.
Table S5: Metabolomic parameters from diet-induced obesity study. Related to Figure 7.
Table S6: Nucleotide sequences for all primers and hydrolysis probes. Related to Figure 3.
KEY RESOURCES TABLE
| REAGENT or RESOURCE | SOURCE | IDENTIFIER |
|---|---|---|
| Antibodies | ||
| rabbit anti-BiP | Cell Signaling | Cat#3177S; RRID:AB_2119845 |
| mouse anti-actin | Abcam | Cat#ab8226; RRID:AB 306371 |
| mouse anti-PDI [RL90] | Abcam | Cat#2792; RRID:AB_303304 |
| goat anti-rabbit IR800 | Rockland | Cat#611-132-122; RRID:AB_220152 |
| goat anti-mouse IR700 | Rockland | Cat#610-130-121; RRID:AB_220121 |
| Bacterial and Virus Strains | ||
| AAV-GLuc-SERCaMP | Henderson et al., 2014 | N/A |
| Biological Samples | ||
| TTC stained Sprague dawley brain sections | This paper | N/A |
| C57Bl/6J tail vein blood samples | This paper | N/A |
| CD-1 blood samples | This paper | N/A |
| Chemicals, Peptides, and Recombinant Proteins | ||
| Dulbecco’s Modified Eagle Medium (1X) + GlutaMAX-I | Thermo Fisher Scientific | Cat#10569-010 |
| Dulbecco’s Modified Eagle Medium (1X), no glucose | Thermo Fisher Scientific | Cat#11966-025 |
| Opti-MEM Reduced Serum medium | Thermo Fisher Scientific | Cat#31985070 |
| Bovine growth serum (BGS) | GE Life Sciences / Hyclone | Cat#SH30541.03 |
| Fetal bovine serum (FBS) | Millipore Sigma | Cat#F6178 |
| Horse serum | Thermo | Cat#16050130 |
| Insulin, human | Millipore Sigma | Cat#I9278 |
| Fibroblast growth factor, human | Peprotech | Cat#100-18B |
| Applied Cell Extracellular matrix | Abmgood | Cat#G422 |
| Penicillin/streptomycin | Thermo Fisher Scientific | Cat#15140-122 |
| 2-mercaptoethanol | Sigma | Cat#M6250 |
| RPMI-1640 | Thermo Fisher Scientific | Cat#61870036 |
| Bovine serum albumin | Sigma | Cat#A9647 |
| Thapsigargin | Sigma | Cat#T9033-1MG |
| Dantrolene | Sigma | Cat# D9175-250MG |
| Bromocriptine (in vitro) | Sigma and Tocris | Cat#B2134, Cat#2260-51-1 |
| Bromocriptine (in vivo) | BOC Sciences | Cat#22260-51-1 |
| Verapamil | Sigma | Cat#V4629 |
| Diltiazem | Sigma | Cat#D9684 |
| Dextromethorphan | Sigma | Cat#D2521 |
| Brefeldin A | Sigma | Cat#B7651-5mg |
| Doxycycline | Sigma | Cat#D9891-1G |
| Blocking buffer | Rockland | Cat#MB-070 |
| Tris-HCl pH 7.4 | Quality Biological | Cat#351-006-101 |
| Sodium deoxycholate | Millipore Sigma | Cat#6750 |
| EDTA | Millipore Sigma | Cat#E7889 |
| NP-40 | Thermo Fisher Scientific | Cat#PI-28324 |
| Tween-20 | Bio-Rad | Cat#1610781EDU |
| Protease inhibitors | Millipore Sigma | Cat#P8340-5ML |
| 4–12% NuPAGE gels | Thermo Fisher Scientific | Cat#NP0329BOX |
| NuPAGE MOPS SDS running buffer | Thermo Fisher Scientific | Cat#NP0001 |
| PDVF membranes, 0.2 μm | Thermo Fisher Scientific | Cat#LC2002 |
| NuPAGE transfer buffer | Thermo Fisher Scientific | Cat#NP0006-1 |
| Coelenterazine | Regis Technologies | Cat#1-361204.200 |
| Furimazine | Promega | Cat#N1120 |
| NuPAGE LDS sample buffer (4x) | Thermo Fisher Scientific | Cat#NP0007 |
| fluorescein di-(1-methylcyclopropanecarboxymethyl ether | Trychta et al., 2018b | N/A |
| Chloral hydrate | Sigma | Cat#C8383 |
| Triphenyltetrazolium chloride | Sigma | Cat#T8877 |
| Paraformaldehyde | Electron Microscopy Sciences | Cat#19210 |
| Critical Commercial Assays | ||
| CaspaseGlo 3/7 assay | Promega | Cat#G8091 |
| DC Protein Assay Kit | Bio-Rad | Cat#5000112 |
| MANF HTRF | Cisbio | Cat#63ADK056PEG |
| CellTiter-Glo Luminescent Cell Viability Assay (ATP assay) | Promega | Cat#G7571 |
| Insulin ELISA | Crystal Chem Inc | Cat#90010 |
| Mouse Insulin Standard | Crystal Chem Inc | Cat#90020 |
| Free-fatty acid assay | Fujifilm Wako Diagnostics | 276-76491, 999-34691, 995-34791, 991-34891, 993-35191 |
| Triglycerides assay | Pointe Scientific | Cat#23-666-410 |
| Total cholesterol assay | Thermo Scientific | Cat#TR13421 |
| Deposited Data | ||
| Protocol Name: Primary qHTS for small molecule stabilizers of the endoplasmic reticulum resident proteome: secreted ER Calcium Modulated Protein (SERCaMP) assay | Pubchem | AID 1508630 |
| Protocol Name: Confirmatory qHTS for small molecule stabilizers of the endoplasmic reticulum resident proteome: secreted ER Calcium Modulated Protein (SERCaMP) assay | Pubchem | AID 1508628 |
| Protocol Name: Cell Viability qHTS for small molecule stabilizers of the endoplasmic reticulum resident proteome | Pubchem | AID 1508629 |
| Protocol Name: Counterscreen qHTS for small molecule stabilizers of the endoplasmic reticulum resident proteome: GLuc-NoTag assay | Pubchem | AID 1508627 |
| Experimental Models: Cell Lines | ||
| SH-SY5Y | Dr. Howard Federoff, University of Rochester, circa 1999 | ATCC® CRL-2266 |
| SH-SY5Y-GLuc-SERCaMP | Henderson et al., 2014 | SERCaMP reporter cell line |
| SH-SY5Y-GLuc | Henderson et al., 2014 | Control cell line |
| HEK293T | ATCC | ATCC® CRL-3216 |
| INS-1 832/13 pTetR TO shWfs1 | Abreu et al. 2020 | Cell Line 832/13 with inducible Wfs1 knockdown |
| CHO-K1 (DRD2:bArrestin reporter) | DiscoverX | Cat#93-0579 |
| Human skeletal muscle cells | Dr. Katy Meilleur and Dr. Joshua Todd, NINR, via National Disease Research Interchange | Primary cells |
| Experimental Models: Organisms/Strains | ||
| Sprague -Dawley, WT | Charles River Laboratories | Strain Code: 400 |
| C56Bl/6J | Jackson Laboratories | Stock: 000664 |
| CD-1 | Charles River Laboratories | Strain Code: 022 |
| Oligonucleotides | ||
| See Table S6 for oligonucleotide sequences nucleotide sequences for all primers and probes (also described in Trychta et al., 2018a) | ||
| Recombinant DNA | ||
| pAAV-EF1a-GCaMPer-10.19 | Henderson et al., 2015a | Addgene #63885 |
| pAAV-5xUPRE-secNanoLuc | Wires et al., 2017 | Addgene #82497 |
| pAAV-minimal promoter(cfos)-secNanoLuc | Wires et al., 2017 | Addgene #82498 |
| pLenti6.3-CMV-SERCaMP (Tails Library) | Trychta et al., 2018a | N/A |
| D1R-Rluc Gs-mVenus | Bonifazi et al., 2019 | N/A |
| D2R-Rluc Gi1-mVenus | Bonifazi et al., 2019 | N/A |
| D3R-Rluc Gi1-mVenus | Bonifazi et al., 2019 | N/A |
| D4R-Rluc Gi1-mVenus | Bonifazi et al., 2019 | N/A |
| D5R-Rluc Gs-mVenus | Bonifazi et al., 2019 | N/A |
| Software and Algorithms | ||
| GraphPad Prism 7 | GraphPad | https://graphpad.com/scientific-software/prism/ |
| Odyssey Infrared Imaging System 3.0.30 | LI-COR Biosciences | https://www.licor.com/bio/products/imaging_systems/odyssey/ |
| qHTS data and curve fitting | NCATS | https://tripod.nih.gov/curvefit |
| Image Tool software | University of Texas Health Sciences Center | |
| MassLynx V4.1 | Waters | N/A |
| Phoenix WinNonlin V6.2 | Certara | N/A |
| Other | ||
| 1536-well tissue culture treated white microplates | Corning | Cat #7464 |
| 96-well tissue culture treated plates | Fisher Scientific | Cat#08-772-2C |
| 12-well tissue culture treated plates | Fisher Scientific | Cat#08-772-29 |
| 384-well black walled plates (esterase assay) | PerkinElmer | Cat#6057300 |
| High-fat chow, 60% fat | Research Diets | Cat#D12492 |
| ViewLux high-throughput imaging system | PerkinElmer | PerkinElmer 1430 |
| Biotek Synergy II microplate reader | Biotek | www.biotek.com |
| Biotek Syndergy H1 microplate reader | Biotek | www.biotek.com |
| Pherastar FSX | BMG Labtech | |
| Breathe Easy microplate sealing film | Diversified Biotech, via Sigma | Cat#Z380059 |
| NucleoSpin RNA kit | Takara | Cat#740955 |
| iScript cDNA synthesis kit | Bio-Rad | Cat#1708891 |
| Taqman Universal PCR Master Mix | Thermo Fisher Scientific | Cat#4305719 |
| Lipofectamine 2000 Transfection Reagent | Thermo Fisher Scientific | Cat#11668019 |
| Protein A SureBeads | BioRad | Cat#1614013 |
| X-fect | Takara | Cat#631318 |
| Acquity BEH C18 column | Waters | Cat#186002350 |
| C1000 Thermal Cycler CFX96 Real-Time System | Bio-Rad | Cat#1855195 |
| Hypoxia chambers | Billups-Rothenberg | Cat#MIC-101 |
Acknowledgements:
This work was funded by the Intramural Research Programs at the National Institute on Drug Abuse (NIDA), National Institute of Diabetes and Digestive and Kidney Diseases (NIDDK) and National Center for Advancing Translational Sciences (NCATS). This work was partly supported by the grants from the National Institutes of Health/NIDDK (DK112921 and DK020579), National Institutes of Health/NCATS (TR002065, TR000448) to F. Urano. We acknowledge the National Disease Research Interchange (NDRI) and Drs. Joshua Todd and Katy Meilleur at the National Institute of Nursing Research (NINR) for primary skeletal muscle cells. We thank Chris Richie, Doug Howard, Lowella Fortuna, Molly Lutrey, Keval Patel, Lacey Kennedy, Jen-Hui Tsou, Elizabeth Cunningham, Matthew Cyr, Carleen Klumpp-Thomas, the NIDA Genetic Engineering and Viral Vector Core and the NCATS Compound Management team for technical assistance. We also thank Yuhong Fang and Dingyin Tao at NCATS for HRMS determination and Cordelle Tanega for depositing the data to PubChem. We thank Amy Newman (NIDA) for providing D2R modulators and Naili Liu and Yinyan Ma (Mouse Metabolism Core, NIDDK) for technical assistance with metabolic studies in DIO mice. We also thank Bryan Roth and Samuel Slocum of the PDSP screening program (University of North Carolina).
Footnotes
Declaration of Interests:
F.U. is an inventor on US 10,441,574, B2 TREATMENT FOR WOLFRAM SYNDROME AND OTHER ER STRESS DISORDERS and US 9,891,231 B2 SOLUBLE MANF IN PANCREATIC BETA CELL DISORDERS. M.J.H., S.Y, D.J.M, F.U., A.J. and B.K.H. are inventors on WO2018165171A1 TREATMENT FOR WOLFRAM SYNDROME AND OTHER ENDOPLASMIC RETICULUM STRESS DISORDERS. All other authors have no competing interests to declare.
References
- Airavaara M, Chiocco MJ, Howard DB, Zuchowski KL, Peranen J, Liu C, Fang S, Hoffer BJ, Wang Y, and Harvey BK (2010). Widespread cortical expression of MANF by AAV serotype 7: localization and protection against ischemic brain injury. Experimental neurology 225, 104–113. [DOI] [PMC free article] [PubMed] [Google Scholar]
- Arbouw ME, Movig KL, Guchelaar HJ, Neef C, and Egberts TC (2012). Dopamine agonists and ischemic complications in Parkinson’s disease: a nested case-control study. Eur J Clin Pharmacol 68, 83–88. [DOI] [PMC free article] [PubMed] [Google Scholar]
- Bodalia A, Li HB, and Jackson MF (2013). Loss of endoplasmic reticulum Ca2+ homeostasis: contribution to neuronal cell death during cerebral ischemia. Acta pharmacologica Sinica 34, 49–59. [DOI] [PMC free article] [PubMed] [Google Scholar]
- Bodi I, Mikala G, Koch SE, Akhter SA, and Schwartz A (2005). The L-type calcium channel in the heart: the beat goes on. J Clin Invest 115, 3306–3317. [DOI] [PMC free article] [PubMed] [Google Scholar]
- Bonifazi A, Yano H, Ellenberger MP, Muller L, Kumar V, Zou MF, Cai NS, Guerrero AM, Woods AS, Shi L, et al. (2017). Novel Bivalent Ligands Based on the Sumanirole Pharmacophore Reveal Dopamine D2 Receptor (D2R) Biased Agonism. J Med Chem 60, 2890–2907. [DOI] [PMC free article] [PubMed] [Google Scholar]
- Bonifazi A, Yano H, Guerrero AM, Kumar V, Hoffman AF, Lupica CR, Shi L, and Newman AH (2019). Novel and Potent Dopamine D2 Receptor Go-Protein Biased Agonists. ACS Pharmacol Transl Sci 2, 52–65. [DOI] [PMC free article] [PubMed] [Google Scholar]
- Borlongan CV, Hida H, and Nishino H (1998). Early assessment of motor dysfunctions aids in successful occlusion of the middle cerebral artery. Neuroreport 9, 3615–3621. [DOI] [PubMed] [Google Scholar]
- Boys JA, Toledo AH, Anaya-Prado R, Lopez-Neblina F, and Toledo-Pereyra LH (2010). Effects of Dantrolene on Ischemia-Reperfusion Injury in Animal Models: A Review of Outcomes in Heart, Brain, Liver, and Kidney. J Invest Med 58, 875–882. [DOI] [PubMed] [Google Scholar]
- Bull R, Finkelstein JP, Galvez J, Sanchez G, Donoso P, Behrens MI, and Hidalgo C (2008). Ischemia enhances activation by Ca2+ and redox modification of ryanodine receptor channels from rat brain cortex. Journal of Neuroscience 28, 9463–9472. [DOI] [PMC free article] [PubMed] [Google Scholar]
- Burdakov D, Petersen OH, and Verkhratsky A (2005). Intraluminal calcium as a primary regulator of endoplasmic reticulum function. Cell Calcium 38, 303–310. [DOI] [PubMed] [Google Scholar]
- Calne DB, Teychenne PF, Claveria LE, Eastman R, Greenacre JK, and Petrie A (1974). Bromocriptine in Parkinsonism. Br Med J 4, 442–444. [DOI] [PMC free article] [PubMed] [Google Scholar]
- Carpenter CL, Marks SS, Watson DL, and Greenberg DA (1988). Dextromethorphan and Dextrorphan as Calcium-Channel Antagonists. Brain Research 439, 372–375. [DOI] [PubMed] [Google Scholar]
- Chavis P, Fagni L, Lansman JB, and Bockaert J (1996). Functional coupling between ryanodine receptors and L-type calcium channels in neurons. Nature 382, 719–722. [DOI] [PubMed] [Google Scholar]
- Chen ST, Hsu CY, Hogan EL, Maricq H, and Balentine JD (1986). A model of focal ischemic stroke in the rat: reproducible extensive cortical infarction. Stroke 17, 738–743. [DOI] [PubMed] [Google Scholar]
- Choi RH, Koenig X, and Launikonis BS (2017). Dantrolene requires Mg2+ to arrest malignant hyperthermia. P Natl Acad Sci USA 114, 4811–4815. [DOI] [PMC free article] [PubMed] [Google Scholar]
- Corrodi H, Fuxe K, Hokfelt T, Lidbrink P, and Ungerstedt U (1973). Effect of ergot drugs on central catecholamine neurons: evidence for a stimulation of central dopamine neurons. J Pharm Pharmacol 25, 409–412. [DOI] [PubMed] [Google Scholar]
- Dash R, Frank KF, Carr AN, Moravec CS, and Kranias EG (2001). Gender influences on sarcoplasmic reticulum Ca2+-handling in failing human myocardium. J Mol Cell Cardiol 33, 1345–1353. [DOI] [PubMed] [Google Scholar]
- Defronzo RA (2011). Bromocriptine: a sympatholytic, d2-dopamine agonist for the treatment of type 2 diabetes. Diabetes Care 34, 789–794. [DOI] [PMC free article] [PubMed] [Google Scholar]
- Dehpour AR, Mofakham S, and Mahmoudian M (1982). In vitro binding of dantrolene to sarcoplasmic reticulum of rabbit skeletal muscle. Biochem Pharmacol 31, 965–968. [DOI] [PubMed] [Google Scholar]
- Fansa I, Altug ME, Melek I, Ucar E, Kontas T, Akcora B, Atik E, and Duman T (2009). The Neuroprotective and Anti-inflammatory Effects of Diltiazem in Spinal Cord Ischaemia-Reperfusion Injury. J Int Med Res 37, 520–533. [DOI] [PubMed] [Google Scholar]
- Flewellen EH, Nelson TE, Jones WP, Arens JF, and Wagner DL (1983). Dantrolene Dose-Response in Awake Man - Implications for Management of Malignant Hyperthermia. Anesthesiology 59, 275–280. [DOI] [PubMed] [Google Scholar]
- Fluckiger E, and Wagner HR (1968). [2-Br-alpha-ergokryptin: influence on fertility and lactation in the rat]. Experientia 24, 1130–1131. [DOI] [PubMed] [Google Scholar]
- Fonseca SG, Urano F, Weir GC, Gromada J, and Burcin M (2012). Wolfram syndrome 1 and adenylyl cyclase 8 interact at the plasma membrane to regulate insulin production and secretion. Nat Cell Biol 14, 1105–1112. [DOI] [PMC free article] [PubMed] [Google Scholar] [Retracted]
- Framnes-DeBoer SN, Bakke E, Yalamanchili S, Peterson H, Sandoval DA, Seeley RJ, and Arble DM (2020). Bromocriptine improves glucose tolerance independent of circadian timing, prolactin, or the melanocortin-4 receptor. Am J Physiol Endocrinol Metab 318, E62–E71. [DOI] [PMC free article] [PubMed] [Google Scholar]
- Fu S, Watkins SM, and Hotamisligil GS (2012). The role of endoplasmic reticulum in hepatic lipid homeostasis and stress signaling. Cell Metab 15, 623–634. [DOI] [PubMed] [Google Scholar]
- Gao J, Guo J, Li H, Bai S, Li H, Wu B, Wang L, Xi Y, Tian Y, Yang G, et al. (2013). Involvement of dopamine D2 receptors activation in ischemic post-conditioning-induced cardioprotection through promoting PKC-epsilon particulate translocation in isolated rat hearts. Mol Cell Biochem 379, 267–276. [DOI] [PubMed] [Google Scholar]
- Gaziano JM, Cincotta AH, O’Connor CM, Ezrokhi M, Rutty D, Ma ZJ, and Scranton RE (2010). Randomized clinical trial of quick-release bromocriptine among patients with type 2 diabetes on overall safety and cardiovascular outcomes. Diabetes Care 33, 1503–1508. [DOI] [PMC free article] [PubMed] [Google Scholar]
- Gonzalez-Teuber V, Albert-Gasco H, Auyeung VC, Papa FR, Mallucci GR, and Hetz C (2019). Small Molecules to Improve ER Proteostasis in Disease. Trends Pharmacol Sci 40, 684–695. [DOI] [PubMed] [Google Scholar]
- Greenberg B, Butler J, Felker GM, Ponikowski P, Voors AA, Desai AS, Barnard D, Bouchard A, Jaski B, Lyon AR, et al. (2016). Calcium upregulation by percutaneous administration of gene therapy in patients with cardiac disease (CUPID 2): a randomised, multinational, double-blind, placebo-controlled, phase 2b trial. Lancet. [DOI] [PubMed] [Google Scholar]
- Hayashi T, and Su TP (2007). Sigma-1 receptor chaperones at the ER-Mitochondrion interface regulate Ca2+ signaling and cell survival. Cell 131, 596–610. [DOI] [PubMed] [Google Scholar]
- Henderson MJ, Baldwin HA, Werley CA, Boccardo S, Whitaker LR, Yan X, Holt GT, Schreiter ER, Looger LL, Cohen AE, et al. (2015a). A Low Affinity GCaMP3 Variant (GCaMPer) for Imaging the Endoplasmic Reticulum Calcium Store. PLoS One 10, e0139273. [DOI] [PMC free article] [PubMed] [Google Scholar]
- Henderson MJ, Wires ES, Trychta KA, Richie CT, and Harvey BK (2014). SERCaMP: a carboxy-terminal protein modification that enables monitoring of ER calcium homeostasis. Mol Biol Cell 25, 2828–2839. [DOI] [PMC free article] [PubMed] [Google Scholar]
- Henderson MJ, Wires ES, Trychta KA, Yan X, and Harvey BK (2015b). Monitoring Endoplasmic Reticulum Calcium Homeostasis Using a Gaussia Luciferase SERCaMP. J Vis Exp. [DOI] [PMC free article] [PubMed] [Google Scholar]
- Hetz C, Zhang K, and Kaufman RJ (2020). Mechanisms, regulation and functions of the unfolded protein response. Nature reviews Molecular cell biology 21, 421–438. [DOI] [PMC free article] [PubMed] [Google Scholar]
- Hilfiker-Kleiner D, Haghikia A, Berliner D, Vogel-Claussen J, Schwab J, Franke A, Schwarzkopf M, Ehlermann P, Pfister R, Michels G, et al. (2017). Bromocriptine for the treatment of peripartum cardiomyopathy: a multicentre randomized study. Eur Heart J 38, 2671–2679. [DOI] [PMC free article] [PubMed] [Google Scholar]
- Hong SJ, and Chiou GC (1998). Effects of Intracellular Calcium Reduction by Dantrolene on Prevention/Treatment of Ischemic Stroke. J Cardiovasc Pharmacol Ther 3, 299–304. [DOI] [PubMed] [Google Scholar]
- Huang R, Southall N, Wang Y, Yasgar A, Shinn P, Jadhav A, Nguyen DT, and Austin CP (2011). The NCGC pharmaceutical collection: a comprehensive resource of clinically approved drugs enabling repurposing and chemical genomics. Sci Transl Med 3, 80ps16. [DOI] [PMC free article] [PubMed] [Google Scholar]
- Jahnichen S, Horowski R, and Pertz HH (2005). Agonism at 5-HT2B receptors is not a class effect of the ergolines. Eur J Pharmacol 513, 225–228. [DOI] [PubMed] [Google Scholar]
- Jessup M, Greenberg B, Mancini D, Cappola T, Pauly DF, Jaski B, Yaroshinsky A, Zsebo KM, Dittrich H, Hajjar RJ, et al. (2011). Calcium Upregulation by Percutaneous Administration of Gene Therapy in Cardiac Disease (CUPID): a phase 2 trial of intracoronary gene therapy of sarcoplasmic reticulum Ca2+-ATPase in patients with advanced heart failure. Circulation 124, 304–313. [DOI] [PMC free article] [PubMed] [Google Scholar]
- Kang S, Dahl R, Hsieh W, Shin A, Zsebo KM, Buettner C, Hajjar RJ, and Lebeche D (2016). Small Molecular Allosteric Activator of the Sarco/Endoplasmic Reticulum Ca2+-ATPase (SERCA) Attenuates Diabetes and Metabolic Disorders. J Biol Chem 291, 5185–5198. [DOI] [PMC free article] [PubMed] [Google Scholar]
- Ketel WB, and Kolb ME (1984). Long-term treatment with dantrolene sodium of stroke patients with spasticity limiting the return of function. Curr Med Res Opin 9, 161–169. [DOI] [PubMed] [Google Scholar]
- Kim IK, Park SJ, Park JH, Lee SH, Hong SE, and Reed JC (2012). Cyclosporine A and bromocriptine attenuate cell death mediated by intracellular calcium mobilization. BMB Rep 45, 482–487. [DOI] [PubMed] [Google Scholar]
- Kroeze WK, Sassano MF, Huang XP, Lansu K, McCorvy JD, Giguere PM, Sciaky N, and Roth BL (2015). PRESTO-Tango as an open-source resource for interrogation of the druggable human GPCRome. Nat Struct Mol Biol 22, 362–369. [DOI] [PMC free article] [PubMed] [Google Scholar]
- Larrazet F, Spaulding C, Lobreau HJ, Weber S, and Guerin F (1993). Possible bromocriptine-induced myocardial infarction. Ann Intern Med 118, 199–200. [DOI] [PubMed] [Google Scholar]
- Li F, Hayashi T, Jin G, Deguchi K, Nagotani S, Nagano I, Shoji M, Chan PH, and Abe K (2005). The protective effect of dantrolene on ischemic neuronal cell death is associated with reduced expression of endoplasmic reticulum stress markers. Brain Research 1048, 59–68. [DOI] [PubMed] [Google Scholar]
- Liu XH, Kato H, Chen T, Kato K, and Itoyama Y (1995). Bromocriptine protects against delayed neuronal death of hippocampal neurons following cerebral ischemia in the gerbil. J Neurol Sci 129, 9–14. [DOI] [PubMed] [Google Scholar]
- Lu SM, Kanekura K, Hara T, Mahadevan J, Spears LD, Oslowski CM, Martinez R, Yamazaki-Inoue M, Toyoda M, Neilson A, et al. (2014). A calcium-dependent protease as a potential therapeutic target for Wolfram syndrome. P Natl Acad Sci USA 111, E5292–E5301. [DOI] [PMC free article] [PubMed] [Google Scholar]
- Lutterbeck PM, Pryor JS, Varga L, and Wenner R (1971). Treatment of non-puerperal galactorrhoea with an ergot alkaloid. Br Med J 3, 228–229. [DOI] [PMC free article] [PubMed] [Google Scholar]
- MacLeod RM, and Lehmeyer JE (1974). Studies on the mechanism of the dopamine-mediated inhibition of prolactin secretion. Endocrinology 94, 1077–1085. [DOI] [PubMed] [Google Scholar]
- Maniskas ME, Roberts JM, Aron I, Fraser JF, and Bix GJ (2016). Stroke neuroprotection revisited: Intra-arterial verapamil is profoundly neuroprotective in experimental acute ischemic stroke. J Cerebr Blood F Met 36, 721–730. [DOI] [PMC free article] [PubMed] [Google Scholar]
- Marx SO, Reiken S, Hisamatsu Y, Jayaraman T, Burkhoff D, Rosemblit N, and Marks AR (2000). PKA phosphorylation dissociates FKBP12.6 from the calcium release channel (ryanodine receptor): defective regulation in failing hearts. Cell 101, 365–376. [DOI] [PubMed] [Google Scholar]
- Mekahli D, Bultynck G, Parys JB, De Smedt H, and Missiaen L (2011). Endoplasmic-reticulum calcium depletion and disease. Cold Spring Harb Perspect Biol 3. [DOI] [PMC free article] [PubMed] [Google Scholar]
- Metcalf MG, Higuchi-Sanabria R, Garcia G, Tsui CK, and Dillin A (2020). Beyond the cell factory: Homeostatic regulation of and by the UPR(ER). Sci Adv 6, eabb9614. [DOI] [PMC free article] [PubMed] [Google Scholar]
- Michael Besser G, Pfeiffer RF, and Thorner MO (2018). ANNIVERSARY REVIEW: 50 years since the discovery of bromocriptine. Eur J Endocrinol 179, R69–R75. [DOI] [PubMed] [Google Scholar]
- Millan MJ, Maiofiss L, Cussac D, Audinot V, Boutin JA, and Newman-Tancredi A (2002). Differential actions of antiparkinson agents at multiple classes of monoaminergic receptor. I. A multivariate analysis of the binding profiles of 14 drugs at 21 native and cloned human receptor subtypes. J Pharmacol Exp Ther 303, 791–804. [DOI] [PubMed] [Google Scholar]
- Miyamoto MI, del Monte F, Schmidt U, DiSalvo TS, Kang ZB, Matsui T, Guerrero JL, Gwathmey JK, Rosenzweig A, and Hajjar RJ (2000). Adenoviral gene transfer of SERCA2a improves left-ventricular function in aortic-banded rats in transition to heart failure. Proc Natl Acad Sci U S A 97, 793–798. [DOI] [PMC free article] [PubMed] [Google Scholar]
- Munro S, and Pelham HR (1987). A C-terminal signal prevents secretion of luminal ER proteins. Cell 48, 899–907. [DOI] [PubMed] [Google Scholar]
- Narkar V, Kunduzova O, Hussain T, Cambon C, Parini A, and Lokhandwala M (2004). Dopamine D2-like receptor agonist bromocriptine protects against ischemia/reperfusion injury in rat kidney. Kidney Int 66, 633–640. [DOI] [PubMed] [Google Scholar]
- Newman-Tancredi A, Cussac D, Audinot V, Nicolas JP, De Ceuninck F, Boutin JA, and Millan MJ (2002). Differential actions of antiparkinson agents at multiple classes of monoaminergic receptor. II. Agonist and antagonist properties at subtypes of dopamine D(2)-like receptor and alpha(1)/alpha(2)-adrenoceptor. J Pharmacol Exp Ther 303, 805–814. [DOI] [PubMed] [Google Scholar]
- Ong DST, Mu TW, Palmer AE, and Kelly JW (2010). Endoplasmic reticulum Ca2+ increases enhance mutant glucocerebrosidase proteostasis. Nature chemical biology 6, 424–432. [DOI] [PMC free article] [PubMed] [Google Scholar]
- Osman AA, Saito M, Makepeace C, Permutt MA, Schlesinger P, and Mueckler M (2003). Wolframin expression induces novel ion channel activity in endoplasmic reticulum membranes and increases intracellular calcium. J Biol Chem 278, 52755–52762. [DOI] [PubMed] [Google Scholar]
- Ouardouz M, Nikolaeva MA, Coderre E, Zamponi GW, McRory JE, Trapp BD, Yin XH, Wang WL, Woulfe J, and Stys PK (2003). Depolarization-induced Ca2+ release in ischemic spinal cord white matter involves L-type Ca2+ channel activation of ryanodine receptors. Neuron 40, 53–63. [DOI] [PubMed] [Google Scholar]
- Ovalle F, Grimes T, Xu GL, Patel AJ, Grayson TB, Thielen LA, Li P, and Shalev A (2018). Verapamil and beta cell function in adults with recent-onset type 1 diabetes. Nature medicine 24, 1108–+. [DOI] [PMC free article] [PubMed] [Google Scholar]
- Park SW, Zhou Y, Lee J, Lee J, and Ozcan U (2010). Sarco(endo)plasmic reticulum Ca2+-ATPase 2b is a major regulator of endoplasmic reticulum stress and glucose homeostasis in obesity. Proc Natl Acad Sci U S A 107, 19320–19325. [DOI] [PMC free article] [PubMed] [Google Scholar]
- Piacentino V, Weber CR, Chen X, Weisser-Thomas J, Margulies KB, Bers DM, and Houser SR (2003). Cellular basis of abnormal calcium transients of failing human ventricular myocytes. Circ Res 92, 651–658. [DOI] [PubMed] [Google Scholar]
- Pijl H, Ohashi S, Matsuda M, Miyazaki Y, Mahankali A, Kumar V, Pipek R, Iozzo P, Lancaster JL, Cincotta AH, et al. (2000). Bromocriptine: a novel approach to the treatment of type 2 diabetes. Diabetes Care 23, 1154–1161. [DOI] [PubMed] [Google Scholar]
- Prunier F, Kawase Y, Gianni D, Scapin C, Danik SB, Ellinor PT, Hajjar RJ, and Del Monte F (2008). Prevention of ventricular arrhythmias with sarcoplasmic reticulum Ca2+ ATPase pump overexpression in a porcine model of ischemia reperfusion. Circulation 118, 614–624. [DOI] [PubMed] [Google Scholar]
- Ravussin Y, Gutman R, LeDuc CA, and Leibel RL (2013). Estimating energy expenditure in mice using an energy balance technique. Int J Obes (Lond) 37, 399–403. [DOI] [PMC free article] [PubMed] [Google Scholar]
- Raykhel I, Alanen H, Salo K, Jurvansuu J, Nguyen VD, Latva-Ranta M, and Ruddock L (2007). A molecular specificity code for the three mammalian KDEL receptors. J Cell Biol 179, 1193–1204. [DOI] [PMC free article] [PubMed] [Google Scholar]
- Rosen DA, Seki SM, Fernandez-Castaneda A, Beiter RM, Eccles JD, Woodfolk JA, and Gaultier A (2019). Modulation of the sigma-1 receptor-IRE1 pathway is beneficial in preclinical models of inflammation and sepsis. Sci Transl Med 11. [DOI] [PMC free article] [PubMed] [Google Scholar]
- Santulli G, Pagano G, Sardu C, Xie W, Reiken S, D’Ascia SL, Cannone M, Marziliano N, Trimarco B, Guise TA, et al. (2015). Calcium release channel RyR2 regulates insulin release and glucose homeostasis. J Clin Invest 125, 4316. [DOI] [PMC free article] [PubMed] [Google Scholar]
- Semenza JC, Hardwick KG, Dean N, and Pelham HR (1990). ERD2, a yeast gene required for the receptor-mediated retrieval of luminal ER proteins from the secretory pathway. Cell 61, 1349–1357. [DOI] [PubMed] [Google Scholar]
- Shoshanbarmatz V, Pressley TA, Higham S, and Krausfriedmann N (1991). Characterization of High-Affinity Ryanodine-Binding Sites of Rat-Liver Endoplasmic-Reticulum - Differences between Liver and Skeletal-Muscle. Biochemical Journal 276, 41–46. [DOI] [PMC free article] [PubMed] [Google Scholar]
- Sun L, and Wei H (2020). Ryanodine Receptors: A Potential Treatment Target in Various Neurodegenerative Disease. Cell Mol Neurobiol. [DOI] [PMC free article] [PubMed] [Google Scholar]
- Taylor CP, Traynelis SF, Siffert J, Pope LE, and Matsumoto RR (2016). Pharmacology of dextromethorphan: Relevance to dextromethorphan/quinidine (Nuedexta (R)) clinical use. Pharmacol Therapeut 164, 170–182. [DOI] [PubMed] [Google Scholar]
- Thorner MO, Chait A, Aitken M, Benker G, Bloom SR, Mortimer CH, Sanders P, Mason AS, and Besser GM (1975). Bromocriptine treatment of acromegaly. Br Med J 1, 299–303. [DOI] [PMC free article] [PubMed] [Google Scholar]
- Trychta KA, Back S, Henderson MJ, and Harvey BK (2018a). KDEL Receptors Are Differentially Regulated to Maintain the ER Proteome under Calcium Deficiency. Cell Rep 25, 1829–1840 e1826. [DOI] [PMC free article] [PubMed] [Google Scholar]
- Trychta KA, Heathward EJ, Sulima A, Back S, Farokhnia M, Richie CT, Leggio L, Rice KC, and Harvey BK (2018b). Extracellular esterase activity as an indicator of endoplasmic reticulum calcium depletion. Biomarkers 23, 756–765. [DOI] [PMC free article] [PubMed] [Google Scholar]
- Valdivia HH, Valdivia C, and Coronado R (1990). Direct Binding of Verapamil to the Ryanodine Receptor Ca-2+ Release Channel of Sarcoplasmic-Reticulum. Biophysical Journal 57, A345–A345. [DOI] [PMC free article] [PubMed] [Google Scholar]
- Wires ES, Henderson MJ, Yan X, Back S, Trychta KA, Lutrey MH, and Harvey BK (2017). Longitudinal monitoring of Gaussia and Nano luciferase activities to concurrently assess ER calcium homeostasis and ER stress in vivo. PLoS One 12, e0175481. [DOI] [PMC free article] [PubMed] [Google Scholar]
- Yin J, Chen KM, Clark MJ, Hijazi M, Kumari P, Bai XC, Sunahara RK, Barth P, and Rosenbaum DM (2020). Structure of a D2 dopamine receptor-G-protein complex in a lipid membrane. Nature 584, 125–129. [DOI] [PMC free article] [PubMed] [Google Scholar]
- Zhang IX, Raghavan M, and Satin LS (2020). The Endoplasmic Reticulum and Calcium Homeostasis in Pancreatic Beta Cells. Endocrinology 161. [DOI] [PMC free article] [PubMed] [Google Scholar]
- Zhang JH, Chung TD, and Oldenburg KR (1999). A Simple Statistical Parameter for Use in Evaluation and Validation of High Throughput Screening Assays. J Biomol Screen 4, 67–73. [DOI] [PubMed] [Google Scholar]
Associated Data
This section collects any data citations, data availability statements, or supplementary materials included in this article.
Supplementary Materials
Table S2: Seven amino acid ERS tails that correspond to the C-terminus of a human ER luminal protein and were appended to Gaussia luciferase. Related to Figure 5.
Table S1: High-throughput screening results. Related to Figure 1.
Table S3: Activity of Analog 688 on GPCRs examined in the NIMH Psychoactive Drug Screening Program GPCRome assay. Related to Figure 6.
Table S4: Pharmacokinetics of bromocriptine and analogs in mouse. Related to Figure 7.
Table S5: Metabolomic parameters from diet-induced obesity study. Related to Figure 7.
Table S6: Nucleotide sequences for all primers and hydrolysis probes. Related to Figure 3.
Data Availability Statement
The high-throughput screening datasets generated during this study are available at Pubchem, AID numbers 1508627–1508630.