



Abstract
Objective
Nocturnal desaturation is common in patients with chronic respiratory disease and often worsens the prognosis. Therefore, it should be diagnosed accurately and appropriately treated. The aim of this study was to clarify the diversity of nocturnal desaturation.
Methods
We prospectively enrolled 58 outpatients diagnosed with chronic respiratory disease receiving home oxygen therapy and measured nocturnal SpO2 using a portable oximeter. We classified nocturnal desaturation (3% decrease in SpO2 from baseline) into three patterns: periodic pattern (desaturation duration of <655 seconds), sustained pattern (desaturation duration of ≥655 seconds), and intermittent pattern (desaturation and recovery of SpO2 repeated with a cycle of several minutes).
Results
Nocturnal hypoxemia (SpO2 ≤88% for more than 5 minutes) was found in 23.8% of patients. The percentage of patients with chronic obstructive pulmonary disease (COPD) was significantly higher in the nocturnal hypoxemia group than in the non-hypoxemia group (80% vs. 40.6%, p=0.03). Desaturation with a periodic pattern was found in 81% of patients, desaturation with a sustained pattern was found in 40.5% of patients, and desaturation with an intermittent pattern was found in 59.5% of patients. In patients with COPD, desaturation with a periodic pattern was found in 85.7%, desaturation with a sustained pattern was found in 47.6%, and desaturation with an intermittent pattern was found in 57.1%.
Conclusion
The SpO2 waveform of nocturnal hypoxemia was able to be classified into three patterns. Suitable treatment for each pattern might improve the prognosis of these patients.
Keywords: nocturnal desaturation, COPD, rapid eye movement, obstructive sleep apnoea
Introduction
Nocturnal desaturation is a well-known complication in patients with chronic respiratory disease (1). Sleep affects breathing in several ways, including through changes in the respiratory centre, respiratory muscle hypotonia, and lung mechanics. Sleep is composed of three different stages: wakefulness, rapid eye movement (REM) sleep, and non-REM sleep. During sleep, particularly REM sleep, the hypoxic and hypercapnic ventilatory responses of the respiratory centre are blunted, and the tone and activity of the respiratory muscles are diminished. These changes lead to a decrease in minute ventilation, resulting in alveolar hypoventilation (2,3), which is not fully compensated by increasing breathing frequency and ventilation from the diaphragm. Even in healthy subjects, minute ventilation drops by approximately 15% from wakefulness to non-REM sleep and further to REM sleep (4). This reduction can be negligible in healthy subjects; however, in patients with chronic respiratory diseases who have a poor respiratory function or who are highly dependent on accessory muscles of respiration, this reduction can lead to nocturnal desaturation.
Indeed, several studies have reported that 27-70% of patients with chronic obstructive pulmonary disease (COPD) have sleep-related oxygen desaturation, although they do not have daytime oxygen desaturation (3). Another study reported that 40% of patients receiving home oxygen therapy (HOT) have sleep-related oxygen desaturation (5). Nocturnal desaturation has an important clinical implication, as it is related to daytime respiratory failure, exacerbation frequency, a poor sleep quality, pulmonary hypertension, and mortality (3,6,7). Therefore, nocturnal desaturation should be detected by proper screening and appropriate treatment, especially in patients with chronic respiratory disease. However, treatment for nocturnal desaturation does not always lead to improvement in the patient outcome (8). We suspect this discrepancy may arise from the diversity of nocturnal desaturation.
Given the above, the present study explored the diversity of nocturnal desaturation.
Materials and Methods
Patients
This multicentre prospective study was performed between August 2014 and March 2017 at six general hospitals in Japan: Kobe University Hospital, Takatsuki General Hospital, Municipal Kasai Hospital, Kakogawa Central City Hospital, Kitaharima Medical Center, and Akashi Medical Center. The current study was conducted with the approval of the Ethics Committees or Institutional Review Board of Kobe University Hospital (1592).
We enrolled 58 outpatients diagnosed with chronic respiratory disease who met the following criteria: age ≥20 years old; receiving HOT for chronic respiratory failure; stable condition of chronic respiratory disease; and free from exacerbation for at least 1 month. The indication for HOT was based on the guideline of the Ministry of Health, Labor and Welfare (patients with severe chronic respiratory failure whose partial pressure of arterial oxygen was ≤55 mmHg or whose partial pressure of arterial oxygen was ≤60 mmHg and with significant hypoxemia during sleep and exercise). Patients were excluded from this study if they were receiving positive-pressure ventilation therapy, experienced exacerbation within one month, or had any type of cancer.
Written informed consent was obtained from all study participants. The flowchart describing patient recruitment is shown in Fig. 1.
Figure 1.
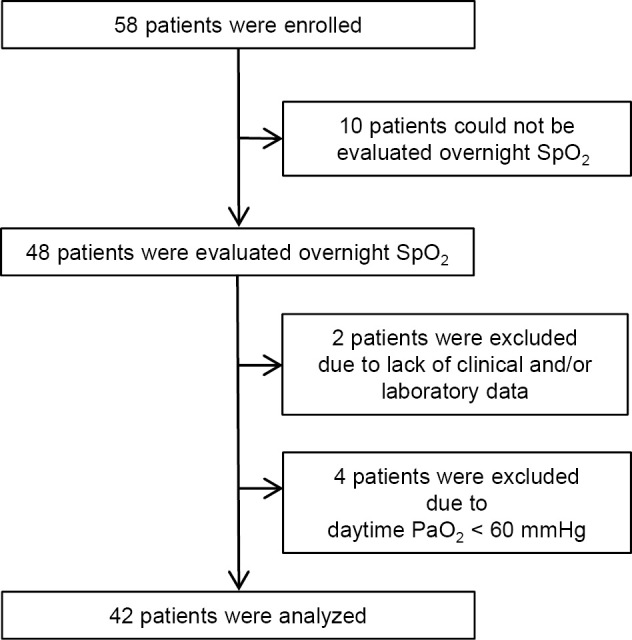
Flowchart describing patient recruitment.
Measurement and data collection
At registration, arterial blood gases were determined in patients receiving HOT at the prescribed dose of supplementary oxygen. All overnight home oximetry tests were performed using the same portable oximeter with a finger probe (PULSOX-Me 300; Konica Minolta, Tokyo, Japan) under the prescribed dose of supplementary oxygen inhaled. Clinical and laboratory data were extracted from medical records.
Classification algorithm of nocturnal desaturation
In the present study, nocturnal hypoxemia was defined as SpO2 ≤88% for more than 5 minutes, while desaturation was defined as a more than 3% decrease in SpO2 from the baseline. Nocturnal desaturation was divided into three patterns based on the algorithm reported by Izumi et al. (9). In brief, when the SpO2 dropped and did not recover within 655 seconds, which is the standard deviation of desaturation durations obtained from 48 patients, it was classified as a sustained pattern (Fig. 2b). When the dropping interval was less than that of a sustained pattern, it was classified as a periodic pattern (Fig. 2a). We also defined a third pattern as the intermittent pattern, in which the dropping and recovery of SpO2 repeated with a cycle of several minutes (Fig. 2c). In addition, a time-frequency analysis using discrete Fourier transform (DFT) was conducted for SpO2 data. The window length was set to 600 seconds, and the maximum spectral power between (0.7/60) and (1.5/60) Hz was calculated. The intermittent pattern was assigned when the maximum spectral power was >2.5 and this state occurred for over 1,300 seconds per hour. Finally, we defined a waveform with slight changes in SpO2 other than the patterns described above as a normal pattern. After determining the pattern from the SpO2 data, SpO2 waveforms were classified into the following eight categories based on the combination of the four patterns: 1. Normal, 2. Sustained, 3. Periodic, 4. Intermittent, 5. Mixed (Sustained+Periodic+Intermittent), 6. Mixed (Periodic+Intermittent), 7. Mixed (Sustained+Periodic), 8. Mixed (Sustained+Intermittent).
Figure 2.

Typical waveforms of the (a) periodic pattern, (b) sustained pattern, and (c) intermittent pattern. The matching rate between classification by an automatic analysis algorithm and by chest physicians for the (d) periodic pattern, (e) sustained pattern, and (f) intermittent pattern.
Classification of nocturnal desaturation by chest physicians
To evaluate validity of the algorithm, 10 chest physicians with over 5 years of experience classified the SpO2 decline patterns of 42 patients according to the following criteria: (1) a ‘sustained' pattern was defined as at least one drop by 3 percentage points from baseline for ≥655 seconds, (2) a ‘periodic' pattern was defined as at least two drops by 3 percentage points from baseline for <655 seconds, (3) an ‘intermittent' pattern was defined as more than 15 drops by 3 percentage points from baseline for 1 hour, and (4) a ‘mixed' pattern comprised a combination of these three pattern. Even if there was only one event that coincided with each desaturation pattern, the event met the criteria, physicians decided that the SpO2 data possessed the desaturation pattern. Physicians voted without knowing each other's opinions, and final decisions were based on a majority vote.
Statistical analyses
Differences in patient characteristics between the two groups were tested for significance by the Mann-Whitney U test. All p values reported are 2-sided, and p values <0.05 were considered significant. The kappa value was calculated from the observed and expected frequencies on the diagonal of a square contingency table (10). Kappa values of 0, 0.01-0.20, 0.21-0.40, 0.41-0.60, 0.61-0.80, and 0.81-1.00 indicate absent, slight, fair, moderate, good, and excellent, respectively.
Results
Patient characteristics
Forty-two patients (18 men and 24 women) met the eligibility criteria. The median age of the participants was 75 years old [95% confidence interval (CI), 71.5-77.7 years old], and the body mass index (BMI) was 21.0 (95% CI, 20.2-22.4) kg/m2. Twenty-one of the 42 patients suffered from COPD, and 16 of the 42 patients had interstitial pneumonia. Ten of the 42 (24%) patients had nocturnal hypoxemia.
The characteristics and laboratory data of the patients with and without nocturnal hypoxemia are summarized in Table 1. There was no significant difference in the gender, age, BMI, complication rate of congestive heart failure, lung function, or arterial blood gas findings between the two groups. In contrast, the percentage of patients with COPD was significantly higher in the nocturnal hypoxemia group than in the non-hypoxemia group (80% vs. 40.6%, p=0.03).
Table 1.
Patient Characteristics.
| Nocturnal hypoxemia (n=10) |
Non-nocturnal hypoxemia (n=32) |
p value | ||||
|---|---|---|---|---|---|---|
| Male/Female | 4/6 | 14/18 | 0.83 | |||
| Age (years) | 72 [68.0-76.2] | 77 [71.4-79.3] | 0.11 | |||
| BMI (kg/m2) | 20.6 [18.6-23.4] | 21.5 [20.1-22.6] | 0.84 | |||
| Under lying lung disease | ||||||
| COPD | 8 | 13 | 0.03* | |||
| IP | 3 | 13 | 0.55 | |||
| Others | 1 | 8 | 0.12 | |||
| Myocardial infarction | 0 | 1 | 1.0 | |||
| Heart failure | 4 | 3 | 0.19 | |||
| Cerebrovascular disease | 0 | 1 | 1.0 | |||
| Rheumatic disease | 1 | 3 | 1.0 | |||
| Diabetes mellitus | 0 | 1 | 1.0 | |||
| Chronic Kidney disease | 0 | 1 | 1.0 | |||
| Any prior tumor | 0 | 5 | 0.31 | |||
| Leukemia | 0 | 1 | 1.0 | |||
| Hypertension | 2 | 4 | 0.62 | |||
| pH | 7.40 [7.34-7.41] | 7.40 [7.39-7.41] | 0.42 | |||
| PaO2 | 75.8 [69.8-91.4] | 87.5 [84.3-103.8] | 0.10 | |||
| PaCO2 | 41.3 [36.8-59.6] | 44.8 [41.9-46.9] | 0.87 | |||
| VC (L) | 1.91 [1.50-2.92] | 2.17 [1.74-2.46] | 0.70 | |||
| %VC (%) | 72.8 [61.6-83.4] | 74.1 [62.9-82.8] | 0.91 | |||
| FEV1 (L) | 1.27 [0.82-2.03] | 0.95 [1.0-1.60] | 0.54 | |||
| FEV1/FVC (%) | 68.7 [54.9-81.5] | 76.7 [58.2-76.1] | 0.72 | |||
| SpO2 min (%) | 78.8 [70.7-82.3] | 79.9 [74.2-80.5] | 0.76 |
Data are presented as median [95% confidence interval]. *p<0.05.
BMI: body mass index, COPD: chronic obstructive pulmonary disease, IP: interstitial pneumonia, VC: vital capacity, FEV1: forced expiratory volume in 1 second, FVC: forced vital capacity
Classification by the automatic analysis algorithm
Determination results by the automatic analysis algorithm for the waveforms are shown below. Desaturation with a periodic pattern was found in 34 (81%), desaturation with a sustained pattern was found in 17 (40.5%), desaturation with an intermittent pattern was found in 25 (59.5%) (some overlap was noted), and a normal pattern was found in 4 (9.5%).
Classifications by chest physicians
To confirm the validity of the algorithm, we evaluated the agreement between chest physicians with kappa statistics. The determination results by chest physicians are shown in Table 2. We then compared the determination results by chest physicians with those obtained by the algorithm for each pattern. As a result of the comparison, the agreement between chest physicians was moderate, but the sensitivities and specificities of the algorithm were 91.3-100% and 60-100%, respectively (Fig. 2d-f). Given these findings, this algorithm seems to be useful.
Table 2.
Determination Results by Chest Physicians and Interpretation of the Agreement between the Independent Examiners according to the Kappa.
| No. | A | B | C | D | E | F | G | H | I | J |
|---|---|---|---|---|---|---|---|---|---|---|
| 1 | 1 | 1 | 1 | 3 | 1 | 1 | 3 | 1 | 1 | 1 |
| 2 | 3 | 3 | 4 | 4 | 4 | 4 | 3 | 4 | 1 | 4 |
| 3 | 3 | 3 | 6 | 6 | 6 | 3 | 6 | 6 | 3 | 6 |
| 4 | 7 | 4 | 7 | 5 | 5 | 5 | 5 | 8 | 7 | 5 |
| 5 | 6 | 6 | 6 | 6 | 6 | 6 | 6 | 6 | 3 | 6 |
| 6 | 3 | 7 | 3 | 6 | 6 | 6 | 6 | 6 | 3 | 6 |
| 7 | 7 | 5 | 7 | 5 | 5 | 5 | 3 | 5 | 5 | 5 |
| 8 | 3 | 3 | 3 | 3 | 3 | 3 | 3 | 6 | 3 | 6 |
| 9 | 4 | 4 | 6 | 4 | 4 | 4 | 4 | 4 | 6 | 4 |
| 10 | 7 | 7 | 7 | 7 | 7 | 7 | 7 | 5 | 7 | 5 |
| 11 | 6 | 6 | 6 | 6 | 6 | 3 | 3 | 6 | 3 | 6 |
| 12 | 7 | 8 | 7 | 5 | 5 | 7 | 5 | 5 | 7 | 5 |
| 13 | 3 | 6 | 3 | 6 | 6 | 3 | 3 | 6 | 3 | 6 |
| 14 | 5 | 5 | 7 | 5 | 5 | 5 | 5 | 5 | 7 | 5 |
| 15 | 1 | 3 | 3 | 3 | 1 | 1 | 3 | 4 | 1 | 3 |
| 16 | 5 | 5 | 7 | 5 | 5 | 7 | 5 | 5 | 7 | 5 |
| 17 | 2 | 2 | 2 | 7 | 2 | 2 | 7 | 2 | 2 | 2 |
| 18 | 3 | 3 | 3 | 6 | 3 | 3 | 6 | 6 | 3 | 6 |
| 19 | 6 | 1 | 6 | 4 | 4 | 4 | 3 | 4 | 1 | 4 |
| 20 | 3 | 1 | 3 | 3 | 3 | 3 | 3 | 3 | 3 | 3 |
| 21 | 6 | 6 | 6 | 6 | 6 | 3 | 6 | 6 | 3 | 6 |
| 22 | 7 | 7 | 7 | 5 | 7 | 7 | 7 | 5 | 7 | 7 |
| 23 | 1 | 1 | 1 | 1 | 1 | 1 | 1 | 1 | 1 | 1 |
| 24 | 3 | 4 | 3 | 3 | 3 | 3 | 3 | 4 | 3 | 3 |
| 25 | 7 | 5 | 7 | 5 | 7 | 7 | 5 | 5 | 7 | 5 |
| 26 | 3 | 3 | 3 | 3 | 3 | 3 | 1 | 4 | 1 | 3 |
| 27 | 5 | 5 | 5 | 5 | 5 | 5 | 5 | 5 | 7 | 5 |
| 28 | 6 | 1 | 3 | 6 | 4 | 1 | 1 | 4 | 6 | 4 |
| 29 | 6 | 4 | 6 | 6 | 4 | 4 | 3 | 6 | 6 | 4 |
| 30 | 2 | 2 | 7 | 7 | 2 | 7 | 7 | 7 | 2 | 2 |
| 31 | 2 | 7 | 7 | 7 | 7 | 2 | 2 | 2 | 2 | 2 |
| 32 | 7 | 7 | 7 | 7 | 7 | 7 | 7 | 7 | 7 | 7 |
| 33 | 6 | 6 | 6 | 6 | 6 | 6 | 6 | 6 | 3 | 4 |
| 34 | 4 | 3 | 6 | 4 | 4 | 4 | 3 | 6 | 6 | 4 |
| 35 | 5 | 5 | 7 | 5 | 5 | 5 | 5 | 5 | 5 | 5 |
| 36 | 4 | 3 | 3 | 3 | 4 | 4 | 3 | 6 | 3 | 1 |
| 37 | 5 | 5 | 7 | 5 | 5 | 5 | 5 | 5 | 5 | 5 |
| 38 | 1 | 1 | 1 | 3 | 1 | 1 | 1 | 1 | 1 | 1 |
| 39 | 5 | 3 | 7 | 5 | 3 | 8 | 5 | 5 | 7 | 5 |
| 40 | 5 | 6 | 3 | 5 | 6 | 5 | 5 | 5 | 7 | 6 |
| 41 | 3 | 3 | 3 | 6 | 3 | 3 | 6 | 3 | 3 | 3 |
| 42 | 6 | 6 | 6 | 6 | 6 | 6 | 6 | 6 | 6 | 6 |
| No. | Pattern | |||||||||
| 1 | Normal | |||||||||
| 2 | Sustained | |||||||||
| 3 | Periodic | |||||||||
| 4 | Intermittent | |||||||||
| 5 | Mixed (Sustained+Periodic+Intermittent) | |||||||||
| 6 | Mixed (Periodic+Intermittent) | |||||||||
| 7 | Mixed (Sustained+Periodic) | |||||||||
| 8 | Mixed (Sustained+Intermittent) | |||||||||
| Kappa value | 0.46 | |||||||||
| Kappa value | Agreement | |||||||||
| 0 | Absent | |||||||||
| >0-0.2 | Slight | |||||||||
| 0.21-0.40 | Fair | |||||||||
| 0.41-0.60 | Moderate | |||||||||
| 0.61-0.80 | Good | |||||||||
| 0.81-1.00 | Excellent | |||||||||
Classification by automatic analysis algorithm in patients with COPD
To gain further insight into the relationship between the classification by the automatic analysis algorithm and patient characteristics, we focused on COPD, which was the most common cause of HOT in the present study.
Among the 21 patients with COPD, 8 (38%) patients had nocturnal hypoxemia. Table 3 shows the characteristics and laboratory data of the patients with COPD. There were no significant differences in the gender, age, BMI, lung function, or arterial blood gas findings between the two groups.
Table 3.
COPD Patient Characteristics.
| Nocturnal hypoxemia (n=8) |
Non-nocturnal hypoxemia (n=13) |
p value | ||||
|---|---|---|---|---|---|---|
| Male/Female | 4/4 | 8/5 | 0.60 | |||
| Age (years) | 71 [66.5-77.0] | 74 [72.6-80.8] | 0.07 | |||
| BMI (kg/m2) | 21.0 [19.6-24.2] | 19.7 [18.3-21.5] | 0.15 | |||
| pH | 7.40 [7.34-7.41] | 7.40 [7.39-7.41] | 0.73 | |||
| PaO2 | 75.8 [69.3-90.0] | 84.0 [76.4-106.3] | 0.25 | |||
| PaCO2 | 37.4 [32.7-58.9] | 40.9 [39.2-45.4] | 0.59 | |||
| VC (L) | 2.30 [1.62-3.33] | 2.61 [2.27-3.03] | 0.64 | |||
| %VC (%) | 76.9 [65.6-88.1] | 95.3 [82.1-102.3] | 0.06 | |||
| FEV1 (L) | 1.44 [0.72-2.40] | 1.04 [0.75-1.72] | 0.43 | |||
| FEV1/FVC (%) | 68.7 [51.7-78.6] | 42.5 [36.5-63.3] | 0.16 | |||
| SpO2 min (%) | 79.3 [72.5-82.8] | 80.7 [73.5-83.0] | 0.67 |
Data are presented as median [95% confidence interval]. *p<0.05.
BMI: body mass index, VC: vital capacity, FEV1: forced expiratory volume in 1 second, FVC: forced vital capacity
The SpO2 waveforms in patients with COPD were classified into 4 patterns according to the automatic analysis algorithm: a normal pattern was found in 1 (4.8%), desaturation with a sustained pattern was found in 10 (47.6%), desaturation with a periodic pattern was found in 18 (85.7%), and desaturation with an intermittent pattern was found in 12 (57.1%) (some overlap was noted).
We classified patients with COPD based on whether or not they had each desaturation pattern. There were no significant differences in the gender, age, BMI, lung function, or arterial blood gas findings among desaturation patterns. In contrast, percent predicted forced expiratory volume in 1 second was significantly lower in the COPD patients who did not have desaturation with an intermittent pattern than in those who did have desaturation with an intermittent pattern (p=0.02) (Table 4, Fig. 3). The COPD patients who did not have desaturation with an intermittent pattern included those with a normal pattern.
Table 4.
COPD Patient Characteristics.
| Desaturation with intermittent (n=12) |
Non-desaturation with intermittent (n=9) |
p value | ||||
|---|---|---|---|---|---|---|
| Male/Female | 7/5 | 5/4 | 0.90 | |||
| Age (years) | 77 [72.5-81.8] | 72 [67.7-75.6] | 0.09 | |||
| BMI (kg/m2) | 20.9 [18.7-23.1] | 20.1 [19.1-21.7] | 0.62 | |||
| pH | 7.41 [7.39-7.42] | 7.39 [7.34-7.41] | 0.27 | |||
| PaO2 | 73.6 [68.0-91.6] | 96.8 [78.7-111.3] | 0.05 | |||
| PaCO2 | 38.1 [36.6-44.8] | 43.1 [37.3-57.7] | 0.16 | |||
| VC (L) | 2.59 [2.13-3.16] | 2.54 [2.05-2.95] | 0.75 | |||
| %VC (%) | 93.1 [82.2-102.8] | 78.9 [66.0-91.2] | 0.06 | |||
| FEV1 (L) | 1.40 [1.02-2.09] | 0.78 [0.43-1.61] | 0.17 | |||
| FEV1/FVC (%) | 63.6 [44.9-72.9] | 41.1 [32.5-65.2] | 0.44 | |||
| %FEV1 (%) | 75.6 [50.4-88.8] | 28.9 [20.1-58.9] | 0.02* |
Data are presented as median [95% confidence interval]. *p<0.05.
BMI: body mass index, VC: vital capacity, FEV1: forced expiratory volume in 1 second, FVC: forced vital capacity, %FEV1: percent predicted forced expiratory volume in 1 second
Figure 3.
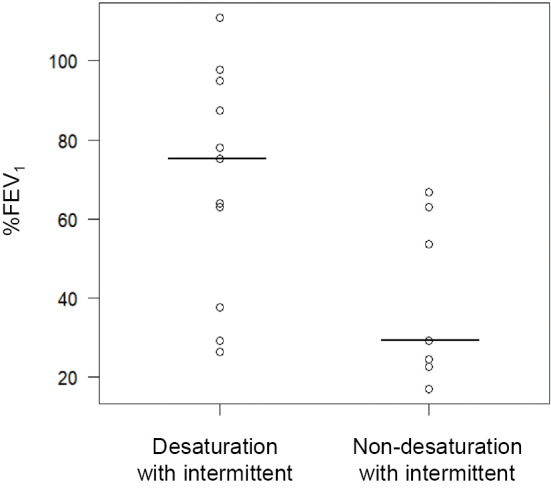
Dot plot of %FEV1 in COPD patients. %FEV1: percent predicted forced expiratory volume in 1 second
We also stratified patients with COPD into eight categories of desaturation and compared them (Fig. 4). There were no significant differences among the desaturation categories.
Figure 4.

Dot plot of the indicated parameters in COPD patients. Categories are described in the Patients and Methods. %FEV1: percent predicted forced expiratory volume in 1 second
A comparison of the desaturation patterns among patients with congestive heart failure
We evaluated patients with congestive heart failure, which is expected to affect nocturnal desaturation. Seven patients had heart failure, and we stratified patients based on the presence or absence of heart failure for each desaturation pattern. There were no significant differences among the patterns. Similarly, we stratified patients with COPD based on the presence or absence of heart failure for each desaturation pattern, again noting no significant differences among patterns.
Discussion
Treatment for nocturnal desaturation has not always improved patient outcomes. In addition, the pathophysiology of nocturnal desaturation other than that caused by sleep apnoea syndrome has not yet been verified. In the present study, we found that SpO2 waveforms obtained by portable oximetry were rich in diversity; however, we were still able to classify them into three elements using an automatic analysis algorithm. We further found that each waveform was composed of a combination of three elements: a periodic pattern, an intermittent pattern, and a sustained pattern. This classification of SpO2 waveforms might help clarify the pathology of nocturnal desaturation.
In the present study, we found that 23.8% of patients receiving HOT for chronic respiratory failure had nocturnal hypoxemia without daytime hypoxemia. In the nocturnal hypoxemia group, there were more patients with COPD than in the non-hypoxemia group (p=0.03), but there were no significant differences in the gender, age, BMI, lung function, or arterial blood gas findings between the two groups. Mulloy et al. (11) reported that a higher age, lower daytime PaO2, and higher daytime PaCO2 were risk factors for nocturnal hypoxemia in patients with COPD, but our study did not support their findings. This might be due to differences in the underlying lung diseases of the study participants.
In patients with COPD, in addition to the physiological changes in ventilation due to sleep, ventilation from the diaphragm is decreased due to hyperinflation of the lungs, and ventilation/perfusion ratio (V/Q) mismatch, which results from airflow limitation and emphysematous destruction of the pulmonary capillary bed, is worsened (12). Becker et al. (13) reported that minute ventilation can drop approximately 16% during non-REM sleep and 32% during REM sleep in patients with COPD. These mechanisms might explain why patients with COPD were prone to develop nocturnal hypoxemia.
As mentioned above, during REM sleep, desaturation tends to be caused by enhanced alveolar hypoventilation (so-called REM sleep-related hypoventilation) and exhibits the characteristic SpO2 pattern (14-17). We assume that the clinical condition of the periodic pattern reflects this REM sleep-related hypoventilation because it showed that the SpO2 dropped at a cycle of approximately 90-120 minutes, and the waveform was similar to that mentioned in previous reports (14-16). O'Donoghue et al. (18) reported that REM sleep-related hypoventilation was associated with daytime PaCO2 and a high BMI, but our study did not support their findings. This might be partly because the present study included a relatively small number of patients with COPD.
The intermittent pattern observed in the present study seems to reflect sleep apnoea. In the present study, 59.5% of participants had desaturation with an intermittent pattern. This is a high prevalence compared to the general population. We suspect that patients with chronic respiratory failure with a poor lung function can develop desaturation easily due to mild apnoea.
Among patients with COPD, desaturation with an intermittent pattern was found in 57.1%. A recent study reported that obstructive sleep apnoea (OSA) is highly prevalent in patients with moderate-to-severe COPD (19). In contrast, another study reported a lower prevalence of sleep apnoea [apnoea-hypopnea index (AHI) ≥15] in subjects with COPD than in those without COPD (20). This discrepancy might be because these studies adopted different criteria of OSA.
COPD has both promoting and protective factors against obstructive apnoea. Factors that may promote the development of OSA include rostral fluid shift during sleep when in the supine position (15). COPD is also associated with generalized muscle weakness, which can lead to upper airway collapsibility (21). In contrast, several factors related to COPD may protect against the development of OSA, including a low BMI and diminished REM sleep (15). In the present study, the higher the severity of COPD, the less desaturation with an intermittent pattern there was. However, there was no significant difference in the BMI or other factors. There is growing evidence that the lung hyperinflation associated with emphysema reduces the likelihood of OSA (22). It is expected that lung hyperinflation would be stronger in patients with severe COPD than in those without it, which might strongly influence the reduced desaturation with an intermittent pattern compared with other factors. The quality of sleep is reduced in severe COPD; for example, these patients often complain of nocturnal cough and dyspnoea, symptoms that lead to arousal. The segmentation of sleep leads to a decrease in REM sleep, and a reduction in REM sleep contributes to a decrease in apnoea.
The clinical condition of desaturation with a sustained pattern has not been clarified. This pattern, involving an SpO2 drop, does not recover for a long time. In the present study, there were no significant differences in the patient characteristics, lung function, or arterial blood gas findings between patients with and without this pattern. It is difficult to compare these patients' backgrounds due to the heterogeneity of the patient population. However, we suspect that the pattern would be observed in patients with severe respiratory disease whose hypoxic and hypercapnic ventilatory response of the respiratory centre is diminished.
In patients with COPD, we suspected that the degree of hypoxemia and desaturation pattern would differ by COPD severity, but there were no significant differences. This might be because the underlying pathophysiology of respiratory failure and hypoxemia was complex in this study, which included patients with lung disease other than COPD as well as those with heart failure.
The limitations of the present study are that the present study lacks some data on the flow rate of supplemental oxygen patients were receiving, the PaO2 data when HOT was prescribed, detailed pulmonary function test findings, computed tomography findings, modified British Medical Research Council dyspnea scale, COPD Assessment Test Score, polysomnography (PSG), and overnight transcutaneous carbon dioxide tension (PtcCO2); therefore, we are currently conducting clinical trials to assess the relationship between these parameters and algorithms in retrospective and prospective studies. In addition, the definition of desaturation pattern used here was generated by mechanical learning and needs to be validated in future prospective clinical trials. The criteria for physicians mentioned in the “Patients and Methods” also need to be improved by a clinical study. However, nocturnal desaturation is characterized by several patterns that have not been previously received focus, and we successfully classified patients as having these patterns using noninvasively obtained data. Further studies are needed to verify the pathophysiology of nocturnal desaturation.
Nocturnal desaturation has the potential to impact mortality, but appropriate treatment based on the pathophysiology has not been provided. As our study showed, SpO2 waveforms can differ among patients. Therefore, we believe that nocturnal desaturation includes several different pathophysiological types. By verifying the pathophysiology of nocturnal desaturation by the SpO2 wave pattern, we might be able to provide appropriate treatment and improve the prognosis, in a manner similar to the way that CPAP treatment has been shown to improve the prognosis of OSA (23).
Conclusion
In our study, we focused on nocturnal desaturation in patients with chronic respiratory disease receiving HOT and the classification of nocturnal desaturation. We found that the SpO2 waveform of nocturnal desaturation can be classified into three patterns: desaturation with a periodic pattern, desaturation with a sustained pattern, and desaturation with an intermittent pattern. The prognosis may be improved by suitable treatment tailored to each pattern. This was a small, observational study, so a large study will be needed to confirm the classification and clinical impact.
Author's disclosure of potential Conflicts of Interest (COI).
Yoshihiro Nishimura: Research funding, Teijin Pharma.
References
- 1. Fletcher EC, Miller J, Divine GW, Fletcher JG, Miller T. Nocturnal oxyhemoglobin desaturation in COPD patients with arterial oxygen tensions above 60 mm Hg. Chest 92: 604-608, 1987. [DOI] [PubMed] [Google Scholar]
- 2. Krachman S, Minai OA, Scharf SM. Sleep abnormalities and treatment in emphysema. Proc Am Thorac Soc 5: 536-542, 2008. [DOI] [PMC free article] [PubMed] [Google Scholar]
- 3. Owens RL, Malhotra A. Sleep-disordered breathing and COPD: the overlap syndrome. Respir Care 55: 1333-1344; discussion 1344-1346, 2010. [PMC free article] [PubMed] [Google Scholar]
- 4. Douglas NJ, White DP, Pickett CK, Weil JV, Zwillich CW. Respiration during sleep in normal man. Thorax 37: 840-844, 1982. [DOI] [PMC free article] [PubMed] [Google Scholar]
- 5. Carroll N, Walshaw MJ, Evans CC, Hind CR. Nocturnal oxygen desaturation in patients using long-term oxygen therapy for chronic airflow limitation. Respir Med 84: 199-201, 1990. [DOI] [PubMed] [Google Scholar]
- 6. McEvoy RD, Pierce RJ, Hillman D, et al. Nocturnal non-invasive nasal ventilation in stable hypercapnic COPD: a randomised controlled trial. Thorax 64: 561-566, 2009. [DOI] [PubMed] [Google Scholar]
- 7. Agusti A, Hedner J, Marin JM, Barbe F, Cazzola M, Rennard S. Night-time symptoms: a forgotten dimension of COPD. Eur Respir Review 20: 183-194, 2011. [DOI] [PMC free article] [PubMed] [Google Scholar]
- 8. Chaouat A, Weitzenblum E, Kessler R, et al. A randomized trial of nocturnal oxygen therapy in chronic obstructive pulmonary disease patients. Eur Respiratory J 14: 1002-1008, 1999. [DOI] [PubMed] [Google Scholar]
- 9. Izumi S, Nagano T, Yoshizaki A, Nishimura Y. Classification algorithm for nocturnal hypoxemia using nocturnal pulse oximetry. Annu Int Conf IEEE Eng Med Biol Soc 2019: 3662-3665, 2019. [DOI] [PubMed] [Google Scholar]
- 10. Viera AJ, Garrett JM. Understanding interobserver agreement: the kappa statistic. Fam Med 37: 360-363, 2005. [PubMed] [Google Scholar]
- 11. Mulloy E, McNicholas WT. Ventilation and gas exchange during sleep and exercise in severe COPD. Chest 109: 387-394, 1996. [DOI] [PubMed] [Google Scholar]
- 12. McNicholas WT, Verbraecken J, Marin JM. Sleep disorders in COPD: the forgotten dimension. Eur Respir Rev 22: 365-375, 2013. [DOI] [PMC free article] [PubMed] [Google Scholar]
- 13. Becker HF, Piper AJ, Flynn WE, et al. Breathing during sleep in patients with nocturnal desaturation. Am J Respir Crit Care Med 159: 112-118, 1999. [DOI] [PubMed] [Google Scholar]
- 14. Kitajima T, Marumo S, Shima H, et al. Clinical impact of episodic nocturnal hypercapnia and its treatment with noninvasive positive pressure ventilation in patients with stable advanced COPD. Int J Chron Obstruct Pulmon Dis 13: 843-853, 2018. [DOI] [PMC free article] [PubMed] [Google Scholar]
- 15. McNicholas WT. Chronic obstructive pulmonary disease and obstructive sleep apnoea-the overlap syndrome. J Thorac Dis 8: 236-242, 2016. [DOI] [PMC free article] [PubMed] [Google Scholar]
- 16. Boing S, Randerath WJ. Chronic hypoventilation syndromes and sleep-related hypoventilation. J Thorac Dis 7: 1273-1285, 2015. [DOI] [PMC free article] [PubMed] [Google Scholar]
- 17. Flenley DC. Sleep in chronic obstructive lung disease. Clin Chest Med 6: 651-661, 1985. [PubMed] [Google Scholar]
- 18. O'Donoghue FJ, Catcheside PG, Ellis EE, et al. Sleep hypoventilation in hypercapnic chronic obstructive pulmonary disease: prevalence and associated factors. Eur Respir J 21: 977-984, 2003. [DOI] [PubMed] [Google Scholar]
- 19. Soler X, Gaio E. High prevalence of obstructive sleep apnea in patients with moderate to severe chronic obstructive pulmonary disease. Ann Am Thorac Soc 12: 1219-1225, 2015. [DOI] [PMC free article] [PubMed] [Google Scholar]
- 20. Zhao YY, Blackwell T, Ensrud KE, Stone KL, Omachi TA, Redline S. Sleep apnea and obstructive airway disease in older men: outcomes of sleep disorders in older men study. Sleep 39: 1343-1351, 2016. [DOI] [PMC free article] [PubMed] [Google Scholar]
- 21. Budhiraja R, Siddiqi TA, Quan SF. Sleep disorders in chronic obstructive pulmonary disease: etiology, impact, and management. J Clin Sleep Med 11: 259-270, 2015. [DOI] [PMC free article] [PubMed] [Google Scholar]
- 22. McNicholas WT. COPD-OSA overlap syndrome: evolving evidence regarding epidemiology, clinical consequences, and management. Chest 152: 1318-1326, 2017. [DOI] [PubMed] [Google Scholar]
- 23. Marin JM, Soriano JB, Carrizo SJ, Boldova A, Celli BR. Outcomes in patients with chronic obstructive pulmonary disease and obstructive sleep apnea: the overlap syndrome. Am J Respir Critical Care Med 182: 325-331, 2010. [DOI] [PubMed] [Google Scholar]