

Abstract
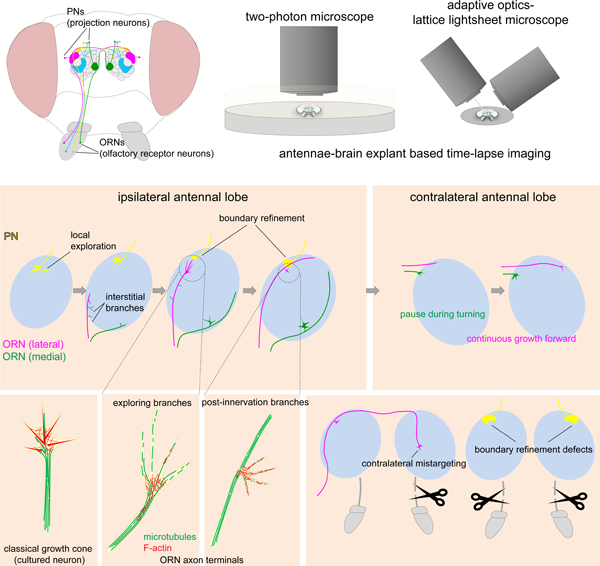
Neural circuit assembly features simultaneous targeting of numerous neuronal processes from constituent neuron types, yet the dynamics is poorly understood. Here, we use the Drosophila olfactory circuit to investigate dynamic cellular processes by which olfactory receptor neurons (ORNs) target axons precisely to specific glomeruli in the ipsi- and contralateral antennal lobes. Time-lapse imaging of individual axons from 30 ORN types revealed a rich diversity in extension speed, innervation timing, and ipsilateral branch locations, and identified that ipsilateral targeting occurs via stabilization of transient interstitial branches. Fast imaging using adaptive optics-corrected lattice light-sheet microscopy showed that upon approaching target, many ORN types exhibit “exploring branches” consisted of parallel microtubule-based terminal branches emanating from an F-actin-rich hub. Antennal nerve ablations uncovered essential roles for bilateral axons in contralateral target selection, and for ORN axons to facilitate dendritic refinement of postsynaptic partner neurons. Altogether, these observations provide cellular bases for wiring specificity establishment.
GRAPHICAL ABSTRACT
In Brief
Systematic time-lapse imaging of ~30 olfactory receptor neuron types during circuit assembly reveals dynamic process of axon guidance and target selection.
INTRODUCTION
The proper function of the nervous system relies on the precise assembly of neuronal circuits. During development, individual neurons extend their axons and dendrites to match with their synaptic partners. Axons are led by growth cones, which navigate through complex extracellular environment at each step of their journey. Numerous neurons are performing this act simultaneously within any given neural region. While great strides have been made in the past decades to identify molecules that control axon guidance, dendrite elaboration, and target selection (Jan and Jan, 2010; Kolodkin and Tessier-Lavigne, 2011; Sanes and Zipursky, 2020), the cellular contexts within which most wiring molecules act during circuit assembly are not well characterized.
Because of its high temporal resolution, time-lapse imaging has been utilized to define key cellular events in neuronal wiring. Notable examples include discovering growth cone dynamics in tissue culture (Harrison, 1910); identifying guidepost cells for axon guidance in grasshopper limb bud (Bentley and Caudy, 1983); characterizing growth cone dynamics of retinal ganglion cells at the optic chiasm in mice (Godement et al., 1994) or tectal targets in Xenopus (Harris et al., 1987); identifying repulsive interactions between sensory dendrites and axons that tile Drosophila, zebrafish, and C. elegans body surface (Grueber et al., 2003; Sagasti et al., 2005; Smith et al., 2010); investigating the relationship of dendritic growth and synapse formation in the fish and amphibian retinotectal systems (Niell et al., 2004; Haas et al., 2006); and defining the rules and molecular mechanisms of target selection for Drosophila photoreceptor axons (Langen et al., 2015; Akin and Zipursky, 2016). Most studies have focused on a single group of cells at a specific developmental stage. It remains unclear how growth cone dynamics of the same neuron change at different stages of circuit assembly, and the extent to which different types of neurons in the same circuit follow the same rules.
The Drosophila olfactory system has served as a model for investigating the mechanisms of neural circuit assembly. Axons of about 50 types of olfactory receptor neurons (ORNs) and dendrites of 50 types of projection neurons (PNs) form 1-to-1 connections in 50 discrete, stereotyped, and individually identifiable glomeruli in the antennal lobe to relay olfactory information from the periphery to the brain (Vosshall and Stocker, 2007). During the assembly of the adult olfactory system, PNs first extend dendrites to establish a coarse map (Jefferis et al., 2004). ORN axons then choose the dorsolateral or ventromedial trajectory to circumnavigate the antennal lobe, cross the midline, and invade the ipsi- and contralateral antennal lobes to find their synaptic partners (Jefferis et al., 2004; Joo et al., 2013; Figure 1A). A multitude of cellular and molecular mechanisms have been identified that direct dendrite and axon targeting of selected PN and ORN types (Hong and Luo, 2014); some mechanisms first discovered in the fly olfactory system were subsequently found to be conserved in wiring the mammalian brain (Hong et al., 2012; Berns et al., 2018). Still, we are far from understanding the developmental algorithms that orchestrate the precise wiring of 50 pairs of ORN and PN types. Time-lapse imaging can provide cellular context in which wiring molecules exert their functions. Moreover, the ease of identifying neuron types based on their glomerular targets can determine the degree to which different neuron types use the same wiring rules.
Figure 1. Antennae–brain explants enable live imaging of olfactory circuit assembly.
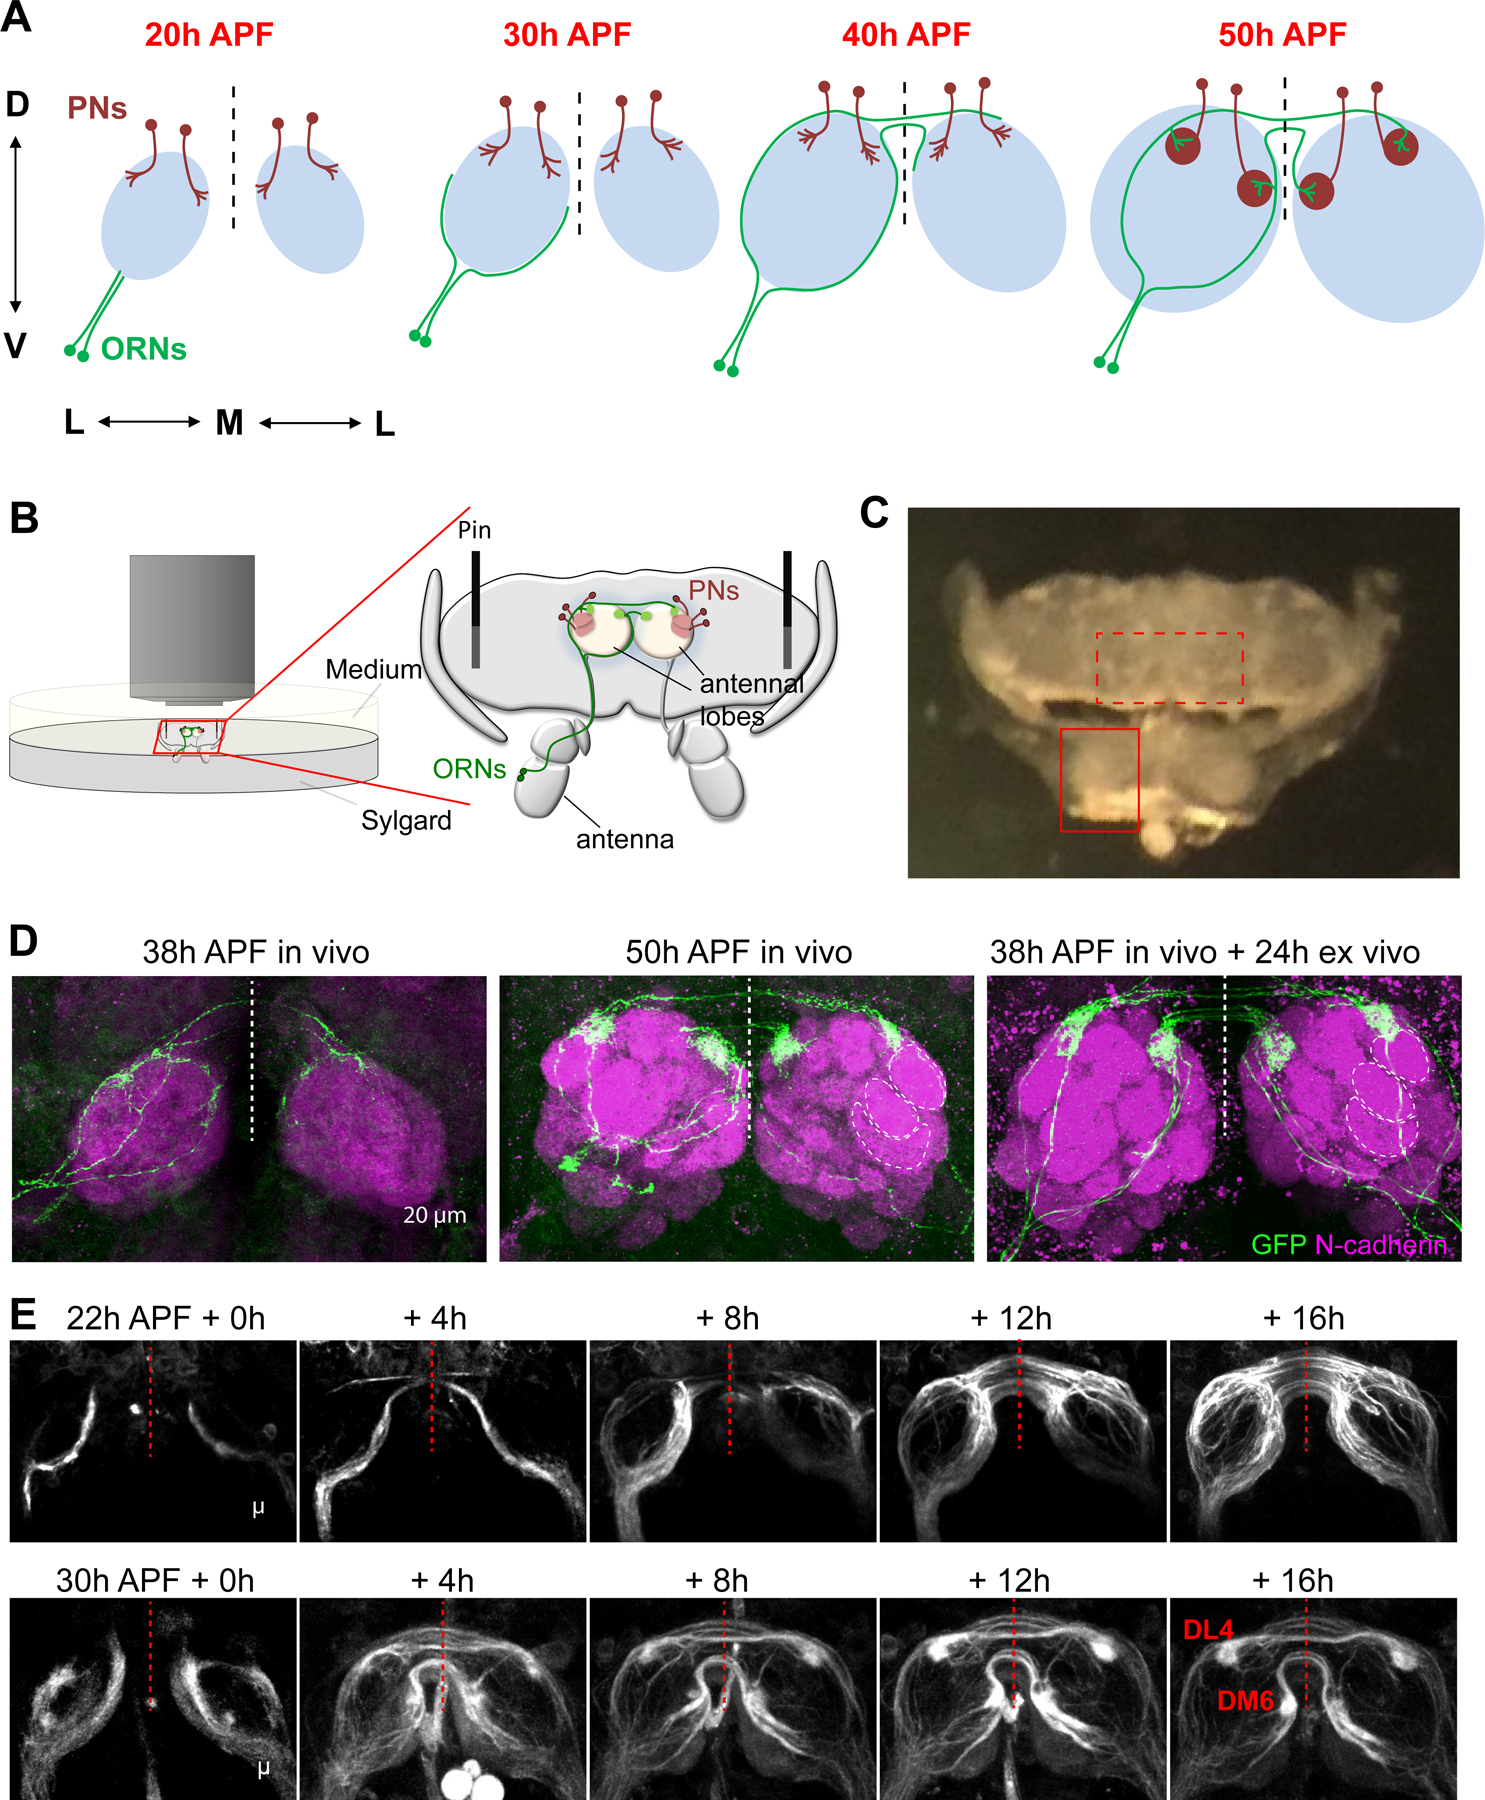
(A) Summary of olfactory circuit assembly. Abbreviation: ORN, olfactory receptor neuron; PN, projection neuron; h APF, hours after puparium formation; D, dorsal; V, ventral; M, medial; L, lateral. Dashed vertical line, midline of the brain.
(B) Schematic of imaging setting for the antennae–brain explant.
(C) A bright-field image of dissected antennae–brain explant, dorsal side up. Solid and dashed boxes mark one antenna and antennal lobes, respectively.
(D) Max intensity projections of confocal images from brains dissected at 38h APF (left), 50h APF (middle), and an explant dissected at 38h APF followed by 24h culture ex vivo (right). AM29-GAL4+ ORN axons are sparsely labeled by mCD8-GFP using MARCM. Neuropils are visualized by N-cadherin staining. Dashed circles mark the boundaries of DA1, VA1d, and VA1v glomeruli.
(E) Images from two-photon time-lapse videos at indicated times of AM29-GAL4;UAS-mCD8-GFP explants dissected at 22h and 30h APF. The DM6 and DL4 glomeruli are marked.
See Figure S1 for related data.
Here, based on a previous protocol for studying the fly visual system in explant cultures (Ozel et al., 2015), we developed an antennae–brain explant preparation that recapitulates the precision by which the olfactory circuit is assembled in vivo. Time-lapse imaging of 30 ORN types revealed heterogenous axon targeting behaviors that contribute to the eventual wiring specificity. High-resolution adaptive optics-lattice light-sheet microscopy (AO-LLSM) enabled us to discover an axon terminal structure prior to ORN axons reaching targets. We also found that cytoskeletal organization of ORN axon terminals differs substantially from that of the classic growth cones from neurons in primary culture. Finally, ORN axon ablation uncovered essential roles for bilateral ORN axons in contralateral target selection, and for ORN axons to facilitate dendritic refinement of PNs.
RESULTS
An antennae–brain explant system for time-lapse imaging of olfactory circuit assembly
The wiring specificity of the adult Drosophila olfactory circuit is established during the first half of the ~100-hour pupal stage (Jefferis et al., 2004), when the brain is covered with opaque fat bodies that prevent fluorescence imaging. To obtain high-quality images of the developing olfactory circuit from live tissues, we established an explant system containing the pupal brain, antennae, and their connecting nerves (Figure 1B–C). The dissected antennae–brain explant was then immobilized on a Sylgard plate and cultured for 24–48 hours.
To assess the degree to which olfactory circuit development ex vivo mimics in vivo conditions, we monitored targeting of single axons from two specific ORN types labeled by AM29-GAL4 (Endo et al., 2007) to the DL4 and DM6 glomeruli using the MARCM strategy (Lee and Luo, 1999). At 38 hours after puparium formation (h APF) in vivo, individual glomeruli had not developed and ORN axons were still finding their ways to the eventual targets (Figure 1D, left). At 50h APF in vivo, antennal lobes were substantially larger, glomeruli were individually identifiable by the neuropil staining, and axons of a given ORN type innervated one of 50 glomeruli in the ipsi- and contralateral antennal lobes (Figure 1D, middle). When we dissected brain and antennae at 38h APF and cultured the explant for 24h ex vivo, the antennal lobe volumes increased compared to 38h APF in vivo, individual glomeruli were readily identifiable, and AM29-GAL4+ ORN axons elaborate their terminals at positions similar to the DL4 and DM6 glomeruli in vivo (Figure 1D, right). AM29-GAL4+ ORN axons occasionally targeted regions outside the DM6 and DL4 glomeruli in culture (Figure S1A–B). Interestingly, minor targeting to similar regions was also observed in vivo during the intermediate developmental stages and became less frequent later (Figure S1A–B). These data indicate that the olfactory circuit develops similarly in our explant culture as in vivo, albeit at a slower pace (requiring about 2× the time).
To test whether the explant could be subjected to two-photon microscopy imaging, we imaged axons of all DM6 and DL4 ORNs (Figure 1E; Movie 1) or axons of all ORN types (Figure S1C). The growth and targeting of ORN axons were not disrupted by continuous imaging for 24h once every 20 min, suggesting little photodamage at this imaging frequency. Thus, this explant system can be used for long-term live imaging study of olfactory circuit assembly.
Imaging glomerular targeting of individual ORNs
We next attempted to live image individual axons of multiple ORN types. Each ORN type comprises on average ~30 ORNs from each antenna, making it impossible to distinguish single ORN terminals even with a GAL4 line that only labels one ORN type. To achieve sparse and strong labeling from early development, we modified the FLPout strategy (Wong et al., 2002) by using FRT sites with reduced recombination efficiency (Figure 2A). By introducing point mutations in FRT (Senecoff et al., 1988), we generated two reporters, UAS-FRT10-stop-FRT10-mCD8-GFP (Figure S1D) and UAS-FRT100-stop-FRT100-mCD8-GFP (Figure 2B), which were about 10× and 100× less efficient than wild-type FLP/FRT, respectively.
Figure 2. Live imaging glomerular targeting of single axons of multiple ORN types.
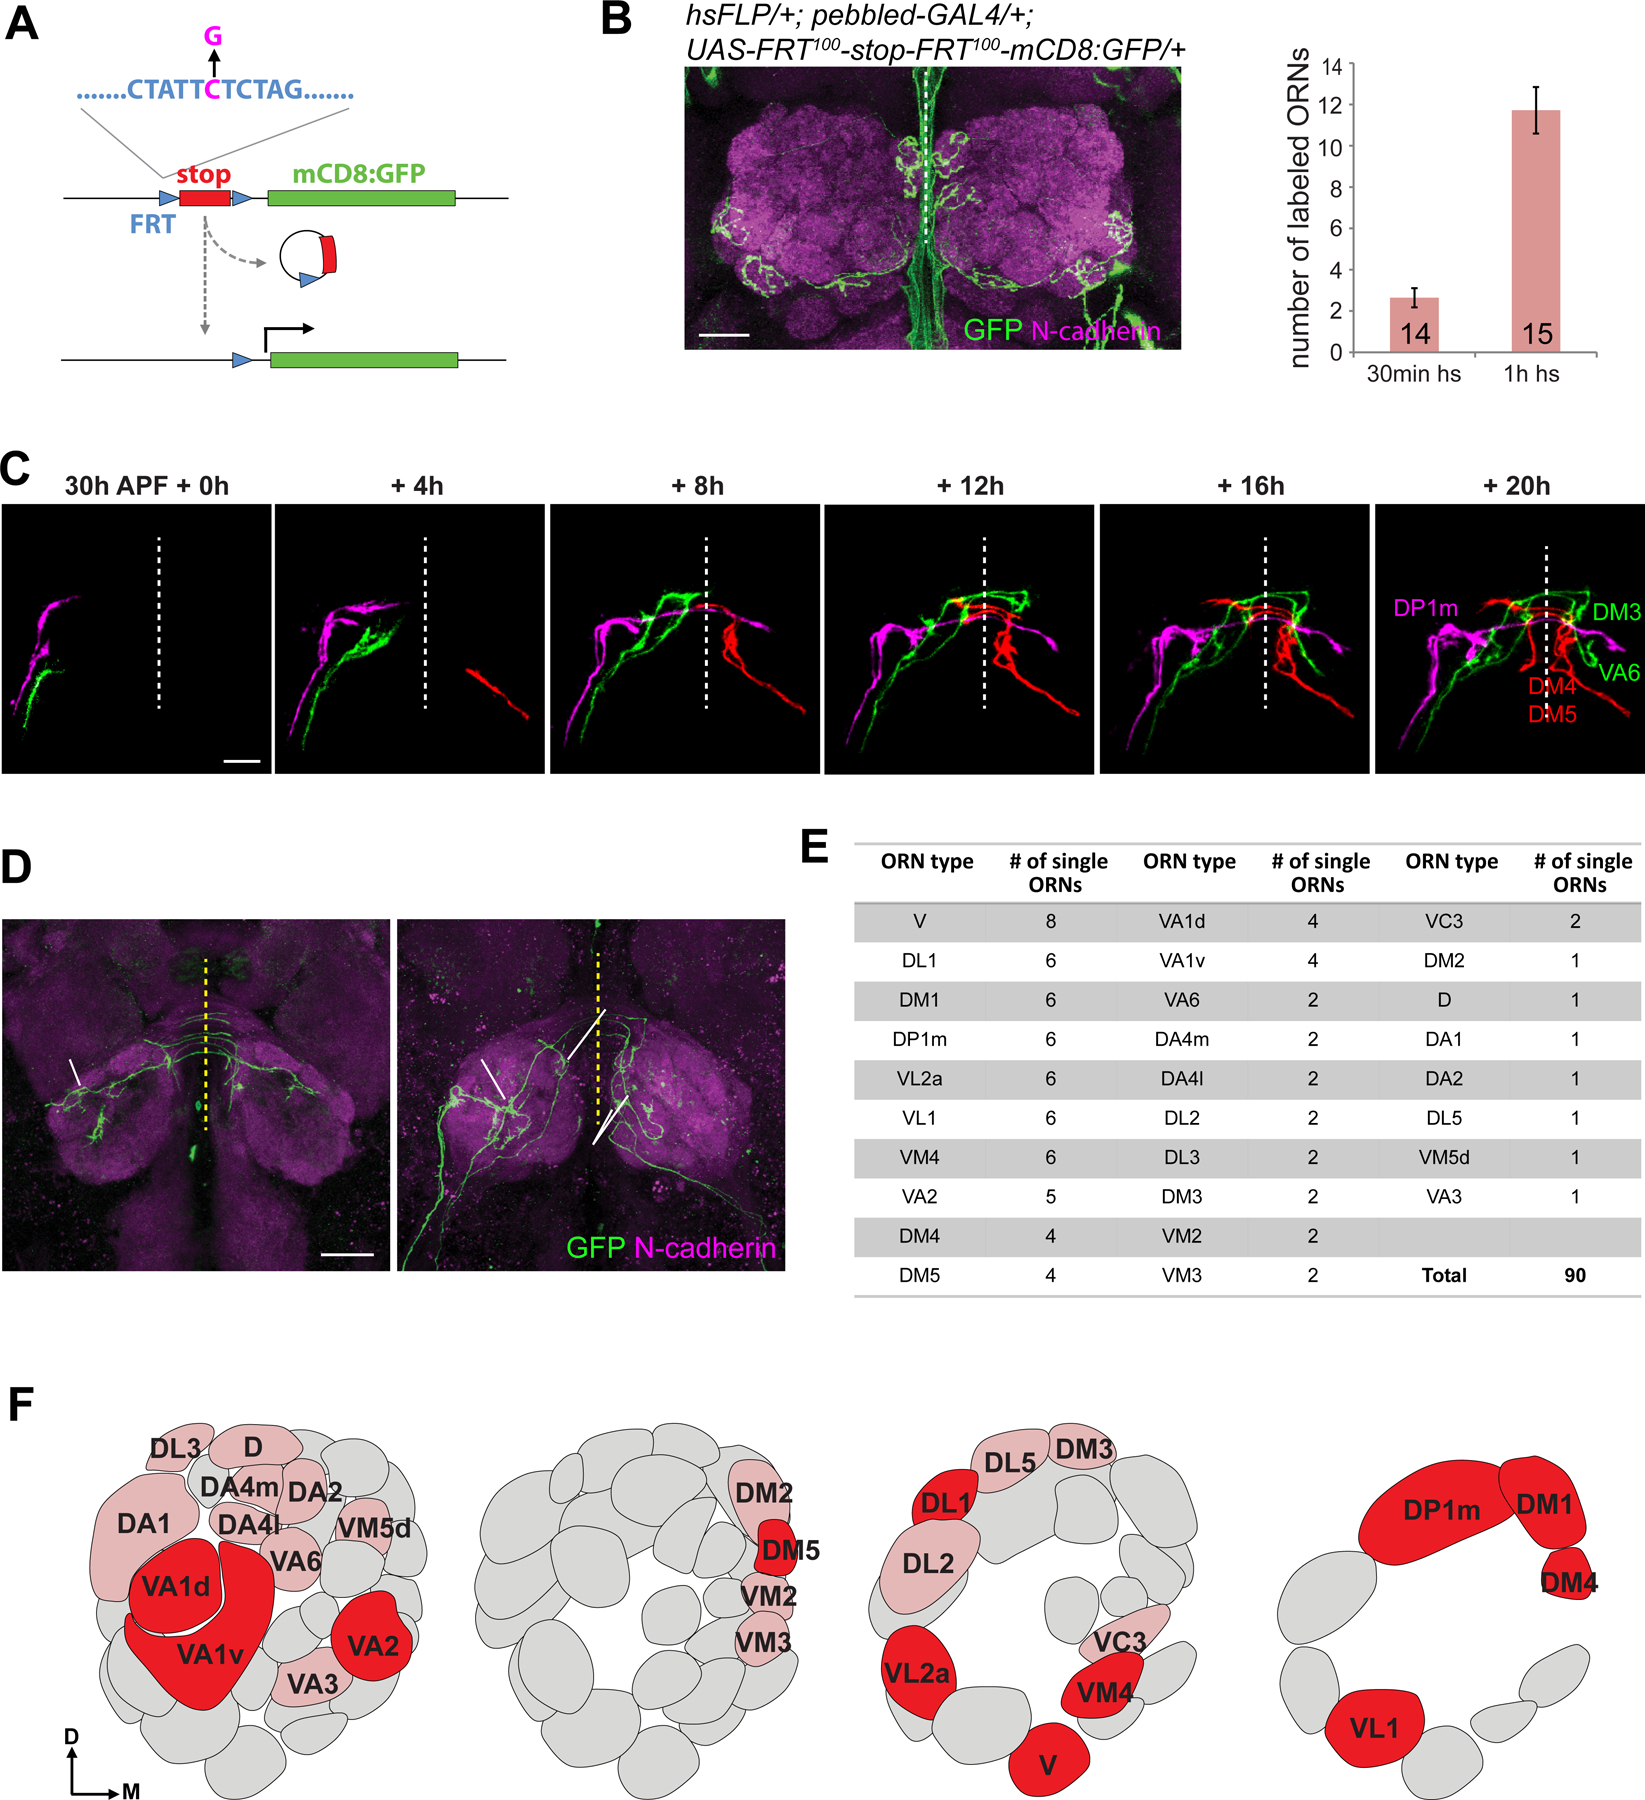
(A) Strategy of sparse labeling using FLPout with mutant FRT sites with reduced recombination efficiency. The C→G mutation (magenta) reduces recombination efficiency by ~100 fold.
(B) Max intensity projections of confocal images showing four ORNs labeled in an adult brain (genotype on top) after heat shock for 30 min at 0h APF (left). The number of labeled ORNs are quantified by different times of heat shock (hs, right). Green signal near the midline is non-specific. Error bars, SEM.
(C) Example images from two-photon time-lapse videos at the indicated times of sparsely labeled ORN axons in explant (same genotype as B). Axons from different ORNs were followed through time-lapse videos and pseudocolored manually.
(D) Max intensity projections of confocal images of the posterior and anterior antennal lobes from the fixed explant shown in (C) following 24h culture. ORN types were identified by their glomerular targets.
(E) Summary of single ORNs live-imaged for each type; numbers indicate imaged ORNs per type.
(F) An antennal lobe map with glomeruli corresponding to imaged ORNs labeled. Dark and light red glomeruli represent ORN types with ≥3 and <3 ORNs imaged, respectively.
See Figures S2 and S3 for related data.
Using UAS-FRT100-stop-FRT100-mCD8-GFP, we could randomly label a few ORNs out of ~1500 per antenna expressing mCD8-GFP driven by the pan-ORN pebbled-GAL4 driver via heat shock-induced FLP expression (Figure 2B). From ~1000 pupal brain dissected at 30h APF, we selected 75 brains in which one or few axons just arrived at the antennal lobe. We performed time-lapse imaging in explant culture once every 20 min for the next 24h, covering the entire targeting process in the antennal lobe (Figure 2C). The identity of each ORN was determined by post hoc immunostaining of the fixed explants (Figure 2D). We extracted 90 single ORNs from these 75 brains, covering 28 ORN types (Figure 2E–F, S2A; Movie 2). These time-lapse images provided a valuable dataset to analyze how individual ORN axons find their targets, as detailed in the next four sections.
Axons of different ORN types reach the antennal lobe following a temporal sequence
The 90 single ORNs we selected based on axon arrival at the antennal lobe at 30h APF covered only a subset of ORN types with different frequencies (Figure 2E–F), suggesting heterogeneity in axon arrival time for different ORN types. To extend this finding, we compared explant cultures initiated at 26h, 30h, and 34h APF, and determined the glomerular identity after 24–48h culture (Figure S3A). We found that early-arriving ORN axons tended to target more posterior glomeruli, while late-arriving ORN axons tended to target more anterior glomeruli (Figure S3B–C). This temporal sequence did not appear to result from ORN birth timing (Figure S3D) but is consistent with a previous report using two genetic drivers (Okumura et al., 2016). Thus, different ORN types not only target axons to spatially segregated glomeruli, but their axons also arrive at the antennal lobe following a temporal sequence. This temporal segregation should reduce the complexity of cellular context with which axons of each ORN type interact as they navigate.
ORN axon growth slows down at specific choice points
Previous live imaging studies reported that axons slow down at specific choice points (Godement et al., 1994; Hutson and Chien, 2002; Bak and Fraser, 2003). To examine whether ORN axons change speed during their journey, we measured the axon growth speed of 5 ORN types that had more than 3 samples, targeting three lateral glomeruli (green shades in Figure 3A, B) and two medial glomeruli (red and magenta in Figure 3A–B). To analyze ORN axon growth in the ipsilateral antennal lobe, we defined the last imaging scan before midline crossing as time 0. We found that ORN axons grew at an average speed of 2–6 µm/20 min interval when they circumnavigated the ipsilateral antennal lobe (Figure 3B, left). This speed reduced to 0–2 µm/20 min right before midline crossing for all 5 types (solid arrow in Figure 3A, B).
Figure 3. Quantitative analysis of axon targeting from time-lapse imaging of single ORN axons.
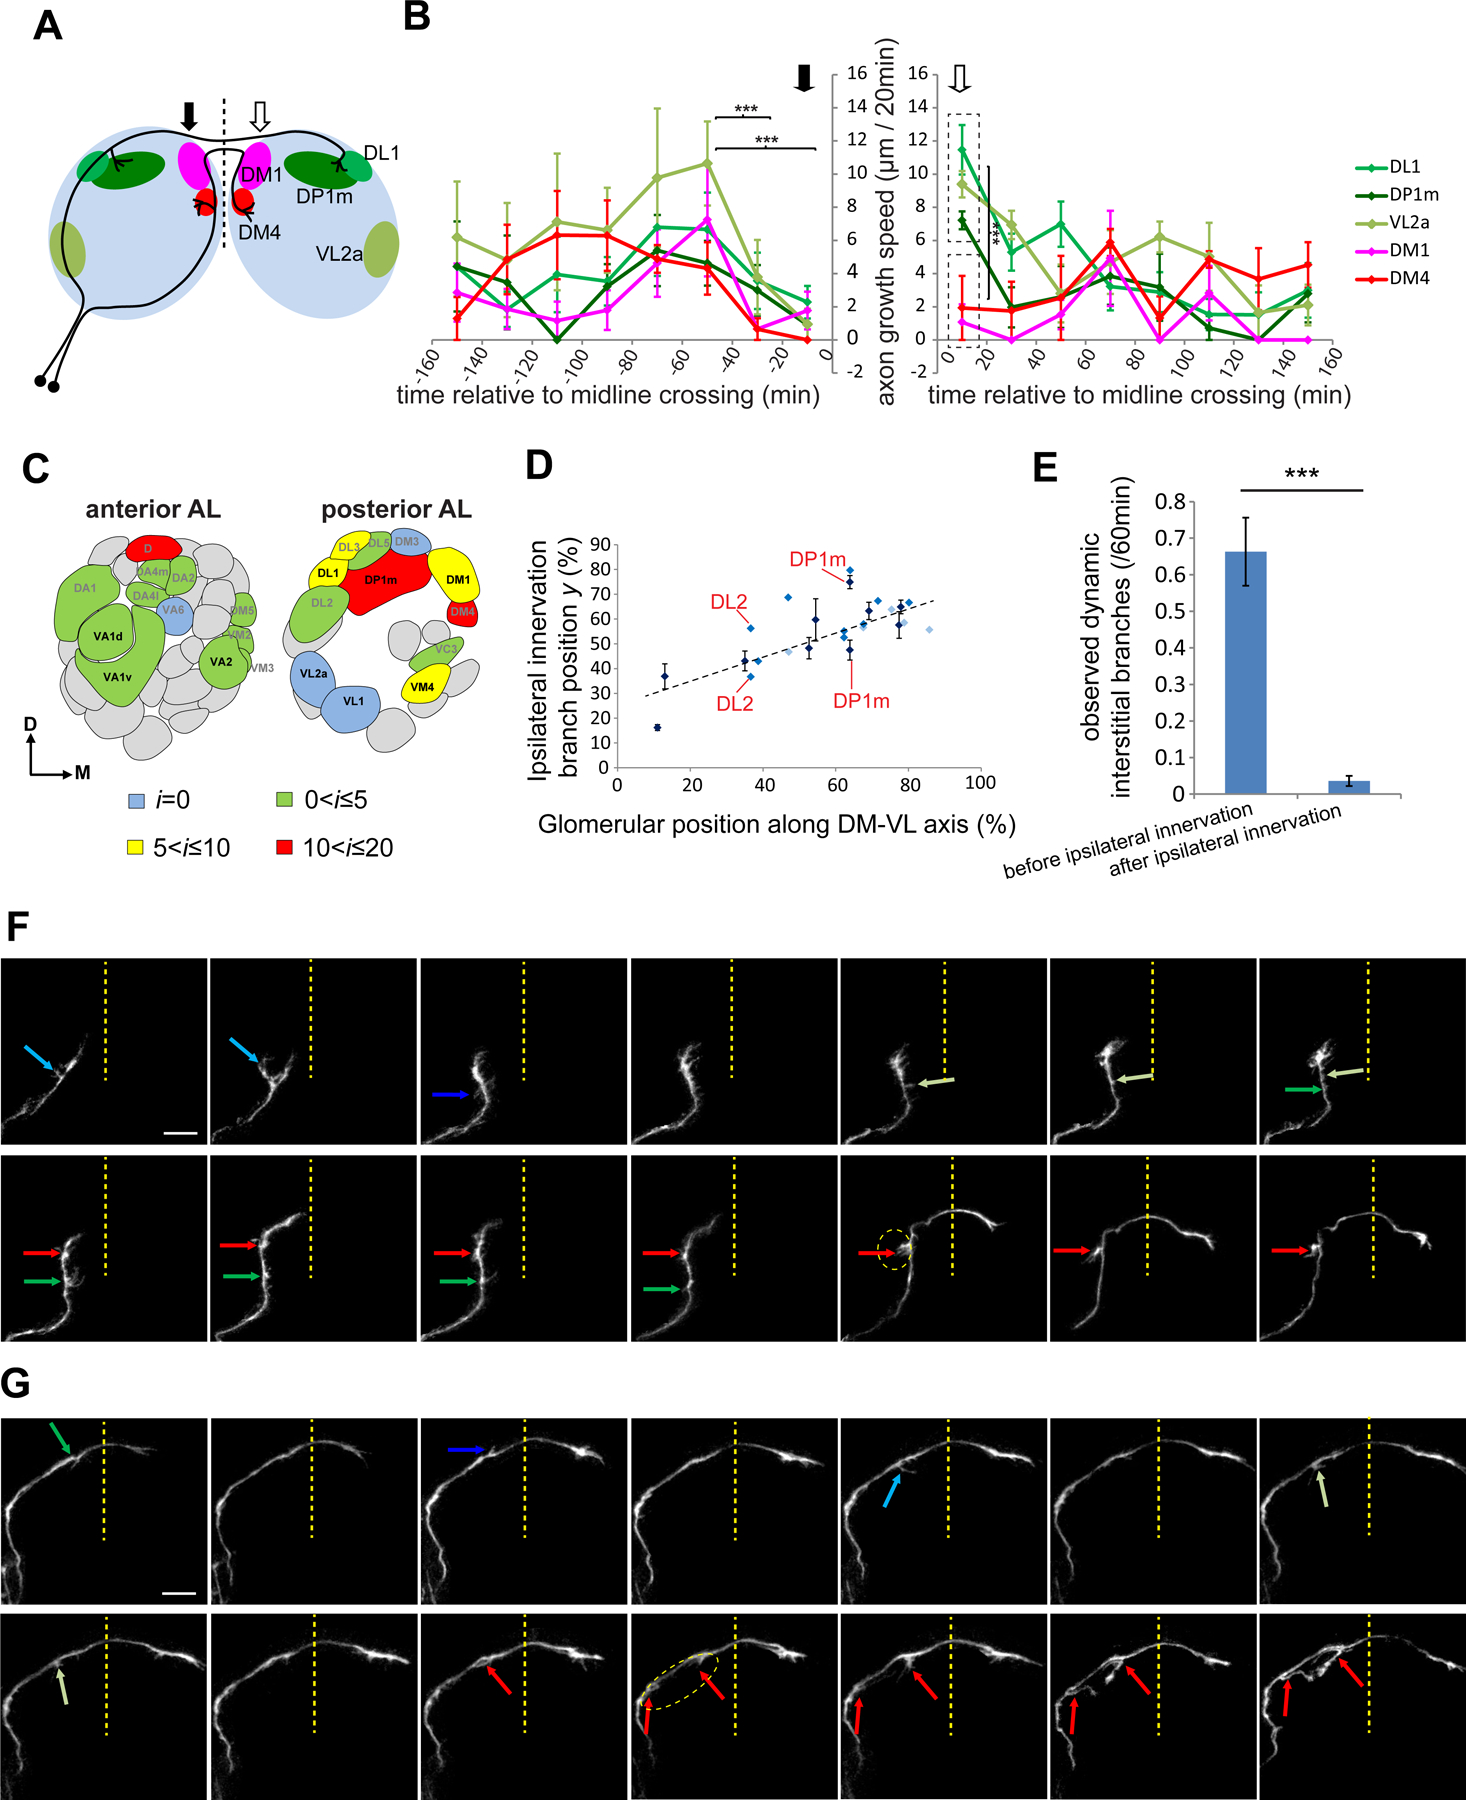
(A) Antennal lobe map showing five glomeruli in different colors. Solid and open arrows mark regions before and after the midline crossing, respectively.
(B) Axon growth speed of the 5 ORN types in (A) relative to midline crossing. Solid and open arrows mark times before and after midline crossing, respectively. Asterisks in the left graph show statistical significance of the growth speed from all types between corresponding time windows (two-way ANOVA). Asterisks in the right graph show statistical significance between the growth speed of DL1/DP1m/VL2a axons and DM1/DM4 axons within the same time window (0–20 min; t-test). Error bars, SEM. ***: P<0.001. n = 5 and 4 for DL1 ORNs and all other ORN types, respectively.
(C) Distribution of ORN types with different average i on a glomerular map, quantified from 90 single ORNs imaged. Types with n ≥ 3 ORNs quantified are shown in black. Kruskal-Wallis nonparametric ANOVA indicates significant difference for i from 8 ORN types with n ≥ 3 (p=0.0005).
(D) Scatter plot of correlation between the centroid position of each glomerulus along the dorsomedial–ventrolateral (DM–VL) axis of the adult antennal lobe and the ipsilateral innervation branch position y (see Figure S5B). Dark, medium and light blue dots indicate ORN types with ≥ 3 (mean ± SEM), 2 and 1 sample in our collection, respectively. DL2 and DP1m have two ipsilateral branch points and are indicated in the plot.
(E) Quantification of transient interstitial branches before and after ipsilateral innervation quantified from time-lapse imaging of single ORNs. Error bars, SEM. t-test; ***, P<0.001.
(F, G) Time-lapse images of a DA2 (F) and a DP1m (G) axon at the indicated time points. Green and blue arrows denote different transient interstitial branches. Red arrows mark branches that innervate glomeruli at the end. Dashed circles outline the target glomeruli.
See Figures S4 and S5 for related data.
To analyze ORN axon growth in the contralateral antennal lobe, we defined the time of first imaging scan after midline crossing as time 0. Right after midline crossing (open arrow in Figure 3A–B), axon growth differed depending on their target locations. The growth cones of ORNs targeting the lateral antennal lobe, which do not need to make a turn, had needle-like shape (Figure S4A–B) and grew fast (~10 µm/20 min). By contrast, the growth cones of ORN axons targeting the medial antennal lobe, which requires a ~90º turn ventrally, exhibited more complex morphologies with multiple transient branches (Figure S4A‘–B) and grew slower (Figure 3B, right). Thus, ORN axon growth slows down prior to midline crossing and during large turns in their trajectory.
ORNs innervate ipsilateral glomeruli predominantly via interstitial branching
Selective axon branching enables the same neuron to innervate multiple targets. Axon branching can occur via growth cone splitting or interstitial branching (Figure S4C). Interstitial branching occurs widely in vertebrate CNS neurons, but axons of dorsal root ganglia sensory neurons branch by growth cone splitting (Kalil and Dent, 2014). Since most ORN axons innervate the same glomerulus in both the ipsi- and contralateral antennal lobe (Lin et al., 2018), each ORN must send one branch to innervate the ipsilateral glomerulus (ipsilateral branch hereafter) and another branch to cross the midline and innervate the contralateral glomerulus (Figure 1A).
To determine the cellular mechanism of ORN axon branching, we measured from our time-lapse series the interval between when the axon reached its eventual ipsilateral branch point and the first appearance of the ipsilateral branch (i, see Figure S4D). If branches form by growth cone splitting, they should form at the most terminal end of the axons. Thus, as soon as the contralateral projecting axon passes the eventual ipsilateral branch point, we should observe the ipsilateral branch (i should be 0). However, most of the 90 single ORNs formed the ipsilateral branch with i ≥ 1 (Figure 3C). Thus, most ORN axons innervate their ipsilateral glomeruli via interstitial branching.
Three ORN types had i = 0 (Figure 3C, S4D), suggesting that they could branch via growth cone splitting, or that interstitial branching occurred within a 20-min imaging session after the growth cone passed the branch point. (Fast imaging data presented below suggest the latter is the case.) We note that i values have large variations among different ORN types (Figure 3C), and ORN types with early-arriving axons tended to have larger i than those with late-arriving axons (Figure S4E). Accordingly, ORNs with smaller i exhibited sequential innervation in the two antennal lobes (Figure S4F), while ORNs with large i showed more synchronized innervation in the two antennal lobes (Figure S4G).
ORN axons form ipsilateral branches by stabilizing dynamic interstitial branches close to targets
Determining the spatiotemporal dynamics of the ipsilateral branch formation can suggest target selection mechanisms. A priori, several mechanisms can be envisioned. (1) The branch point of a given ORN type is genetically specified to be closest to the final glomerular target, such that the ipsilateral branch has the shortest distance to travel (Figure S5A1). (2) The branch point may be random, and the ipsilateral branch explores a large region before reaching its target (Figure S5A2). (3) ORN axons produce transient interstitial branches at multiple locations and stabilize the branches that connect with the target (Figure S5A3). To distinguish between these models, we first measured the ipsilateral branch point position with respect to the entire ipsilateral trajectory from 0 (antennal lobe entry point) to 100 (midline crossing point) using ipsilateral branch point index y (Figure S5B–D). Comparing y and glomerular location in the adult antennal lobe revealed that ORNs targeting axons to increasingly dorsomedial glomeruli had increasingly larger y (Figure 3D, S5D), suggesting that ORN axons form ipsilateral branches close to their future glomerular targets.
Closer examinations of our time-lapse movies revealed that all ORN axons exhibited multiple transient interstitial branches in the ipsilateral antennal lobe before the innervation of ipsilateral glomeruli. These interstitial branches occurred much less frequently after the ipsilateral branch reached the target (Figure 3E). For ORN types that formed the ipsilateral branch shortly after the main axon passed the ipsilateral branching point (small i in Figure 3C), dynamic interstitial branches disappeared soon after the ipsilateral branch reached the ipsilateral target region (Figure 3F). For ORN types that had delayed ipsilateral branch formation (large i in Figure 3C), dynamic interstitial branches persisted well after the contralateral branch crossed the midline (Movie 3; Figure 3G). These observations suggest that ipsilateral branches form via stabilization of dynamic interstitial branches by target-derived signals, which in turn inhibits further interstitial branching. This mechanism explains the correlation of branching points and glomerular positions (Figure 3D).
In addition to the dynamic interstitial branches, we also observed highly dynamic growth of ipsilateral branches toward the final targeting regions (Figure S5F–G). While individual neurons of a given ORN type exhibited certain stereotypy—DL1 axons extended ventromedially towards their target, while DM1 axons hugged around the branching points because of the proximity of the target to the main ORN axon trajectory—they also exhibited considerable variation in detailed branching patterns across time. Both DL1 and DM1 ipsilateral branches exhibited dynamic extension and retraction (arrows in Figure S5F–G) instead of steady growth towards target, suggesting that they were actively exploring the local region for target selections.
After midline crossing, contralateral axons of most ORN types followed the ipsilateral axon trajectory of their counterparts and stopped near their targets (Figure S2A; Movie 2). In a subset of ORNs, contralateral axons overshot their targets followed by pruning (Movie 4; Figure S5E).
AO-LLSM imaging reveals “exploring branches” of ORN axons before glomerular innervation
The scanning speed of two-photon imaging limited our ability to examine rapid dynamics of axon terminals. We next utilized AO-LLSM, which can adaptively correct for optical aberrations caused by the live brain tissues and enables noninvasive volumetric imaging at higher spatiotemporal resolution (Chen et al., 2014; Wang et al., 2014; Liu et al., 2018). To label the fine structure of single ORN terminals and to increase photostability of the fluorophore, we expressed membrane-targeted Halo-tag (Kohl et al., 2014; Sutcliffe et al., 2017) in pebbled-GAL4-based MARCM clones followed by incubation with Halo-tag ligand (Grimm et al., 2017) in explant culture media (STAR Methods). To capture rapid dynamics at different stages of development, we imaged every 30 sec for 14.5 min (Movie 5) followed by a break of 1 h 45.5 min, repeating this procedure for 24h (Figure 4A). The explant was cultured for another 24h before fixing and counter-staining to reveal the glomerular type of labeled ORNs. The adaptive optics correction improved the spatial resolution of individual axon branches (Figure 4B), and in combination with fast imaging allowed us to capture rapid changes of the fine structure in axon terminals (Figure 4C).
Figure 4. AO-LLSM imaging reveals exploring branches of ORN axons.
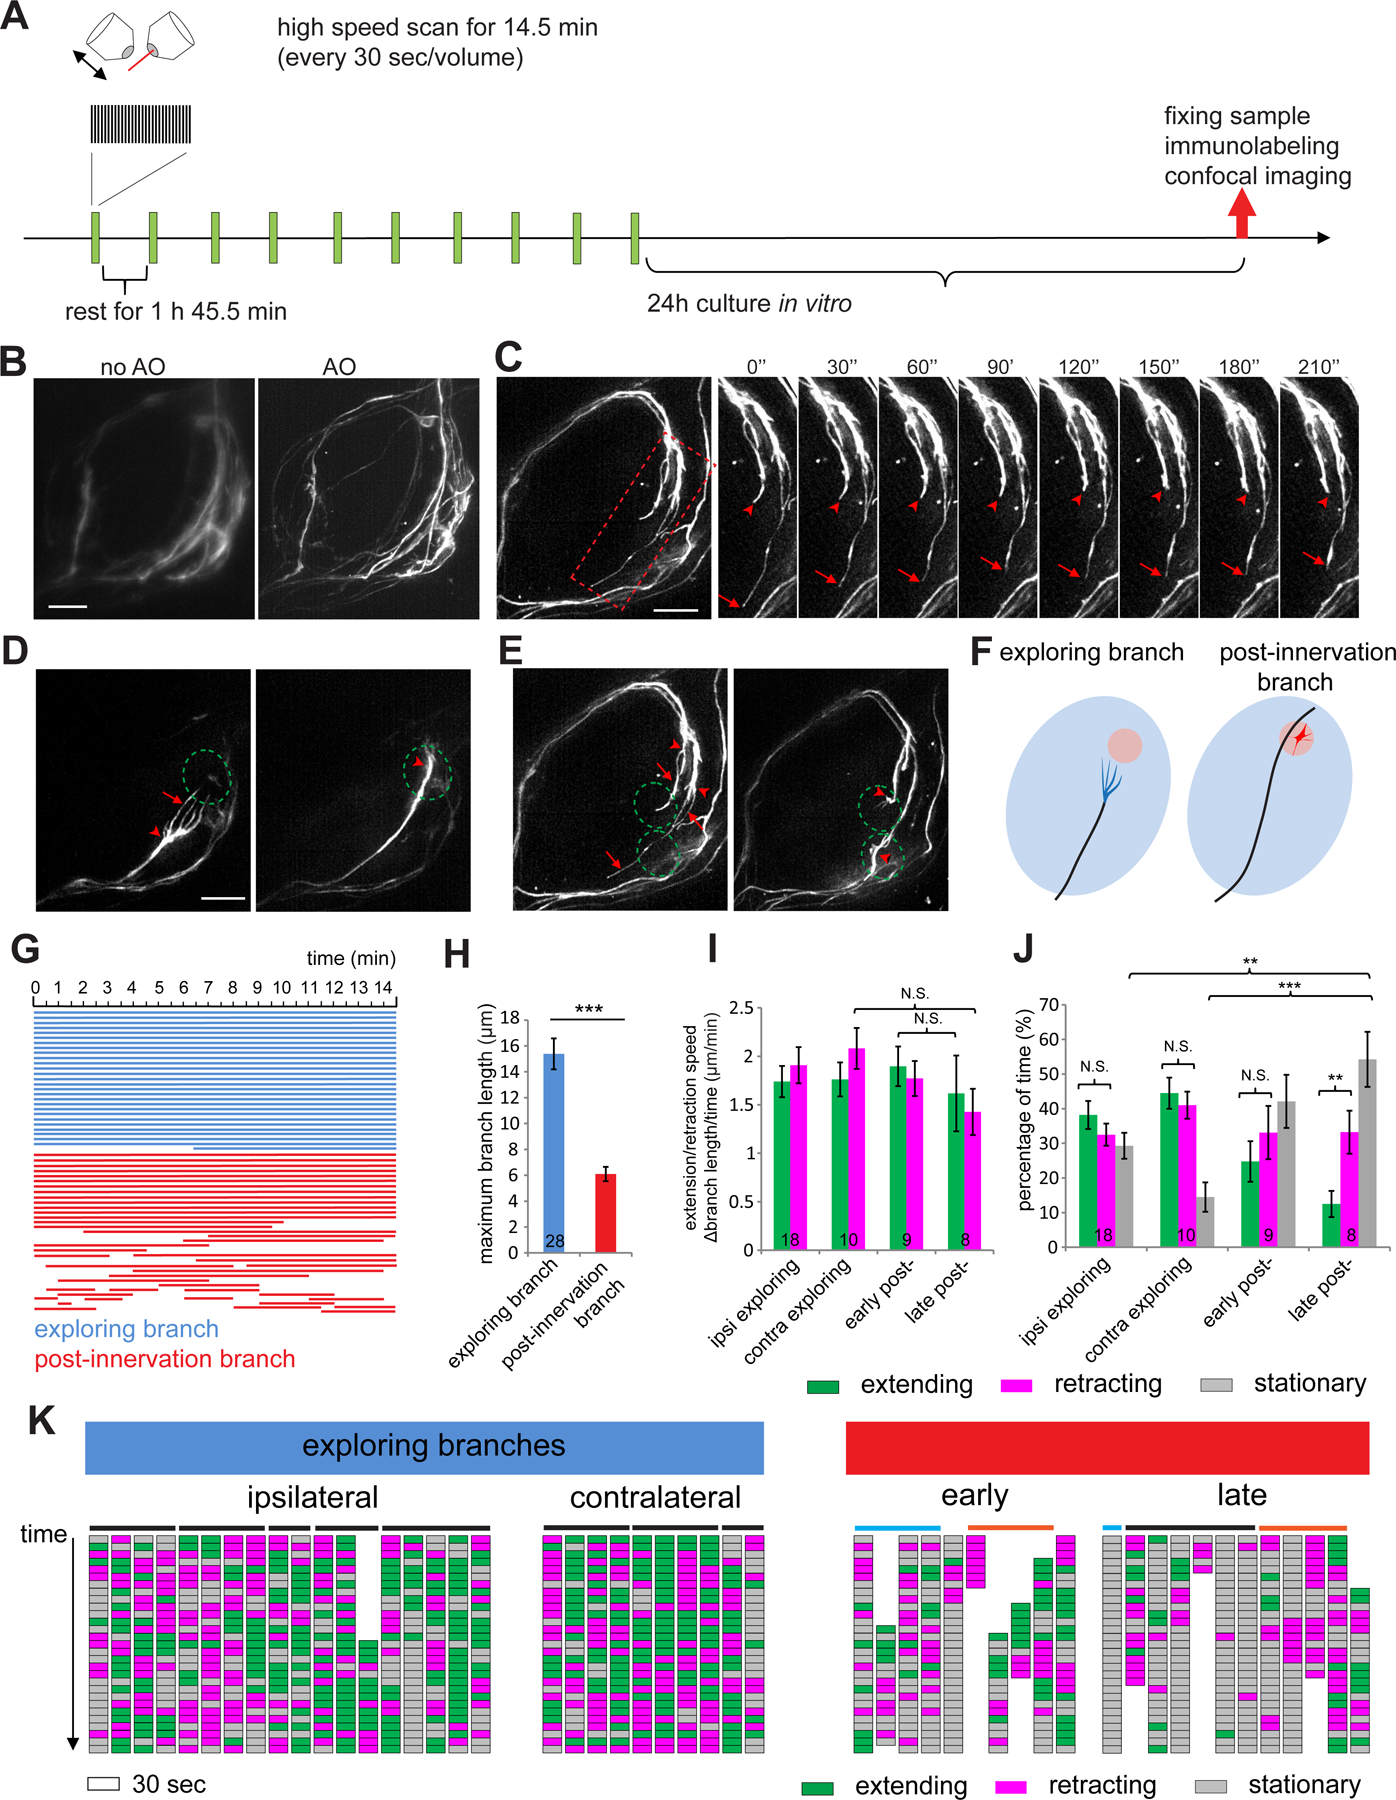
(A) Schematic of the AO-LLSM imaging procedure.
(B) Two max intensity projections of the same imaged volume of an antennal lobe taken by LLSM without and with adaptive optics (AO) correction.
(C) Max intensity projection images taken with AO-LLSM every 30 seconds. Time series are from the rectangular box in the still image on the left. Arrows and arrowheads denote the ends of two terminal branches.
(D, E) Max intensity projection images taken 2h apart from two antennal lobes. Arrows indicate exploring branches and arrowheads mark the hubs where terminal branches converge. Dashed circles denote the future glomeruli. (E) is the same as (C), with two target glomeruli for two ORN axons outlined.
(F) Schematic of exploring branches (blue) and post-innervation branches (red).
(G) Lifetime of exploring branches (blue) or post-innervation branches (red). Each line indicates a branch. The length indicates the time when the branch exists within a fast scanning session.
(H) Quantification of the maximal length of exploring branches or post-innervation branches during the 14.5-min fast scanning sessions. Numbers are branches quantified (same in I, J). Error bars, SEM. t-test; ***, P<0.001.
(I, J) Extension/retraction speed of branches and the portions of extending, retracting, or stationary phase from (K). Numbers are quantified branches belonging to different categories as indicated. Statistics between different groups of branches were done using one-way ANOVA. Statistics between the extending and retracting time fraction within the same group of branches in (J) were done using paired t-test. The significance in paired t-test was based on P(T⩽t) two tails. Error bars, SEM. N.S., P > 0.05; **, P<0.01; ***, P<0.001.
(K) Each column indicates the status of a single branch across a 14.5-min fast scanning session. Each block indicates a 30-sec period. Branches not present for the entire 14.5-min session are partially represented along the top-bottom axis. Horizontal bars on top link branches from the same axon terminals. Post-innervation branches from the same axon in the early and late stages are indicated by cyan or orange bars.
See Figure S6 for related data.
The enhanced spatiotemporal resolution of AO-LLSM confirmed that ipsilateral innervation occurred via interstitial branching from the contralaterally-projecting axon after the growth cone passed the glomerulus for most ORN types (Figure S6A, green in Figure S6C–D). In the few cases where i = 0 in our two-photon imaging study (Figure 3C), we found that the growth cone first innervated the glomerulus, followed by an interstitial branch growing towards the midline that eventually innervated the contralateral antennal lobe (Figure S6B, red in Figure S6C–D). Thus, interstitial branching appears to be a universal rule of ORN axon branching.
When extending along the surface of the antennal lobe, ORN axon terminals usually exhibited simple, needle-like shape. However, we observed a multi-branched terminal structure when ORN axons approached their targets (Figure 4D–E; Movie 5). We captured this multi-branched terminal in ~40% of ORN axons imaged within the appropriate developmental stages, belonging to multiple ORN types (Figure S6E). Most observations in ipsilateral antennal lobe belonged to ORN types with relatively short waiting time of producing the ipsilateral branch (i < 5 in Figure 3C). Typically, 2–5 branches extended from a single axon (Figure S6F). We named these “exploring branches”. The exploring branches existed transiently before the axon reached the target (Figure 4D–F, left) and disappeared soon after the axon terminal reached the target (Figure 4D–F, right). At the target region, ORN axon terminals exhibited shorter branches we named “post-innervation branches” (Figure 4F, right). Exploring branches had longer lifetime than post-innervation branches (Figure 4G).
The high temporal resolution of AO-LLSM enabled us to analyze the dynamic features of each exploring branch or post-innervation branch. We selected strongly labeled axons and measured the length of each branch across time. Exploring branches had larger maximal length than post-innervation branches (Figure 4H). We categorized each 30-sec imaging interval as extending or retracting if it was part of a time window when the branch continuously extended or retracted to more than 0.5 μm. Otherwise, we defined it as stationary. We separately quantified exploring branches, early post-innervation branches (the first 14.5 minutes imaging period after initial target innervation), and late post-innervation branches (4–6 hours after early post-innervation branches) to assess if terminal dynamics change as the axons mature. The speed of extension and retraction, at 1.5–2 µm/min, were similar for both branches in all stages (Figure 4I). However, exploring branches spent more time extending or retracting than post-innervation branches, resulting in fewer stationary periods (Figure 4J–K). Moreover, extension and retraction in different branches of the same axon terminals appeared to be independent of each other (Figure 4K), supporting the notion that the behavior of each branch is determined by the microenvironment it samples. The late post-innervation branches exhibited the largest stationary periods, suggesting axon terminal branches become more stable as they mature. While the exploring branches exhibited comparable extending and retracting periods, the post-innervation branches exhibited more retracting periods as they matured (Figure 4J). In rare cases when we captured the retraction of most branches within one fast imaging period, we found that different branches retracted asynchronously (Figure S6G).
In summary, AO-LLSM imaging allowed us to identify an unusual exploring branch structure prior to glomeruli innervation. Analysis of branch dynamics across different developmental stages revealed a shift of axon terminal branches from exploration mediated by both branch extension and retraction to a retraction-dominated pruning. A previous study showed that during Xenopus retinal axon arborization, the terminal arbor branching complexity is built by more protrusions being added than retracted over time (Wong et al., 2017); this may correspond to an earlier stage of development than the late-stage post-innervation branches we analyzed.
Cytoskeletal organizations of ORN axon terminals differ from those of cultured neurons
Given the unusual structure and properties of the exploring branches, we next examined their cytoskeletal organization and compared with that of the post-innervation branches. In textbook depictions, the periphery or leading edge of the growth cone comprises finger-like protrusions called filopodia based on bundled F-actin, and flat, sheet-like protrusions called lamellipodia based on F-actin meshwork; microtubules fill the axon shaft that usually terminate at the center of the growth cone (Figure 5J, right) (Sanchez-Soriano et al., 2010; Dent et al., 2011). Although microtubules occasionally extend to the periphery of the growth cone, filopodia do not contain microtubules (Dent et al., 2011).
Figure 5. Cytoskeletal organization of ORN axon terminals.
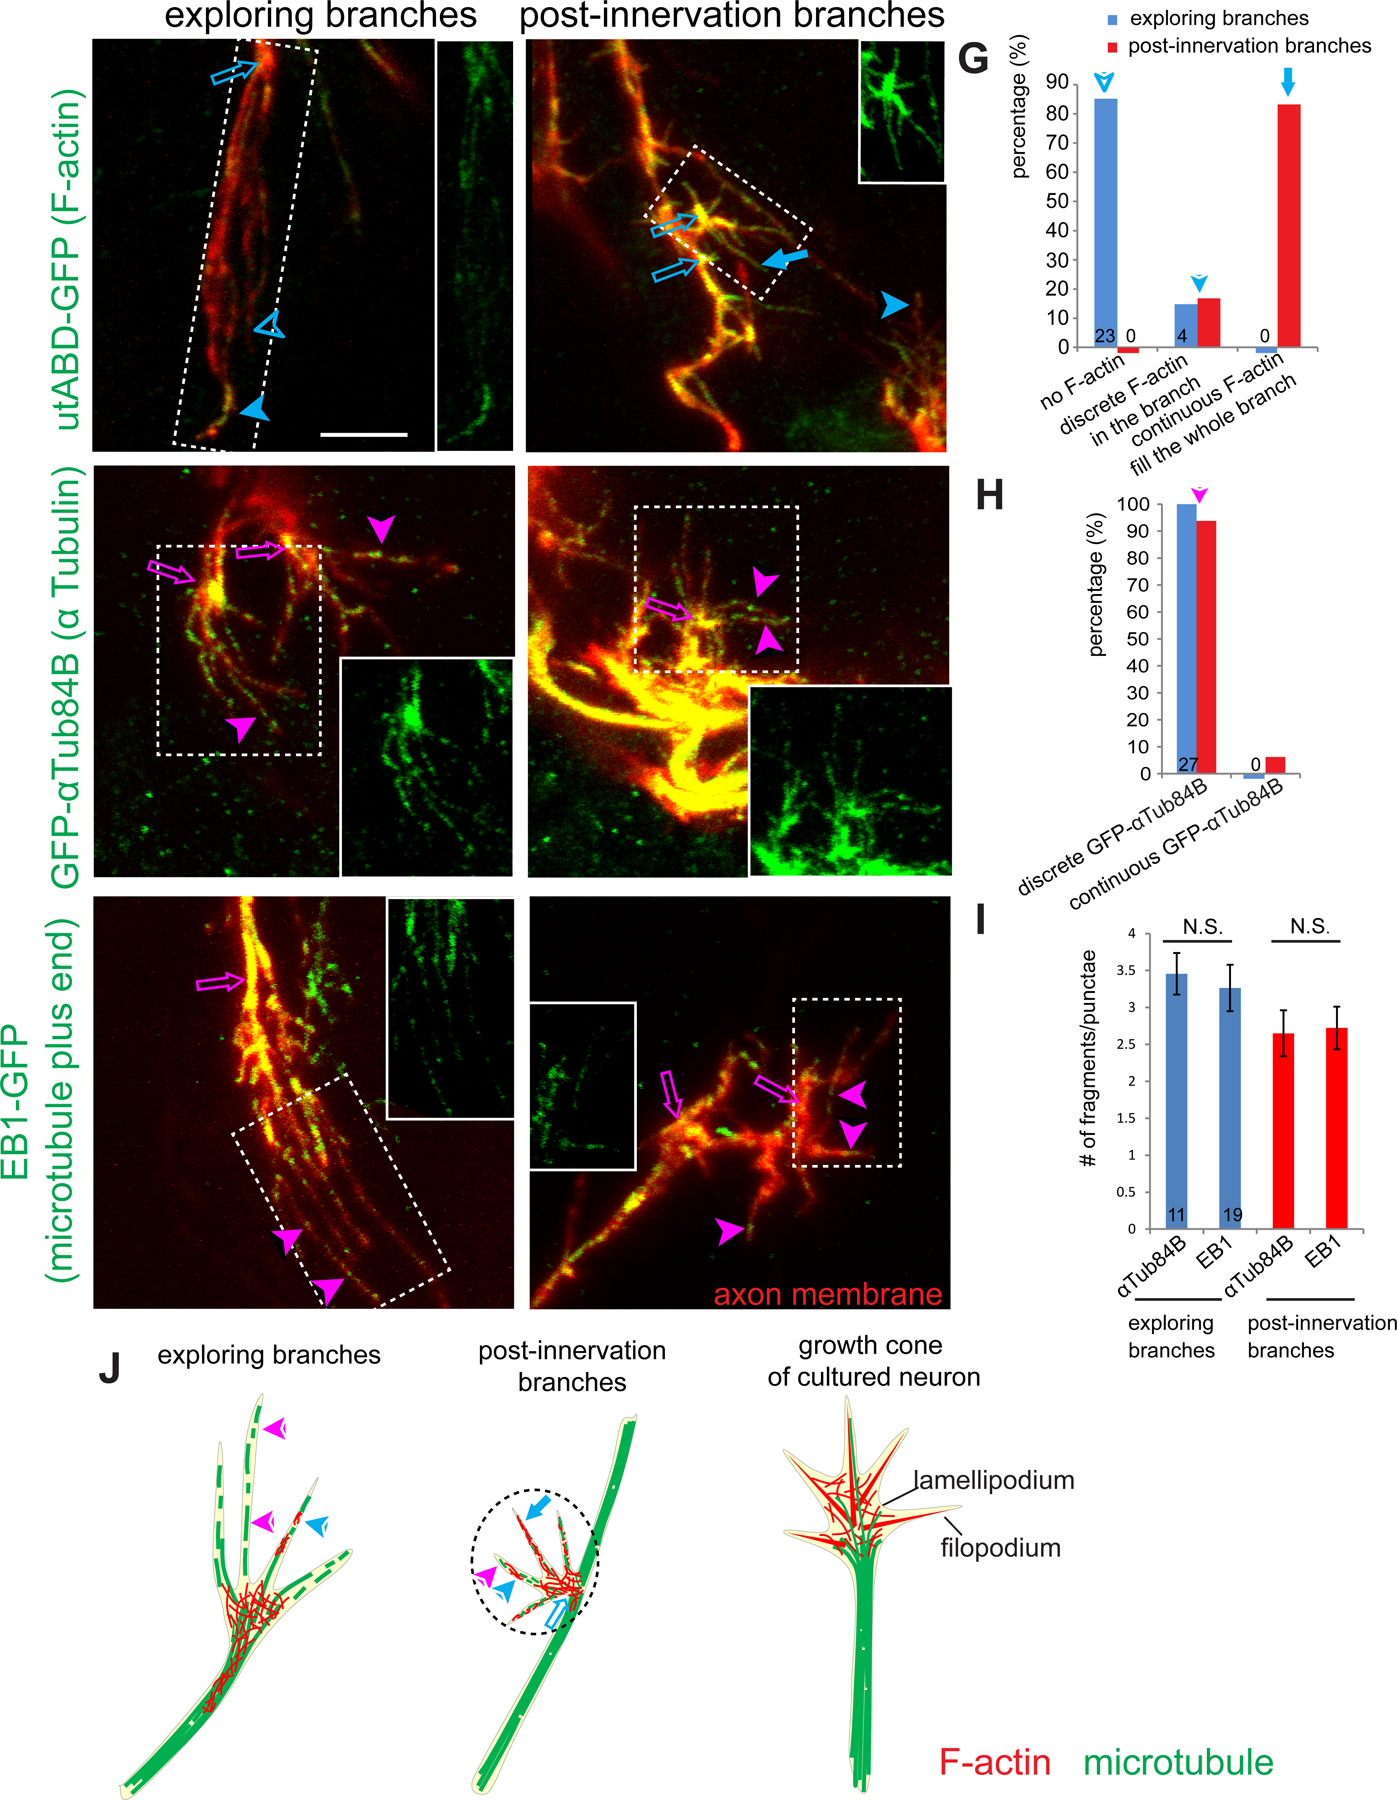
(A, B) Max intensity projections of confocal images of ORN axon terminals in fixed brains from 34–36h APF labeled by pebbled-GAL4-based MARCM clones co-expressing membrane-Halo and GFP-utABD and visualized with JF-Halo-646 ligand (red) and anti-GFP antibodies (green), showing F-actin organization in exploring branches (A) and post-innervating branch (B). Open arrows denote the hub from which terminal branches extend. Solid arrowheads denote terminal branches with discrete F-actin signal. Open arrowheads denote branches without F-actin. Solid arrow in (B) denotes a terminal branch filled with F-actin throughout.
(C–F) Max intensity projections of confocal images of ORN axon terminals in fixed brains from 34–36h APF labeled by pebbled-GAL4-based MARCM clones co-expressing membrane-Halo (red) and GFP-αTub84B (green in C, D) or EB1-GFP (green in E, F), showing microtubule organization in exploring branches (C, E) and post-innervating branch (D, F). Solid arrowheads denote discrete microtubule fragments in terminal branches. Open arrows indicate the hubs from which terminal branches extend. Insets in A–F are GFP-only channel from the regions denoted by the dashed rectangles.
(G, H) Quantification of patterns of the F-actin (G) and GFP-αTub84B (H) from exploring branches and post-innervation branches. Numbers indicate branches quantified.
(I) Quantification of the numbers of GFP-αTub84B and EB1-GFP in exploring and post-innervation branches. Error bars, SEM. t test; N.S., P>0.05. Numbers indicate branches quantified.
(J) Summary of cytoskeletal organization in exploring branches (left) and post-innervation branches (middle) of ORN axonal terminal, compared to and a typical growth cone from neurons in dissociated culture (right). Arrows and arrowheads indicate specific structures explained in (A–F).
See Figure S6 for related data.
Deviating from the classic depictions of growth cones, which are mostly based on studies of dissociated neurons in culture, ORN axon terminals contained multiple thin protrusions (exploring branches or post-innervating branches) extending from a hub where the axon shaft ends (Figure 4C–E, 5A–F), with no obvious lamellipodia between these terminal branches. To examine the cytoskeletal basis, we produced small MARCM clones of ORNs in which the plasma membrane was labeled by a membrane-targeting Halo-tag with Janelia Fluor 646 Halo-tag ligand in the media for explant culture, and F-actin or microtubules were labeled by genetically encoded markers described below, detected by antibody labeling post fixation. To define exploring branches in fixed brains, we selected multi-branched terminals approaching a similar region in the contralateral antennal lobe as the ipsilateral innervated glomeruli. To define post-innervation branches, we selected terminal branches extending from the end of the ipsilateral interstitial branch rather than from the contralaterally projecting axon.
To examine F-actin distribution in ORN axon terminals, we expressed the F-actin binding domain of utrophin tagged with GFP (GFP-utABD) (Rauzi et al., 2010). In exploring branches, F-actin was concentrated at the hub from which terminal branches emanate (open arrows in Figure 5A), rather than the periphery of the growth cones. Indeed, most of the exploring branches did not contain detectable F-actin (open arrowheads in Figure 5A; Figure 5G); a few branches contained discrete F-actin patches (solid arrowheads in Figure 5A; Figure 5G). By contrast, most post-innervation branches were filled with F-actin throughout the entire branch (solid arrows in Figure 5B; Figure 5G), whereas the rest of the post-innervation branches contained discrete F-actin patches (solid arrowheads in Figure 5B; Figure 5G).
To examine microtubule distribution in ORN axons, we expressed GFP-tagged αTub84B (Grieder et al., 2000) or GFP-tagged microtubule plus end–binding protein EB1 (Rusan and Peifer, 2007). The distribution of both markers suggested the presence of microtubules in both exploring branches and post-innervation branches (solid arrowheads in Figure 5C–F), as shown by discrete GFP-αTub84B signal (Figure 5C–D, quantified in Figure 5H) and multiple EB1-GFP puncta along the branches (Figure 5E–F, quantified in Figure 5I), including the branch tips (Figure S6H). The numbers of GFP-αTub84B fragments and EB1-GFP puncta were similar (Figure 5I). Both GFP-utABD and EB1-GFP were also found in terminals of pre-target ORN axons along the main trajectory (Figure S6I–J); the needle-like simple morphology of ORN axon terminals here did not allow finer distinction of F-actin and microtubule distributions.
In summary, the cytoskeletal organization of ORN axon terminals in the antenna–brain explants differed substantially from the growth cones of dissociated neurons in culture. The microtubule cytoskeleton appears to be a major component in both exploring and post-innervation branches. The post-innervation branches also contain more F-actin, which is most enriched at the hub from which both exploring and post-innervation branches emanate (Figure 5J).
Contralateral ORN axons are required for correct ORN axon targeting
Bilaterally symmetric axon targeting occurs widely (Yost, 1998; Corballis, 2009; Swanson, 2011), but the underlying mechanisms are largely unknown (Lodato et al., 2015). Taking advantage of the explant culture, we asked whether axon targeting of ORNs from one side (hereafter ipsilateral) requires the presence of ORN axons from the other side (hereafter contralateral) by severing the contralateral antennal nerve at specific developmental times (Figure 6A). Live imaging of sparsely labeled ORN axons showed that axons from the cut side immediately stopped growth and eventually degenerated, while uncut axons from the same explant continued to grow (Figure 6B).
Figure 6. Contralateral ORN axons are required for correct ORN axon targeting.
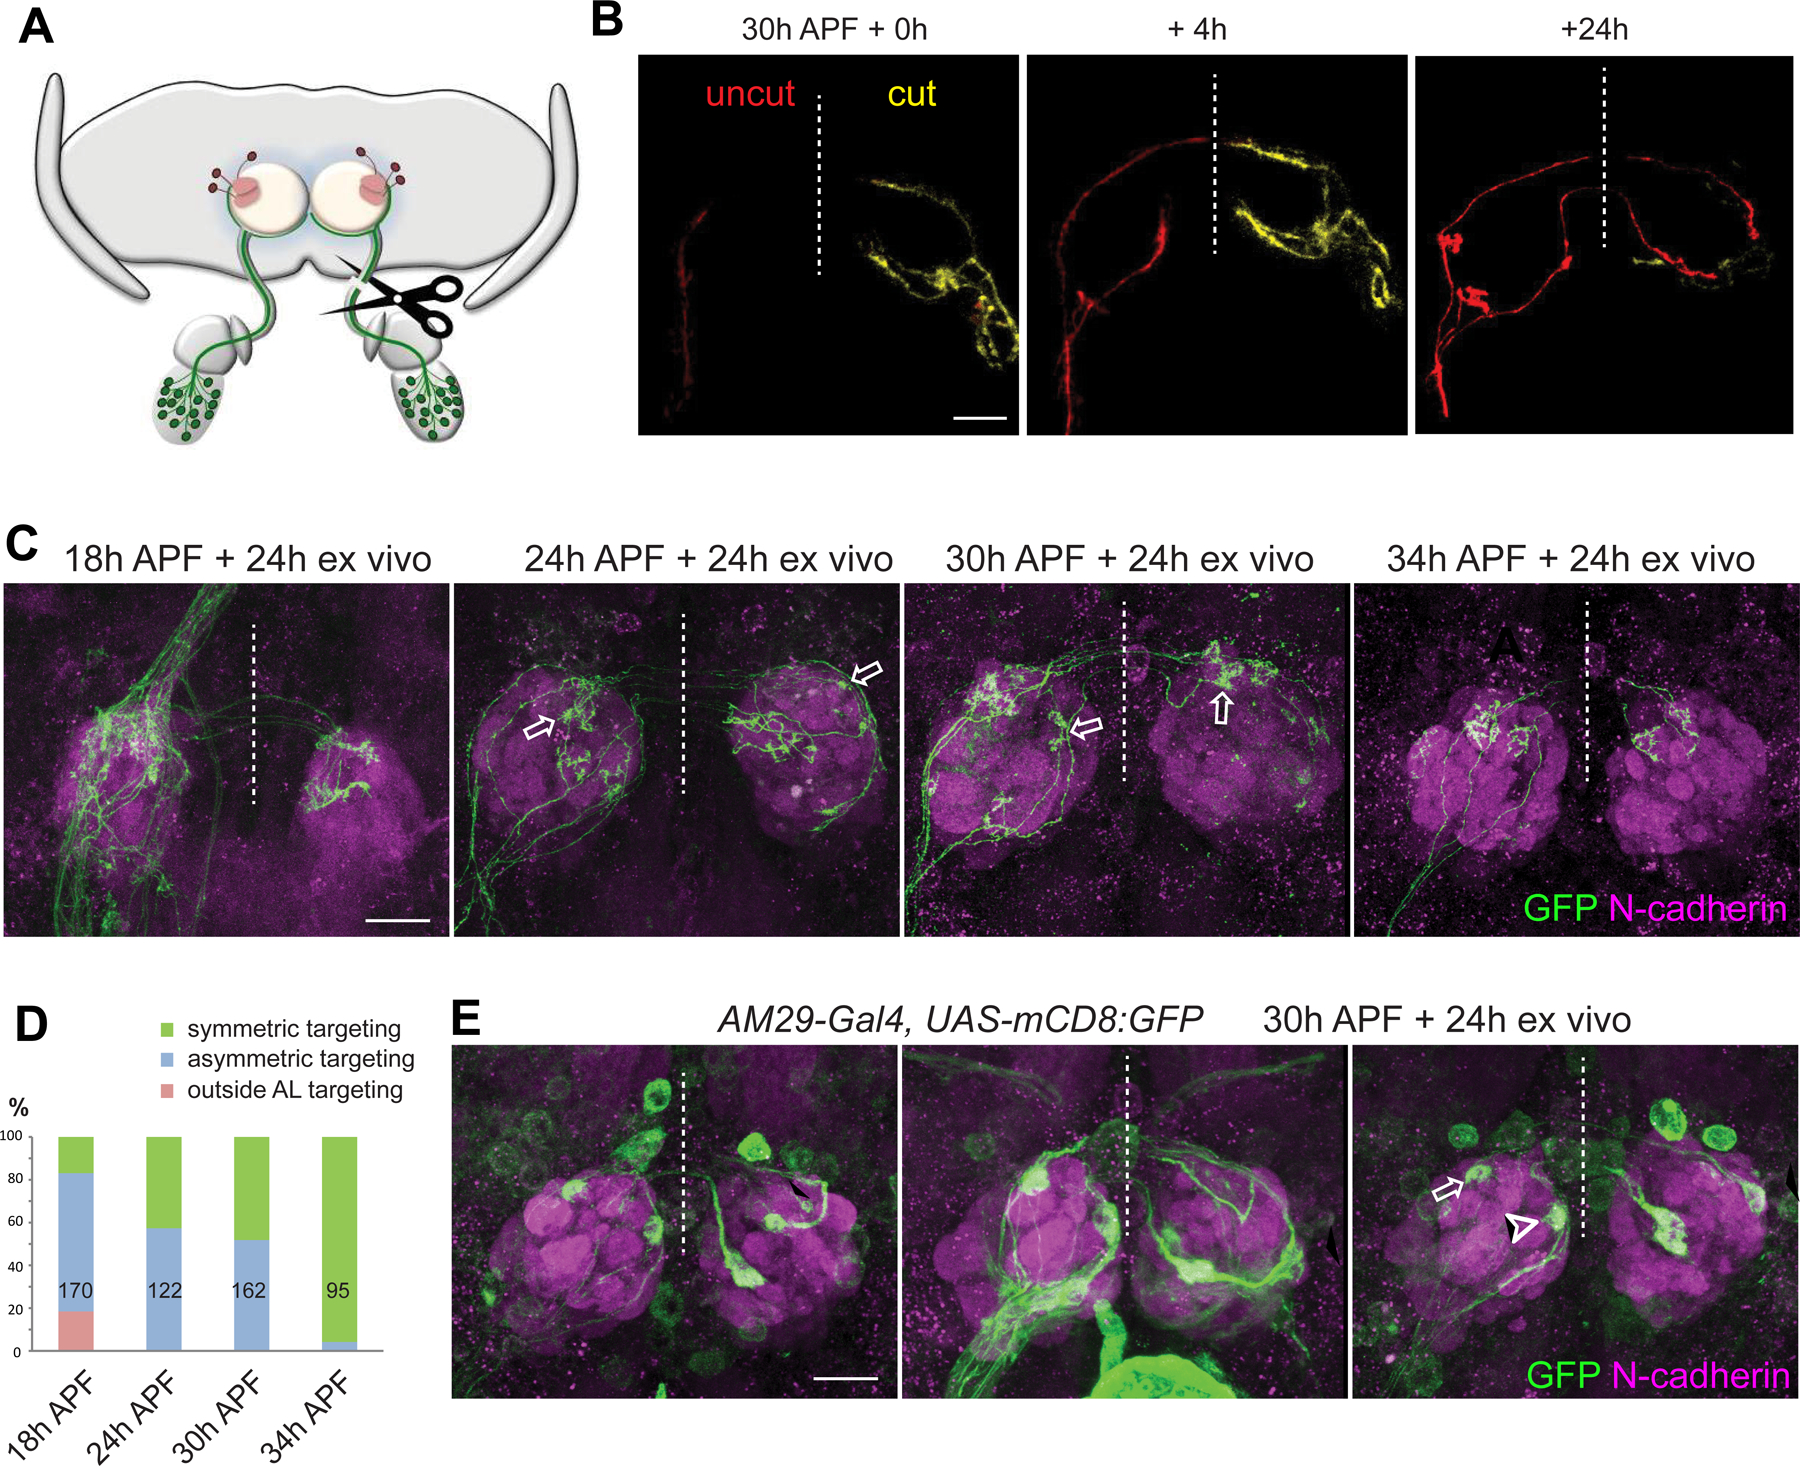
(A) Schematic of unilateral antennal nerve severing prior to explant culture.
(B) Images from two-photon time-lapse videos at the indicated times from pebbled-GAL4/hsFLP;UAS-FRT100-stop-FRT100-mCD8-GFP/+ (same genotype in B–D) explant. Sparsely labeled axons from uncut (red) and cut (yellow) side following unilateral antennal nerve severing are shown. Dashed vertical lines are midlines.
(C) Max intensity projection confocal images from explants with unilateral antennal nerve severed at 18h, 24h, 30h, and 34h APF, respectively, followed by 24h culture before staining with anti-GFP and anti-N-cadherin. Solid arrow denotes uncut axons exiting the antennal lobe dorsally. Open arrows denote the asymmetric targeting in the ipsilateral and contralateral antennal lobes from the same ORN axon.
(D) Quantification of fractions of uncut single ORN axons that exhibit different categories of phenotypes at specific times of cut as indicated. Numbers are axons quantified.
(E) Max intensity projection confocal images from AM29-GAL4,UAS-mCD8-GFP explants with unilateral antennal nerve severed at 30h APF, followed by 24h culture before staining with anti-GFP and anti-N-cadherin. Solid arrows and arrowheads mark contralateral mistargeting of DM6 and DL4 axons, respectively. Open arrow and arrowhead mark DM6 and DL4 glomeruli, respectively. Mistargeting of AM29+ ORN axons was observed in 12 of 14 contralateral antennal lobes.
See Figure S7 for related data.
With the FLPout-based sparse labeling strategy, we initiated explant culture after severing one antennal nerve at 18h, 24h, 30h, and 34h APF. At 18h APF, pioneer ORN axons just reached the antennal lobe, such that severing the contralateral antennal nerve would prevent contralateral axons from entering the antennal lobe. This caused substantial targeting defects of ipsilateral ORN axons, including mistargeting dorsally out of the antennal lobe (Figure 6C–D). Contralateral antennal nerve severing at 24h and 30h APF caused ipsilateral ORN axons to target asymmetrically in two antennal lobes (Figure 6C–D), suggesting axon mistargeting on at least one side. However, contralateral antennal nerve severing at 34h APF no longer affected axon targeting specificity of most ipsilateral ORNs (Figure 6C–D). Asymmetric targeting of ipsilateral ORN axons upon contralateral antennal nerve severing was observed mostly in ORN types that had a short waiting time of the ipsilateral innervation (Figure S7A, small i in Figure 3C).
To determine in which antennal lobe ipsilateral axons mistarget, we examined axon targeting of DM6 and DL4 ORNs upon contralateral antennal nerve severing at 30h APF. We found that the axons of both ORN types mistargeted only in the contralateral antennal lobe: DM6 axons mistargeted to a stereotyped position ventrolateral to the DM6 glomeruli (solid arrows in Figure 6E), while DL4 axons mistarget to more random glomeruli (solid arrowheads in Figure 6E). Thus, axons from contralateral ORNs are required for the correct target selection of ipsilateral ORNs in the contralateral antennal lobe.
ORN axons are required for PN dendrite refinement
Prior to ORN axon arrival, dendrites of their postsynaptic partner PNs are already present and at least some PN types already target their dendrites to specific regions of the antennal lobe (Jefferis et al., 2004) (Figure 1A). Using the explant system, we first examined how PN dendrites target the correct regions. To label single PNs, we used GH146-GAL4-based MARCM and heat shock in a time window when only DL1 single PN clones were labeled (Jefferis et al., 2001; Figure S7C). Due to the low labeling intensity at early developmental stages, we could only visualize DL1 dendrites starting at ~23h APF, after they already innervated specific regions of the antennal lobe. At this stage, DL1 dendrites still exhibited active local exploration through terminal branch extension (Figure 7A, arrows; Movie 6). These terminal dynamics decreased at 30h APF when ORNs started to innervate the glomeruli, and the dendritic terminals formed more smooth boundaries (Figure 7B; Movie 6).
Figure 7. ORN axons are required for PN dendrite refinement.
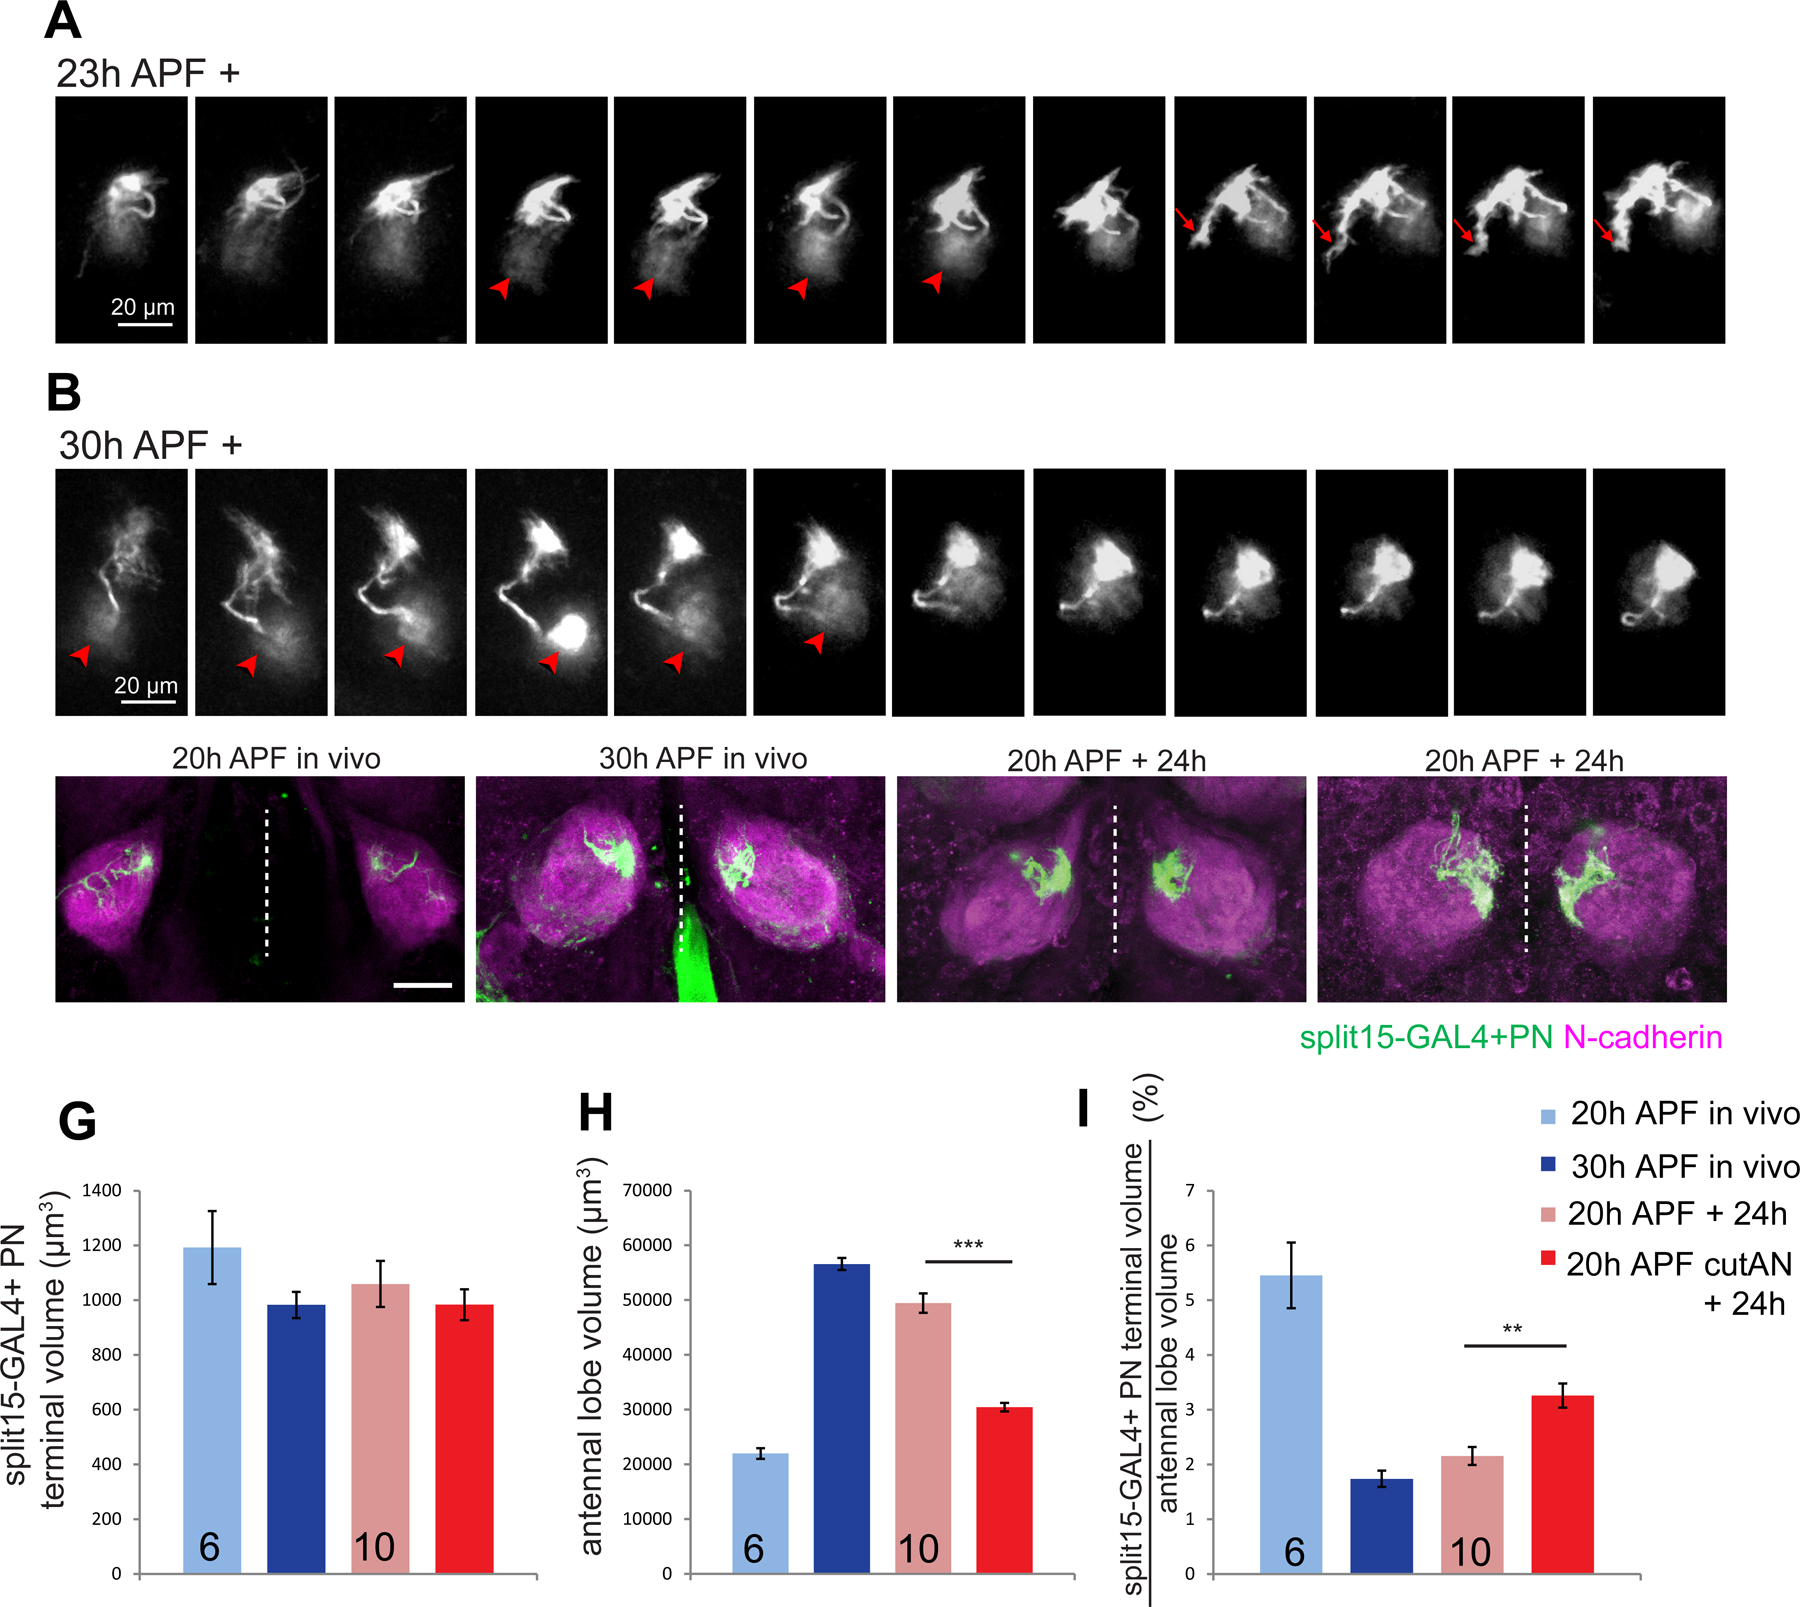
(A, B) Images from two-photon time-lapse videos of explants dissected at 23h (A) or 30h (B) APF, showing dynamics of dendrite terminals across time from a single MARCM-labeled DL1 PN in each case. Images are partial projection, some of which include the DL1 PN cell body (arrowheads). Arrows denote a dynamic terminal branch exploring local area.
(C–F) Max intensity projection confocal images of split15-GAL4;UAS-mCD8-GFP (same genotype in C–I) brains dissected at 20h APF in vivo (C), at 30h APF in vivo (D), and at 20h APF in vivo and cultured for 24h with both antennal nerves intact (E) or cut (F) at the time of dissection.
(G–I) Quantification of split15-GAL4+ PN dendritic volume (G), total antennal lobe volume (H), and the percentage of split15-GAL4+ PN dendritic volume (I) from the four conditions indicated, corresponding to panels C–F. One-way ANOVA. Numbers of antennal lobes are indicated. **: P<0.01, ***: P<0.001.
See Figure S7 for related data.
Does PN dendrite development depend on ORN axons? To address this question, we severed both antennal nerves at 20h APF to ablate all ORN axons and compared the targeting of PN dendrites to those with intact antennal nerves (Figure S7B). We assessed targeting of a small subset of PN types labeled by two split GAL4 lines (Yoshi Aso, unpublished data; Xie et al., 2021; Figure S7C). We found that PN dendrites remained in the same coarse regions of the antennal lobe after 24h in explant culture in the absence and presence of the ORN axons (Figure 7E–F, S7D), suggesting that the maintenance of PN dendrites in specific regions of the antennal lobe does not require ORN axons.
However, when ORN axons were ablated, PN dendrites occupied larger areas compared to explants with intact ORN axons (Figure 7E–F; S7D). To quantify this effect, we measured the volumes split-GAL4–15+ PN dendrites occupied under 4 conditions: 20h APF and 30h APF in vivo (Figure 7C, D), and 20h APF + 24h explant culture in the presence or absence of ORN axons (Figure 7E–F). While the volumes of split-GAL4–15+ dendrites remained similar at 20h and 30h in vivo (Figure 7G, light and dark blue bars), the antennal lobe volume increased by nearly 3-fold (Figure 7H); as a result, split-GAL4–15+ PN dendrites occupied a smaller fraction of the antennal lobe volume (Figure 7I). These data suggest that PNs refine their dendrites as ORN axons invaded the antennal lobe. Dual color labeling directly showed that PN dendrites targeting to neighboring glomeruli gradually segregated from each other as development proceeded (Figure S7E–G), confirming dendritic refinement inferred above. When the explants were cultured in the presence of ORN axons, a similar expansion of the antennal lobe volume and PN dendrite refinement occurred after 24h culture (Figure 7G–I, light red bars). However, when the explants were cultured in the absence of ORN axons, antennal lobes no longer expanded, and PN dendrites still occupied the same proportion of the antennal lobe volume after 24h culture (Figure 7G–I, dark red bars). These experiments indicate that ORN axons are required for PN dendrite refinement to a proportionally smaller region of the antennal lobe.
DISCUSSION
Cellular mechanisms of target selection
Prior to this study, it was unclear what cellular mechanism is used for ipsilateral target selection. Our data support the following model: ORN axons send out transient interstitial branches at multiple locations along the main axon; the branch that reaches the target region becomes stabilized, and further interstitial branches are suppressed (Figure 3; S5A3). Stabilization of appropriately positioned branches and elimination of ectopic branches are also used for topographic retinotopic targeting (Yates et al., 2001; McLaughlin and O’Leary, 2005), suggesting that the mechanism of transient interstitial branching followed by stabilization applies to the formation of both continuous and discrete neural maps.
The exploring branches we discovered using AO-LLSM imaging (Figure 4) suggest a means by which a growing ORN axon may increase the chance of identifying its target. These exploring branches consist of long, microtubule-based parallel branches that extend and retract rapidly and independently, allowing them to sample a relatively large region for possible targets. The transient occurrence of exploring branches when ORN axons approach their target region suggests that they are induced by local cues near target regions to facilitate target selection. In the ipsilateral antennal lobe, exploring branches were found in ORN types that form ipsilateral branches shortly after the main axon passes by (small i in Figure 3C), consistent with them serving as the precursor to the eventual ipsilateral branch. Exploring branches are also found in axon terminals in the contralateral antennal lobe in ORN types with a wide range of i (compare Figure 3C and S6E), suggesting a general role in facilitating contralateral target identification.
For ORN types that have a long delay in extending the ipsilateral branch (large i in Figure 3C), we did not observe exploring branches, suggesting a distinct mechanism for consolidating the ipsilateral branch. Nevertheless, dynamic interstitial branches occur over a prolong period of time until the formation of the ipsilateral branch, suggesting that these ORN types also use stabilization of transient interstitial branches as a means to consolidate the ipsilateral branch.
In summary, after the initial trajectory choice such that ORN axons navigate in the half of the antennal lobe where their eventual targets are (Joo et al., 2013; Figure 1A), we propose that the next critical step in ORN axon development is the stabilization of transient interstitial branches by target-derived cues, aided at least in part by the exploring branches. Together, these cellular mechanisms begin to explain how each ORN chooses one of 50 glomerular targets precisely.
Cytoskeletal organization of axon terminals
A surprising finding is that the cytoskeletal organization of ORN terminals differs substantially from that of classic growth cones, comprising F-actin-based filopodia and lamellipodia at the periphery and a microtubule-enriched central hub. The terminal branches of ORN axons, in particular the exploring branches, are filled with microtubules, whereas F-actin is concentrated at the central hub (Figure 5). We also found similar cytoskeletal organization in photoreceptor axon terminals (Figure S6K–L). These differences are unlikely due to species difference, as the classic growth cone cytoskeletal organization is found in neurons (mostly dissociated in culture) from Aplysia, Drosophila, and mammals (Lin et al., 1994; Sanchez-Soriano et al., 2010; Dent et al., 2011). We cannot rule out the possibility that F-actin is present in low amount at the terminal of each exploring or post-innervation branch but is beyond the detection limit of our utrophin-based F-actin labeling; if so, each terminal branch would have its own growth cone at its tip, resembling classic growth cones. Even if that is the case, ORN axon terminals still differ from classic growth cones by having multiple microtubule-based parallel branches emanating from an F-actin rich central hub. Indeed, EB1-GFP puncta can be found at the tip of the branch (Figure S6H), suggesting that microtubules can fill the entire branch. Microtubule polymerization has been shown to mediate membrane extension directly in lipid vesicle (Fygenson et al., 1997).
We suspect that the deviation of cytoskeletal organization in ORN axon terminals from the classic growth cone is likely due to the more complex environments axon terminals need to explore in the brain compared with the primary culture. Indeed, a recent study showed that neurons cultured in three-dimensional environments have microtubules extending to the edge of growth cones unconstrained by F-actin (Santos et al., 2020). Our findings have important implications for mechanisms that convert cell-surface recognition of extracellular cues into cytoskeletal-based structural changes in axon terminals during axon targeting. Specifically, we suggest that signaling to microtubule is particularly important at initial stages of target selection.
Bilateral interactions in bilaterally symmetrical connections
Bilaterally symmetric organization of the nervous system is a cardinal feature of all bilaterians (Swanson, 2011). Our unilateral antennal nerve severing indicates the requirement of bilateral axons in target selection. The simplest cellular mechanism is direct interactions between ipsilateral and contralateral ORN axons. These interactions may facilitate midline crossing by creating a critical mass of midline-penetrating axons, disruption of which may cause some axons to leave the antennal lobe instead (Figure 6C). Later, bilateral axon-axon interactions between the same ORN type may facilitate target selection of contralateral ORNs. Our data does not rule out the possibility that bilateral interactions may be indirect; for example, ipsilateral ORNs may change the properties of their partners PNs, which in turn regulate target selection of contralateral ORNs. Indeed, upon unilateral antennal nerve severing, targeting defects was mostly found in ORN types that sequentially innervate ipsilateral and contralateral glomeruli (Figure S7A). The ease of severing antennal nerve in explant cultures provides a means to further investigate cellular and molecular mechanisms of bilateral interactions.
In conclusion, time-lapse imaging has greatly enriched our understanding of the cellular events that enable the step-wise assembly of the fly olfactory circuit, and highlight the precise genetic control of multiple steps during ORN axon targeting. These include the choice of a trajectory along which an ORN axon navigates the ipsilateral antennal lobe, the timing and location of stabilizing its ipsilateral branch, and the interactions with contralateral ORN axons to cross the midline and innervate its contralateral target. Finally, ORN axons also help refine dendrites of their partner PNs, which pattern the antennal lobe first. The stage is set to combine live imaging and the cellular insights it has brought with genetic manipulations of key wiring molecules identified by genetic, transcriptomic, and proteomic approaches to reach a deeper level of mechanistic understanding of the circuit assembly process.
Limitation of study
While the targeting precision in our explant culture mimics closely in vivo, it takes ORN axons longer to reach the same developmental stage in culture than in vivo (Figure 1). Thus, measurements involving time in explants may be protractions of equivalent events in vivo. The small number of single axons from specific ORN types, due to limited drivers that label specific ORN types strongly in early development, did not allow us to assess the variation of targeting behavior among ORNs of the same type. While we sampled axon targeting of a large fraction of antennal ORN types, we did not sample axons from 6 maxillary palp ORN types (Figure S2B) as our explant did not include maxillary palp. It is unclear whether maxillary palp ORN axons follow similar rules as antennal ORN axons. However, as maxillary palp ORN axons reach the antennal lobe substantially later than antennal ORN axons (Sweeney et al., 2007), the lack of maxillary palp ORN axons in our explants should not affect the early stages of antennal ORN axon targeting.
STAR METHODS
KEY RESOURCE TABLE
Submitted as a separate file.
RESOURCE AVAILABILITY
Lead contact
Further information and requests for resources and reagents should be directed to the Lead Contact, Liqun Luo (lluo@stanford.edu).
Materials availability
All reagents generated in this study are available from the lead contact.
Data and code availability
All time-lapse imaging raw data generated in this study are available from the lead contact upon request.
No code was generated in this study.
Any additional information required to reanalyze the data reported in this paper is available from the lead contact upon request.
EXPERIMENTAL MODEL AND SUBJECT DETAILS
Drosophila stocks and genotypes
Flies were raised on standard cornmeal medium with a 12h/12h light cycle at 25oC. Complete genotypes of flies in each experiment are described in Table S1.The following lines were used:pebbled-GAL4 (pan-ORN GAL4)(Sweeney et al., 2007), AM29-GAL4 (DM6 and DL4 ORN GAL4)(Endo et al., 2007), Mz19-GAL4 (DA1, VA1d, and DC3 PN GAL4) (Ito et al., 1998), split15-GAL4 (Yoshi Aso, unpublished data; Xie et al., 2021), UAS-FRT100-stop-FRT100-mCD8-GFP, UAS-FRT10-stop-FRT10-mCD8-GFP (this study), UAS-3xHalo7::CAAX (Sutcliffe et al., 2017), UAS-utABD-GFP (Rauzi et al., 2010), UAS-EB1-GFP (Rusan and Peifer, 2007), UAS-GFP-αTub84B (Grieder et al., 2000), UAS-mCD8-GFP, tubP-GAL80 (Lee and Luo, 1999), hsFLP (Golic and Lindquist, 1989), vvl-FLP (Chen and Krasnow, 2014), UAS-mCD8-FRT-GFP-FRT-RFP (Stork et al., 2014).
METHODS DETAILS
Explant dissection and culture
The 0h APF pupae were identified by the white color of the cuticle of pupae. These pupae were heat-shocked in 37°C water bath for different amount of time to induce sparse clones (details indicated below) and aged at 25°C for specified hours before dissection. Dissection was done in pre-cooled Schneider’s insect media (Thermo Fisher Scientific) with Penicillim Streptomycin (Thermo Fisher Scientific). The external brown shells of the pupae were first removed using forceps. The micro dissection scissor was used to cut the trunk and remove the semi-transparent cuticle covering the dorsal and ventral sides of the brain. A small piece of cuticle attached to two retinae was left to hold the two antennae with the brain. Fat bodies were then cleaned through gentle pipetting. At this point the antennal nerves that connect the two antennae to the brain are visible and can be severed by the micro scissor in certain experiments (Figures 6, 7). After severing the antennal nerve(s), the antenna(e) were left attached to the small piece of cuticle during culture (Figures 6, 7). Following dissection, the antennae-brain explant was transferred to a culture dish (60 mm X 15 mm) with silgard layer on the bottom and 500 μl culture media. Two micro pins were used to pin the explant to the Silgard through the two optic lobes. The Silgard plate with explant was then carefully moved to the imaging station. 10 ml culture media was added gently to the plate before imaging. The culture condition for explant was modified from Ozel et al., 2015, containing: Schneider’s insect media (Thermo Fisher Scientific), 10% Fetal Bovine Serum (Thermo Fisher Scientific), 10 μg/ml human insulin recombinant zinc (from 4mg/ml stock solution, Thermo Fisher Scientific), 1 μg/ml 20-hydroxyecdysone (from 1 mg/ml stock solution in ethanol, Sigma), and Penicillin/streptomycin (1:100 from stock: 10000 IU/ml penicillin, 10 mg/ml streptomycin, Thermo Fisher Scientific). The culture media was oxygenated by pumping oxygen for ~ 30 min before use.
Generation of sparse labeling FLPout reporter flies
To generate FLPout reporters pUAS-FRT100-stop-FRT100-mCD8-GFP and pUAS-FRT10-stop-FRT10-mCD8-GFP constructs (Figure 2), we PCR amplified the transcriptional terminator, stop, sequence from pUAST>stop>mCD8-GFP (addgene #24385, Potter et al., 2010) and subcloned into pJFRC7–20XUAS-IVS-mCD8-GFP (addgene # 26220, Pfeiffer et al., 2010) through NotI and XhoI. FRT100 or FRT10 sequences (mutant FRTs with ~100-fold or ~10-fold less efficiency compared to wild type FRT; Golic and Lindquist, 1989) flanking stop sequence were added through the primers for PCR. Both constructs were sequence verified. The sequences of primers used for PCR reaction are below: FRT100-stop_forward:
5’-TAAGCGGCCGCGAAGTTCCTATTCCGAAGTTCCTATTgTCTAGAAAGTATAGGAACTTCAGAGCGCTTTT GAAGCTAGAG
FRT100-stop_reverse:
5’-CTATTCACTCGAGGAAGTTCCTATACTTTCTAGAcAATAGGAACTTCGGAATAGGAACTTCAAGATCCCC CGGATCCTC
FRT10-stop_forward:
5’-TAAGCGGCCGCGAAGTTCCTATTCCGAAGTTCCTtTTCTCTAGAAAGTATAGGAACTTCAGAGCGCTTTT GAAGCTAGAG
FRT10-stop_reverse:
5’-CTATTCACTCGAGGAAGTTCCTATACTTTCTAGAGAAaAGGAACTTCGGAATAGGAACTTCAAGATCCCC CGGATCCTC
Both pUAS-FRT100-stop-FRT100-mCD8-GFP and pUAS-FRT10-stop-FRT10-mCD8-GFP transgenes were integrated into 86Fb landing site (Bischof et al., 2007).
Immunocytochemistry
Dissection and immunostaining of fly brains and pupal antennae were performed according to previously described methods (Wu and Luo, 2006; Li et al., 2016). The brains were dissected in PBS (phosphate buffered saline; Thermo Fisher), and then fixed in 4% paraformaldehyde (Electron Microscopy Sciences) in PBS with 0.015% Triton X-100 (Sigma-Aldrich) for 20 minutes on a nutator at room temperature. Explant was fixed in the same condition after culture. Fixed brains were washed with PBST (0.3% Triton X-100 in PBS) four times, each time nutating for 20 minutes. The brains were then blocked in 5% normal donkey serum (Jackson ImmunoResearch) in PBST for 1 hour at room temperature or overnight at 4°C on a nutator. Primary antibodies were diluted in the blocking solution and incubated with brains for 36–48 hours on a nutator at 4°C. After washed with PBST four times, each time nutating for 20 minutes, brains were incubated with secondary antibodies diluted in the blocking solution and nutated in the dark for 36–48 hours at 4°C. Brains were then washed again with PBST four times, each time nutating for 20 minutes. Immunostained brains were mounted with Slow Fade anti-fade reagent (Thermo Fisher) and stored at 4°C before imaging. Primary antibodies used in immunostaining include: rat anti-DNcad (1:40; DN-Ex#8, Developmental Studies Hybridoma Bank), chicken anti-GFP (1:1000; GFP-1020, Aves Labs), rabbit anti-GFP (1:1000, A-11122, Thermo Fisher Scientific), mouse anti-GFP (1:500, G6539, Sigma), rabbit anti-GFP (1:500, Clontech, 632475). Donkey secondary antibodies conjugated to Alexa Fluor 488/568/647(Jackson ImmunoResearch or Thermo Fisher Scientific) were used at 1:1000.
Image acquisition and processing
Images of fixed brains were acquired by a Zeiss LSM 780 laser-scanning confocal microscope (Carl Zeiss), with a 40x/1.4 Plan-Apochromat oil objective (Carl Zeiss). Confocal z stacks were obtained at 1–2 µm intervals at the resolution of 512×512. Images were exported as maximum projections or single confocal sections by ZEN (Carl Zeiss) in the format of TIFF. Photoshop (Adobe) was used for image rotation and cropping. Two-photon microscopy-based imaging was performed at room temperature using a custom-built two-photon microscope (Prairie Technologies), a Chameleon Ti:Sapphire laser (Coherent) and a 20×water-immersion objective (1.0 NA; Zeiss). For all two-photon microscopy-based imaging, the excitation wavelength was at 920 nm. Z stacks were obtained at 2 µm intervals. The pixel dwell time was 10 µs. Images were exported as maximum projections or single confocal sections by FIJI in the format of TIFF.
For AO-LLSM based imaging, the excitation and detection objectives along with the 25-mm coverslip were immersed in ~40 ml of culture medium (see in Explant dissection and culture) at room temperature (22 ± 1°C). Explant brains with membrane targeting Halo-JF-646 expressed in sparse ORN clones were immobilized on a thin Sylgard layer (~2 mm) attached to the surface of the coverslip using two pins and were excited using 642 nm lasers operating at ~2–10 mW (corresponding to ~10–50 μW at the back aperture of the excitation objective) with an exposure time of 20–50 msec. Dithering lattice light-sheet patterns with an inner/outer numerical aperture of 0.38/0.4 was used. The optical sections were collected by an axial step size of 250 nm in detection objective coordinate, with a total of 81–201 steps (corresponding to a total axial scan range of 20–50 μm). Emission light from JF-646 was captured by a Hamamatsu ORCA-Flash 4.0 sCMOS cameras (Hamamatsu Photonics, Hamamatsu City, Japan). Prior to the acquisition of the time series data, the imaged volume was corrected for optical aberrations using two-photon “guide star” based adaptive optics method. Each imaged volume was deconvolved in C++ using Richardson-Lucy algorithm on HHMI Janelia Research Campus’ computing cluster with experimentally measured point spread functions obtained from 200 nm fluorescent beads (Thermo Fisher). The AO-LLSM was operated using a custom LabVIEW software (National Instruments, Woburn, MA). Image analysis was performed using FIJI.
Sparse genetic labeling and dye labeling
To sparsely label a few ORNs from any types using the FLPout reporters we generated in this study for time-lapse imaging (Figure 2), we collected hsFLP/pebbled-GAL4;;UAS-FRT100-stop-FRT100-mCD8-GFP/+ pupae at 0h APF and heat shocked at 37°C for 40 min at 0h APF. These pupae were then aged at 25°C for 30h before explant dissection and two-photon imaging. To sparsely label a few ORNs with membrane targeting Halo-tag using MARCM (Figure 4), we heat shocked pebbled-GAL4, FRT19A/tub-GAL80, hsFLP, FRT19A;;UAS-3xHalo7::CAAX/+ at 37°C for 30 min 2 days before puparium formation. We then collected these pupae at 0h APF and aged them at 25°C for 28h, followed by explant dissection, incubation with 2 μM Halo-JF-646 (Grimm et al., 2017) in 1 ml oxygenated culture media for 1h at room temperature. These explants were then incubated with 1µM Sulforhodamine 101 (Sigma) in 1ml culture media for 5 min at room temperature followed by two time washing in culture media before AO-LLSM based imaging in 50 ml culture media at room temperature. To induce DL1 PN clones, we heat-shocked yw, UAS-mCD8-GFP, hsFLP; FRTG13, GH146-FLP, UAS-mCD8-GFP/FRTG13, tubP-GAL80 at 37°C for 1 hour at approximately 0–4 hours after larval hatching (Jefferis et al., 2004).
Imaging analysis
To quantify growth of ORN axons across time (Figure 3A, B), we measured the change of ORN axon curve length in the antennal lobe in each 20 min imaging interval and plotted to the timing of midline crossing. In the ipsilateral antennal lobe, we defined the last imaging scan before axons crossed the midline area as time 0. In the contralateral antennal lobe, we defined the first imaging scan after axons crossed the midline as time 0. To quantify the ipsilateral branching point (Figure S5B–D), La was measured as the curve length from the antennal lobe entry point to ipsilateral branch point or the center of branching area in the main axon. Lb was measured from the midline-axon crossing point to the ipsilateral branch point or the center of branching area in the main axon. The curve length of axons was measured using IMARIS. To describe the pattern of ipsilateral branches (Figure S5F, G), we drew the outlines of the branch terminals from the projection images. In the quantification of transient interstitial branches before and after ipsilateral innervation, the following ORN axons were not included in the quantification: VA1d and VA1v axons due to bundling together during targeting; VM2 and VM3 axons due to bundling together during targeting; VL2a, VL1 and VM4 axons due to innervation very close to the entry point in the ipsilateral antennal lobe. To analyze the fast dynamics of exploring branches and post-innervation branches, we measured the curve length of each branch across time using imageJ and categorized each 30-sec imaging interval as extending or retracting if it was part of a time window when the branch continuously extended or retracted to more than 0.5 μm. Otherwise, we defined it as stationary. To calculate extending or retracting speed of each branch, we summed up total length increase or decrease during the 14.5 min fast scanning period and divided by the extending or retracting time period, respectively. Statistical analyses were performed using t-test, one-way ANOVA, two-way ANOVA or paired t-test as indicated in the figure legend for each experiment using Excel.
Dual color labeling of neighboring PN dendrites and image quantifications
To quantify PN dendritic segregation across development, we collected Mz19-Gal4/vvl-Flp;UAS-CD8>GFP>RFP/+ pupae at 20h, 30h, and 48h APF, which had DA1 and VA1d/DC3 PNs labeled with CD8-GFP and CD8-RFP, respectively. Individual channels of each single plane image were subject to background subtraction using ImageJ, followed by conversion to binary data. The composite images were converted to RGB and the overlapping regions targeted by both DA1 and VA1d/DC3 PN dendrites were selected for area measurement. To measure the total area targeted by either PN dendrites or both, the images were further converted to 8-bit color containing two colors. The volumes targeted by either PN dendrites or both were calculated by summing up the volumes between neighboring sections by multiplying area in each section with section interval. The degree of PN dendritic segregation was determined by measuring the ratio of overlapping volume to total volume.
MARCM analysis to determine ORN birth times
To determine the birth times for different ORN types, we heat-shocked pebbled-GAL4, FRT19A/tub-GAL80, hsFLP, FRT19A; UAS-mCD8-GFP/+ pupae at indicated time points for 25 min. The pupae were aged at 25°C. Adult brains were dissected from these heat shocked flies followed by immunostaining with anti-GFP and anti-N-cadherin antibodies and imaging by confocal microscopy. We quantified all single-cell MARCM clones (whose birthtimes reflect heat-shock times) from all dissected brains. To show the frequency of each type of ORN under certain heat shock condition, we normalized the total number of ORNs observed by the number of brains imaged and showed the number of single ORNs observed every 10 brains in Figure S3D.
Quantification and statistical analysis
All statistical analyses were done using Excel. The statistical method and P value in each analysis were indicated in the figure legends. The numbers of analyzed samples (n) and SEMs are indicated in the figures or figure legends.
Supplementary Material
Figure S1. The antennae–brain explant closely mimics normal olfactory circuit development, related to Figure 1
(A) Max intensity projection confocal images from explants (top row) or brains in vivo (bottom row). AM29-GAL4+ MARCM clones are labeled by expression of mCD8-GFP. Arrows mark ectopic targeting of AM29-GAL4+ ORN axons to ventral or lateral side of DM6 in both explants and in vivo.
(B) Quantifications of ectopic targeting of MARCM clones of AM29-GAL4+ ORN axons during development in vivo and ex vivo.
(C) Images from time-lapse videos taken by a two-photon microscope from pebbled-GAL4;UAS-mCD8-GFP explant at indicated time points.
(D) Max intensity projection confocal images from 3rd antennal segment at 48h APF. Different heat shock time induces different number of AM29-GAL4+ ORNs by UAS-FRT10-stop-FRT10-mCD8-GFP reporter.
Figure S2. Additional data of time-lapse imaging of single ORN axons during target selection, related to Figure 2
(A) Images from time-lapse videos from a two-photon microscope at the indicated time points of sparsely labeled ORNs from four samples (one per row). The identity of each ORN was revealed by fixing the explant at the end of the culture and staining with neuropil marker N-cadherin. Different single ORN axons are pseudocolored.
(B) Our experiments using sparse labeling of ORNs driven from the pan-ORN Pebbled-GAL4 covers 28 ORN types (Figure 2E, F). We also imaged 2 additional ORN types using AM29-GAL4 as a driver (Figure 1). In this panel, we use an antennal lobe map to highlight antennal ORNs not imaged (blue), the six maxillary palp ORN types (green, not imaged because they are not retained in the explant), and antennal ORNs imaged using AM29-GAL4 (magenta).
Figure S3. Axons from different ORN types reach the antennal lobe within different time windows, related to Figure 2
(A) ORN axons that enter the antennal lobe at different time windows were identified by dissecting the pupal brains at 26h, 30h, or 34h APF and selected based on the arrival at the antennal lobes, followed immediately by time-lapse imaging. Each ORN axon was tracked by time-lapse imaging and the targeting glomerular identity was determined by fixing and staining at the end of the 24–48h culture.
(B) Glomerular map showing the distribution of ORN types with early- (light), middle- (medium) and late- (dark) arriving axons.
(C) Percentage of ORN types in the whole ORN population that enter the antennal lobe at indicated time windows. The ORN types are ordered according to the time of the earliest arriving cases.
(D) Quantification of number of single-cell MARCM clones (x-axis, normalized per 10 brains) from early-arriving (light) and late-arriving (dark) ORN types examined in adults. Time of heat shock to induce clones are indicated on the y-axis. Numbers in the DP1m column indicate numbers of quantified brains per heat shock time point. The production of single-cell MARCM clones corresponds to the birth timing of ORNs. No obvious difference is seen between the birth timing of ORNs with early-arriving and late-arriving axons.
Figure S4. Temporal analysis of ipsilateral innervation of ORN axons, related to Figure 3.
(A-A’) Max intensity projection two-photon microscopy-based images show a DL1 ORN axon growing forward (A) and a DM3 ORN axon making a turn (A’) after leaving the midline (dashed vertical lines). The two images of DL1 and DM3 were taken 20 min apart. Arrows indicate the needle-shaped terminal of DL1 axon and more complex terminal of DM3 axon, which are magnified in insets.
(B) Quantification of the total number of transient branches of lateral glomeruli–targeting axons and medial glomeruli–targeting axons between leaving midline and entering contralateral antennal lobe. Error bars, SEM. t test; ***, P<0.001.
(C) Schematic showing two cellular mechanisms of branching: growth cone splitting and interstitial branching.
(D) Illustration of examples when imaging sessions i = 0, 1, n in determining axon branching mechanism, related to Figure 3C.
(E) Quantification of i from ORN types based on axon arrival time at the antennal lobe. Error bars are SEM. Statistical analyses were done using Kruskal-Wallis nonparametric ANOVA. N.S., P>0.05; *, P<0.05; ***, P<0.001.
(F, G) Two-photon microscopy-based time-lapse images of VL2a and DL1 ORNs showing examples of ORN types with large timing difference (F, small i) and small timing difference (G, large i) between ipsilateral and contralateral innervations.
Figure S5. Spatial analysis of ipsilateral innervation of ORN axons, related to Figure 3
(A) Schematic illustrating three possible mechanisms of ipsilateral innervation: (A1) genetically specified branching point closest to the target; (A2) random branching followed by growth of ipsilateral branch towards the target; (A3) multiple transient branches and stabilization of the branch close to the target.
(B) Schematic illustrating the calculation of ipsilateral branch point index y. We measured each axon’s curve length in the ipsilateral antennal lobe at the first imaging section after the axon crossed the midline and sent out the ipsilateral branch.
(C) An example of measuring y for DL2 and VC3. Two arrows on DL2 mark two ipsilateral branching points. By the time ORN axons crossed the midline, most ORN axons formed ipsilateral branch(es) at one location except DP1m and DL2 ORNs, which formed ipsilateral branches at two distinct locations (also see panel D).
(D) y from 90 single ORNs time-lapse-imaged are quantified and shown with their glomerular identities.
Numbers in brackets are SEMs from the same ORN type with ≥3 samples. In some ORN types, the ipsilateral branch extended from a single point on the main axon trunk (panel F), while in other ORN types the ipsilateral branch appeared in a continuous area along the axon (panel G). In the latter situation, we used the mid-point of the ipsilateral branching area to determine y.
(E) Quantification of the retraction speed of overshooting DM6 contralateral axons. Error bar: SEM. N = 8.
(F, G) Silhouettes showing the shapes of ipsilateral branches from 3 single DL1 (F) and 3 single DM1 (G) ORNs across time. Each row is a single ORN. The main axon shafts are shown in black and ipsilateral branches are shown in colors. Neighboring images are 1 hour apart except those in gray shade, which are 20 min apart. Arrows denote examples of branch retraction. Schematics on the left show the positions of the DL1 and DM1 glomeruli in the left antennal lobe.
Figure S6. AO-LLSM imaging of ORN axon targeting, related to Figure 4, and confocal images of microtubule distribution, related to Figure 5
(A) Max intensity projection confocal images from 4 time points taken with AO-LLSM showing ipsilateral innervation of VA1d and VA1v ORNs. The main axon fascicles first pass the VA1d and VA1v glomeruli (dashed circles). Then two interstitial branches innervate the glomeruli (arrows).
(B) Max intensity projection confocal images from 4 time points taken with AO-LLSM showing ipsilateral innervation of a VM6 ORN. The axon first innervates the VM6 glomerulus (dashed circle). Then an interstitial branch grows forward to cross the midline (arrow).
(C) Summary diagram of two interstitial branching patterns: contralateral-projecting branch first (as in panel A, green axon) or ipsilateral branch first (as in panel B, red axon).
(D) Summary map of ORN types that extend the contralateral projecting branch first (green) or ipsilateral innervation branch first (red) based on AO-LLSM imaging. One axon targeting to DA4m or DA4l cannot be determined due to the small size of the two glomeruli.
(E) Summary map of ORN types captured for exploring branches in the ipsilateral or contralateral antennal lobe. Dashed ovals represent cases where the axons target a particular region of the antennal lobe but the target glomeruli were not identified.
(F) Distribution of the number of exploring branches from single ORN axons.
(G) Max intensity projection confocal images of a post-innervation terminus taken at indicated time points of a fast scanning session, showing gradual and asynchronous retraction of post-innervation branches. Asterisks mark the ends of post-innervation branches.
(H) Max intensity projection confocal images of ORN axon terminals in fixed pupal brains from 34–36h
APF labeled by pebbled-GAL4-based MARCM clones co-expressing membrane-Halo (red) and EB1-GFP, visualized with JF-Halo-646 ligand and anti-GFP antibodies. Arrows mark EB1-GFP puncta at the tips of post-innervation branches.
(I, J) Max intensity projection confocal images of pre-targeting ORN axon from pebbled-GAL4-based MARCM clones co-expressing membrane marker (red) and utABD-GFP (green in I) or EB1-GFP (green in J). Arrows in I denote an ORN axon that is crossing the midline (vertical dashed line). F-actin is enriched at the tip of the needle-shaped terminus. A few ORN axons at different stages are shown in J with EB1-GFP (green) co-labeled with axon membrane (red). Arrow in J marks an ORN axon that just crossed the midline. The inset in J shows EB1-GFP staining in the ORN axon pointed by the arrow, with the higher intensity imaging setting than the EB1-GFP-only panel on the right.
(K, L) Max intensity projection confocal images of indicated types of photoreceptors from pebbled-GAL4-based MARCM clones co-expressing membrane marker (red) and utABD-GFP (green in K) or EB1-GFP (green in L). Open blue arrows (K) denote the hub from which terminal branches extend. Open blue arrowheads denote branches without F-actin. Solid blue arrows denote terminal branches filled with F-actin throughout. Solid magenta arrowheads (L) denote discrete microtubule fragments in terminal branches. Open magenta arrows indicate the hubs from which terminal branches extend. Similar distribution patterns have been observed in additional samples (utABD-GFP: N = 6 for R1–6, N = 3 for R7, and N = 2 for R8; EB1-GFP: N = 13 for R1–6, N = 5 for R7, and N = 4 for R8). Thus, F-actin is enriched in the hubs from which terminal branches emanate and microtubules are present in the terminal branches in all types of photoreceptors.
Figure S7. Additional data for the antennal severing experiments, related to Figures 6, 7
(A) Quantification of contralateral mistargeting and correct targeting of uncut ORN axons upon unilateral antennal nerve severing shown in an antennal lobe map with the ipsilateral branching waiting time i (Figure 3C) indicated with different colors. First and second numbers in a bracket indicate the number of single axons that mistarget and target correctly from each type, respectively. All cases quantified were from explants with one antennal nerve severed at 30h APF followed by 24h ex vivo culture.
(B) Schematic showing bilateral antennal nerve cutting.
(C) Glomerular maps showing PN types labeled by single-cell MARCM clones (DL1) or by two split-GAL4s.
(D) Max intensity projection confocal images of split7-GAL4;UAS-mCD8-GFP explants cultured for 24h with two antennae nerve intact or severed at the time of dissection at 20h. The bottom panels show split7-GAL4;UAS-mCD8-GFP brains dissected at 20h APF and 30h APF in vivo.
(E) Max intensity projection confocal images of Mz19-Gal4/vvl-FLP; UAS-CD8-FRT-GFP-FRT-RFP brain dissected at the indicated developmental stages. DA1 and VA1d/DC3 PNs are labeled in green and magenta, respectively. Note that dendrites of VA1d and DC3 PNs cannot be further distinguished and they are quantified together. Antennal lobes are outlined by dashed lines.
(F) Binary images generated from single section confocal images of 20h APF Mz19-Gal4/vvl-FLP; UAS-CD8-FRT-GFP-FRT-RFP brain. The outlines mark quantified DA1 ∪ VA1d/DC3, DA1∩VA1d/DC3, DA1 or VA1d/DC3 areas.
(G) Quantification of overlapping volume (DA1∩VA1d/DC3 in F) to total volume (DA1∪VA1d/DC3 in F) ratio for 20h, 30h and 48h APF (N = 20 for each stage). Statistical analysis was done using one-way ANOVA, followed by post hoc t test. ***, P<0.001 (P values corrected for multiple comparisons).
Movie 1. Time-lapse images showing targeting of AM29-GAL4+ ORN axons during development, related to Figure 1. The first half of the movie shows that AM29-GAL4+ ORN axons circumnavigate the antennal lobes and cross the midline. The second half of the movie shows that AM29-GAL4+ ORN axons innervate DM6 and DL4 glomeruli. Dashed circles outline the antenna lobes and dashed vertical line marks the midline. Max intensity projections of image stacks taken every 20 min using a two-photon microscope. The two halves of the movie represent two different explants.
Movie 2. Time-lapse images showing targeting of a single DM2 ORN axon, related to Figure 2. Dashed circles outline the antennal lobes and dashed vertical line marks the midline. Max intensity projections of image stacks taken every 20 min using a two-photon microscope.
Movie 3. Time-lapse images showing targeting of a single DP1m ORN axon, related to Figure 3. Dashed circles outline the antennal lobes and dashed vertical line marks the midline. Asterisks denote transient interstitial branches. Max intensity projections of image stacks taken every 20 min using a two-photon microscope.
Movie 4. Time-lapse images showing overshooting of single DM6 ORN axons (medial targeting axon in the movie) in the contralateral antennal lobe (right side) (first half movie) and pruning back as the explant developed for 22h in vitro (second half movie), related to Figure 3. Dashed lines outline the shape of the antennal lobe. Max intensity projections of image stacks taken every 3 min using a two-photon microscope.
Movie 5. Fast dynamics of the exploring branches during target searching, related to Figure 4. The first segment shows exploring branches from two ORN axons (same as Figure 4C; the right-most axon is unrelated). The second segment shows exploring branch from a single ORN axon in a different explant (same as Figure 4D). Dashed lines outline the shape of the antennal lobe. Max intensity projection image stacks taken every 30 sec using AO-LLSM.
Movie 6. Time-lapse images showing dendritic targeting of a single DL1 PN, related to Figure 7. The first half of the movie shows the active exploration of DL1 dendrites after initial innervation of the antennal lobe. The second half of the movie shows the decreased dynamics of DL1 dendrites during glomeruli boundary formation. Dendritic terminals and PN cell bodies were marked at the beginning of the movie. Max intensity projections of image stacks taken every 20 min using a two-photon microscope. The two halves of the movie show two different explants.
KEY RESOURCES TABLE
| REAGENT or RESOURCE | SOURCE | IDENTIFIER |
|---|---|---|
| Antibodies | ||
| Rat anti-DNcad | Developmental Studies Hybridoma Bank | Cat#DN-Ex #8 |
| Chicken anti-GFP | Aves Labs | Cat#GFP-1020 |
| Rabbit anti-GFP | Thermo Fisher Scientific | Cat#A-11122 |
| Mouse anti-GFP | Sigma | Cat#G6539 |
| Rabbit anti-RFP | Clontech | Cat#632475 |
| Experimental models: Organisms/strains | ||
| D. melanogaster: peb-GAL4 | (Sweeney et al., 2007) | N/A |
| D. melanogaster: AM29-GAL4 | (Endo et al., 2007) | N/A |
| D. melanogaster: Mz19-GAL4 | Bloomington Drosophila Stock Center (Ito et al., 1998) | BDSC:34497; FlyBase: FBst0034497 |
| D. melanogaster: split15-GAL4 | (Xie et al., 2021) | N/A |
| D. melanogaster: UAS-FRT100-stop-FRT100-mCD8-GFP | This study | N/A |
| D. melanogaster: UAS-FRT10-stop-FRT10-mCD8-GFP | This study | N/A |
| D. melanogaster: UAS-3xHalo7::CAAX | (Sutcliffe et al., 2017) | N/A |
| D. melanogaster: UAS-utABD-GFP | (Rauzi et al., 2010) | N/A |
| D. melanogaster: UAS-EB1-GFP | Bloomington Drosophila Stock Center (Rusan and Peifer, 2007) | BDSC:35512; FlyBase: FBst0035512 |
| D. melanogaster: UAS-GFP-αTub84B | Bloomington Drosophila Stock Center (Grieder et al., 2000) | BDSC:7373; FlyBase: FBst0007373 |
| D. melanogaster: UAS-mCD8-GFP | (Lee and Luo, 1999) | N/A |
| D. melanogaster: tub-GAL80 | (Lee and Luo, 1999) | N/A |
| D. melanogaster: hsFLP | (Golic and Lindquist, 1989) | N/A |
| D. melanogaster: vvl-FLP | Bloomington Drosophila Stock Center (Chen and Krasnow, 2014) | BDSC:64233; FlyBase: FBst0064233 |
| D. melanogaster: UAS-mCD8-FRT-GFP-FRT-RFP | (Stork et al., 2014) | |
| Oligonucleotides | ||
| FRT100-stop_forward: 5’-TAAGCGGCCGCGAAGTTCCTATTCCGAAGTTCCT ATTgTCTAGAAAGTATAGGAACTTCAGAGCGCTTTTGAAGCTAGAG-3’ |
this study | N/A |
| FRT100-stop_reverse: 5’- CTATTCACTCGAGGAAGTTCCTATACTTTCTAGA cAATAGGAACTTCGGAATAGGAACTTCAAGATCCCCCGGATCCTC-3’ |
this study | N/A |
| FRT10-stop_forward: 5’-TAAGCGGCCGCGAAGTTCCTATTCCGAAGTTCC TtTTCTCTAGAAAGTATAGGAACTTCAGAGCGCTTTTGAAGCTAGAG-3’ |
this study | N/A |
| FRT10-stop_reverse: 5’-CTATTCACTCGAGGAAGTTCCTATACTTTCTAG AGAAaAGGAACTTCGGAATAGGAACTTCAAGATCCCCCGGATCCTC-3’ |
this study | N/A |
| Recombinant DNA | ||
| pJFRC7–20XUAS-IVS-mCD8-GFP | (Pfeiffer et al., 2010) | RRID:Addgene_26220 |
| pUAST>stop>mCD8-GFP | (Potter et al., 2010) | RRID:Addgene_24385 |
| pUAS-FRT 100 -stop-FRT 100 -mCD8-GFP | This study | N/A |
| pUAS-FRT 10 -stop-FRT 10 -mCD8-GFP | This study | N/A |
| Software and algorithms | ||
| ImageJ | https://imagej.nih.gov/ij/ | |
| ZEN | Zeiss | https://www.zeiss.com/microscopy/us/products/microscope-software/zen-lite.html |
| Other | ||
| Schneider’s Drosophila medium | Thermo Fisher Scientific | Cat#21720001 |
| Penicillim Streptomycin | Thermo Fisher Scientific | Cat#15070063 |
| Fetal Bovine Serum | Thermo Fisher Scientific | Cat#16140071 |
| Human insulin recombinant zinc | Thermo Fisher Scientific | Cat#12585014 |
| 20-hydroxyecdysone | Sigma | Cat#H5142 |
| Sylgard 184 Silicone Encapsulant Clear | Ellsworth Adhesives | Cat#4019862 |
| Halo-JF-646 | (Grimm et al., 2017) | gift from Dr. Luke Lavis |
| Sulforhodamine 101 | Sigma | Cat#S7635 |
Highlights.
Establish an explant system for time-lapse imaging of fly olfactory circuit assembly
Image single ORNs from 30 types and characterize heterogeneous targeting behaviors
Fast imaging of ORN terminals reveals novel structure and cytoskeletal organization
Antennal nerve severing reveals requirement of bilateral ORNs in correct targeting
ACKNOWLEDGMENTS
We thank N. Özel and R. Hiesinger for their advice on the explant culture; T. Lecuit, L. Lavis, M. Freeman, and Bloomington Drosophila Stock Center for reagents; Y. Ge for assistance on fly work; J. Baruni, T. Brown, P. Dong, D. Friedmann, L. Lavis, J. Li, Z. Li, C. McLaughlin, D. Milkie, D. Pederick, K. Shen, Y. Takeo, G. Upadhyayula, R. Zhong for discussions; T. Lee for sharing equipment at Janelia Research Campus. H.L. was a Stanford Neuroscience Institute interdisciplinary postdoctoral scholar. E.B. and L.L. are HHMI investigators. This work was supported by National Institutes of Health grants 1K99DC01883001 (to T.L.) and R01-DC005982 (to L.L.).
Footnotes
Publisher's Disclaimer: This is a PDF file of an unedited manuscript that has been accepted for publication. As a service to our customers we are providing this early version of the manuscript. The manuscript will undergo copyediting, typesetting, and review of the resulting proof before it is published in its final form. Please note that during the production process errors may be discovered which could affect the content, and all legal disclaimers that apply to the journal pertain.
DECLARATION OF INTEREST
The authors declare no competing interests.
INCLUSION AND DIVERSITY
We worked to ensure sex balance in the selection of non-human subjects. While citing references scientifically relevant for this work, we also actively worked to promote gender balance in our reference list.
REFERENCES
- Akin O, and Zipursky SL (2016). Frazzled promotes growth cone attachment at the source of a Netrin gradient in the Drosophila visual system. Elife 5, e20762. [DOI] [PMC free article] [PubMed] [Google Scholar]
- Bak M, and Fraser SE (2003). Axon fasciculation and differences in midline kinetics between pioneer and follower axons within commissural fascicles. Development 130, 4999–5008. [DOI] [PubMed] [Google Scholar]
- Bentley D, and Caudy M (1983). Pioneer axons lose directed growth after selective killing of guidepost cells. Nature 304, 62–65. [DOI] [PubMed] [Google Scholar]
- Berns DS, DeNardo LA, Pederick DT, and Luo L (2018). Teneurin-3 controls topographic circuit assembly in the hippocampus. Nature 554, 328–333. [DOI] [PMC free article] [PubMed] [Google Scholar]
- Bischof J, Maeda RK, Hediger M, Karch F, and Basler K (2007). An optimized transgenesis system for Drosophila using germ-line-specific phiC31 integrases. Proc Natl Acad Sci U S A 104, 3312–3317. [DOI] [PMC free article] [PubMed] [Google Scholar]
- Chen BC, Legant WR, Wang K, Shao L, Milkie DE, Davidson MW, Janetopoulos C, Wu XS, Hammer JA 3rd, Liu Z, et al. (2014). Lattice light-sheet microscopy: imaging molecules to embryos at high spatiotemporal resolution. Science 346, 1257998. [DOI] [PMC free article] [PubMed] [Google Scholar]
- Chen F, and Krasnow MA (2014). Progenitor outgrowth from the niche in Drosophila trachea is guided by FGF from decaying branches. Science 343, 186–189. [DOI] [PMC free article] [PubMed] [Google Scholar]
- Corballis MC (2009). The evolution and genetics of cerebral asymmetry. Philos Trans R Soc Lond B Biol Sci 364, 867–879. [DOI] [PMC free article] [PubMed] [Google Scholar]
- Dent EW, Gupton SL, and Gertler FB (2011). The growth cone cytoskeleton in axon outgrowth and guidance. Cold Spring Harb Perspect Biol 3, a001800. [DOI] [PMC free article] [PubMed] [Google Scholar]
- Endo K, Aoki T, Yoda Y, Kimura K, and Hama C (2007). Notch signal organizes the Drosophila olfactory circuitry by diversifying the sensory neuronal lineages. Nat Neurosci 10, 153–160. [DOI] [PubMed] [Google Scholar]
- Fygenson DK, Marko JF, and Libchaber A (1997). Mechanics of Microtubule-Based Membrane Extension. PHYSICAL REVIEW LETTERS 22, 769–781. [Google Scholar]
- Godement P, Wang LC, and Mason CA (1994). Retinal axon divergence in the optic chiasm: dynamics of growth cone behavior at the midline. J Neurosci 14, 7024–7039. [DOI] [PMC free article] [PubMed] [Google Scholar]
- Golic KG, and Lindquist S (1989). The FLP recombinase of yeast catalyzes site-specific recombination in the Drosophila genome. Cell 59, 499–509. [DOI] [PubMed] [Google Scholar]
- Grieder NC, de Cuevas M, and Spradling AC (2000). The fusome organizes the microtubule network during oocyte differentiation in Drosophila. Development 127, 4253–4264. [DOI] [PubMed] [Google Scholar]
- Grimm JB, Brown TA, English BP, Lionnet T, and Lavis LD (2017). Synthesis of Janelia Fluor HaloTag and SNAP-Tag Ligands and Their Use in Cellular Imaging Experiments. Methods Mol Biol 1663, 179–188. [DOI] [PubMed] [Google Scholar]
- Grueber WB, Ye B, Moore AW, Jan LY, and Jan YN (2003). Dendrites of distinct classes of Drosophila sensory neurons show different capacities for homotypic repulsion. Curr Biol 13, 618–626. [DOI] [PubMed] [Google Scholar]
- Haas K, Li J, and Cline HT (2006). AMPA receptors regulate experience-dependent dendritic arbor growth in vivo. Proc Natl Acad Sci U S A 103, 12127–12131. [DOI] [PMC free article] [PubMed] [Google Scholar]
- Harris WA, Holt CE, and Bonhoeffer F (1987). Retinal axons with and without their somata, growing to and arborizing in the tectum of Xenopus embryos: a time-lapse video study of single fibres in vivo. Development 101, 123–133. [DOI] [PubMed] [Google Scholar]
- Harrison RG (1910). The outgrowth of the nerve fiber as a mode of protoplasmic movement. Journal of Experimental Zoology 9, 787–841. [DOI] [PubMed] [Google Scholar]
- Hong W, and Luo L (2014). Genetic control of wiring specificity in the fly olfactory system. Genetics 196, 17–29. [DOI] [PMC free article] [PubMed] [Google Scholar]
- Hong W, Mosca TJ, and Luo L (2012). Teneurins instruct synaptic partner matching in an olfactory map. Nature 484, 201–207. [DOI] [PMC free article] [PubMed] [Google Scholar]
- Hutson LD, and Chien CB (2002). Pathfinding and error correction by retinal axons: the role of astray/robo2. Neuron 33, 205–217. [DOI] [PubMed] [Google Scholar]
- Ito K, Suzuki K, Estes P, Ramaswami M, Yamamoto D, and Strausfeld NJ (1998). The organization of extrinsic neurons and their implications in the functional roles of the mushroom bodies in Drosophila melanogaster Meigen. Learn Mem 5, 52–77. [PMC free article] [PubMed] [Google Scholar]
- Jan YN, and Jan LY (2010). Branching out: mechanisms of dendritic arborization. Nat Rev Neurosci 11, 316–328. [DOI] [PMC free article] [PubMed] [Google Scholar]
- Jefferis GS, Marin EC, Stocker RF, and Luo L (2001). Target neuron prespecification in the olfactory map of Drosophila. Nature 414, 204–208. [DOI] [PubMed] [Google Scholar]
- Jefferis GS, Vyas RM, Berdnik D, Ramaekers A, Stocker RF, Tanaka NK, Ito K, and Luo L (2004). Developmental origin of wiring specificity in the olfactory system of Drosophila. Development 131, 117–130. [DOI] [PubMed] [Google Scholar]
- Joo WJ, Sweeney LB, Liang L, and Luo L (2013). Linking cell fate, trajectory choice, and target selection: genetic analysis of Sema-2b in olfactory axon targeting. Neuron 78, 673–686. [DOI] [PMC free article] [PubMed] [Google Scholar]
- Kalil K, and Dent EW (2014). Branch management: mechanisms of axon branching in the developing vertebrate CNS. Nat Rev Neurosci 15, 7–18. [DOI] [PMC free article] [PubMed] [Google Scholar]
- Kohl J, Ng J, Cachero S, Ciabatti E, Dolan MJ, Sutcliffe B, Tozer A, Ruehle S, Krueger D, Frechter S, et al. (2014). Ultrafast tissue staining with chemical tags. Proc Natl Acad Sci U S A 111, E3805–3814. [DOI] [PMC free article] [PubMed] [Google Scholar]
- Kolodkin AL, and Tessier-Lavigne M (2011). Mechanisms and molecules of neuronal wiring: a primer. Cold Spring Harb Perspect Biol 3, a001727. [DOI] [PMC free article] [PubMed] [Google Scholar]
- Langen M, Agi E, Altschuler DJ, Wu LF, Altschuler SJ, and Hiesinger PR (2015). The Developmental Rules of Neural Superposition in Drosophila. Cell 162, 120–133. [DOI] [PMC free article] [PubMed] [Google Scholar]
- Lee T, and Luo L (1999). Mosaic analysis with a repressible cell marker for studies of gene function in neuronal morphogenesis. Neuron 22, 451–461. [DOI] [PubMed] [Google Scholar]
- Li T, Giagtzoglou N, Eberl DF, Jaiswal SN, Cai T, Godt D, Groves AK, and Bellen HJ (2016). The E3 ligase Ubr3 regulates Usher syndrome and MYH9 disorder proteins in the auditory organs of Drosophila and mammals. Elife 5. [DOI] [PMC free article] [PubMed] [Google Scholar]
- Lin CH, Thompson CA, and Forscher P (1994). Cytoskeletal reorganization underlying growth cone motility. Curr Opin Neurobiol 4, 640–647. [DOI] [PubMed] [Google Scholar]
- Liu TL, Upadhyayula S, Milkie DE, Singh V, Wang K, Swinburne IA, Mosaliganti KR, Collins ZM, Hiscock TW, Shea J, et al. (2018). Observing the cell in its native state: Imaging subcellular dynamics in multicellular organisms. Science 360, eaaq1392. [DOI] [PMC free article] [PubMed] [Google Scholar]
- Lodato S, Shetty AS, and Arlotta P (2015). Cerebral cortex assembly: generating and reprogramming projection neuron diversity. Trends Neurosci 38, 117–125. [DOI] [PMC free article] [PubMed] [Google Scholar]
- McLaughlin T, and O’Leary DD (2005). Molecular gradients and development of retinotopic maps. Annu Rev Neurosci 28, 327–355. [DOI] [PubMed] [Google Scholar]
- Niell CM, Meyer MP, and Smith SJ (2004). In vivo imaging of synapse formation on a growing dendritic arbor. Nat Neurosci 7, 254–260. [DOI] [PubMed] [Google Scholar]
- Okumura M, Kato T, Miura M, and Chihara T (2016). Hierarchical axon targeting of Drosophila olfactory receptor neurons specified by the proneural transcription factors Atonal and Amos. Genes Cells 21, 53–64. [DOI] [PubMed] [Google Scholar]
- Ozel MN, Langen M, Hassan BA, and Hiesinger PR (2015). Filopodial dynamics and growth cone stabilization in Drosophila visual circuit development. Elife 4, e10721. [DOI] [PMC free article] [PubMed] [Google Scholar]
- Pfeiffer BD, Ngo TT, Hibbard KL, Murphy C, Jenett A, Truman JW, and Rubin GM (2010). Refinement of tools for targeted gene expression in Drosophila. Genetics 186, 735–755. [DOI] [PMC free article] [PubMed] [Google Scholar]
- Potter CJ, Tasic B, Russler EV, Liang L, and Luo L (2010). The Q system: a repressible binary system for transgene expression, lineage tracing, and mosaic analysis. Cell 141, 536–548. [DOI] [PMC free article] [PubMed] [Google Scholar]
- Rauzi M, Lenne PF, and Lecuit T (2010). Planar polarized actomyosin contractile flows control epithelial junction remodelling. Nature 468, 1110–1114. [DOI] [PubMed] [Google Scholar]
- Rusan NM, and Peifer M (2007). A role for a novel centrosome cycle in asymmetric cell division. J Cell Biol 177, 13–20. [DOI] [PMC free article] [PubMed] [Google Scholar]
- Sagasti A, Guido MR, Raible DW, and Schier AF (2005). Repulsive interactions shape the morphologies and functional arrangement of zebrafish peripheral sensory arbors. Curr Biol 15, 804–814. [DOI] [PubMed] [Google Scholar]
- Sanchez-Soriano N, Goncalves-Pimentel C, Beaven R, Haessler U, Ofner-Ziegenfuss L, Ballestrem C, and Prokop A (2010). Drosophila growth cones: a genetically tractable platform for the analysis of axonal growth dynamics. Dev Neurobiol 70, 58–71. [DOI] [PubMed] [Google Scholar]
- Sanes JR, and Zipursky SL (2020). Synaptic Specificity, Recognition Molecules, and Assembly of Neural Circuits. Cell 181, 1434–1435. [DOI] [PubMed] [Google Scholar]
- Santos TE, Schaffran B, Broguiere N, Meyn L, Zenobi-Wong M, and Bradke F (2020). Axon Growth of CNS Neurons in Three Dimensions Is Amoeboid and Independent of Adhesions. Cell Rep 32, 107907. [DOI] [PubMed] [Google Scholar]
- Senecoff JF, Rossmeissl PJ, and Cox MM (1988). DNA recognition by the FLP recombinase of the yeast 2 mu plasmid. A mutational analysis of the FLP binding site. J Mol Biol 201, 405–421. [DOI] [PubMed] [Google Scholar]
- Smith CJ, Watson JD, Spencer WC, O’Brien T, Cha B, Albeg A, Treinin M, and Miller DM 3rd (2010). Time-lapse imaging and cell-specific expression profiling reveal dynamic branching and molecular determinants of a multi-dendritic nociceptor in C. elegans. Dev Biol 345, 18–33. [DOI] [PMC free article] [PubMed] [Google Scholar]
- Stork T, Sheehan A, Tasdemir-Yilmaz OE, and Freeman MR (2014). Neuron-glia interactions through the Heartless FGF receptor signaling pathway mediate morphogenesis of Drosophila astrocytes. Neuron 83, 388–403. [DOI] [PMC free article] [PubMed] [Google Scholar]
- Sutcliffe B, Ng J, Auer TO, Pasche M, Benton R, Jefferis GS, and Cachero S (2017). Second-Generation Drosophila Chemical Tags: Sensitivity, Versatility, and Speed. Genetics 205, 1399–1408. [DOI] [PMC free article] [PubMed] [Google Scholar]
- Swanson LW (2011). Brain Architecture: Understanding the Basic Plan (2 ed.) (Oxford University Press; ). [Google Scholar]
- Sweeney LB, Couto A, Chou YH, Berdnik D, Dickson BJ, Luo L, and Komiyama T (2007). Temporal target restriction of olfactory receptor neurons by Semaphorin-1a/PlexinA-mediated axon-axon interactions. Neuron 53, 185–200. [DOI] [PubMed] [Google Scholar]
- Vosshall LB, and Stocker RF (2007). Molecular architecture of smell and taste in Drosophila. Annu Rev Neurosci 30, 505–533. [DOI] [PubMed] [Google Scholar]
- Wang K, Milkie DE, Saxena A, Engerer P, Misgeld T, Bronner ME, Mumm J, and Betzig E (2014). Rapid adaptive optical recovery of optimal resolution over large volumes. Nat Methods 11, 625–628. [DOI] [PMC free article] [PubMed] [Google Scholar]
- Wong AM, Wang JW, and Axel R (2002). Spatial representation of the glomerular map in the Drosophila protocerebrum. Cell 109, 229–241. [DOI] [PubMed] [Google Scholar]
- Wong HH, Lin JQ, Strohl F, Roque CG, Cioni JM, Cagnetta R, Turner-Bridger B, Laine RF, Harris WA, Kaminski CF, et al. (2017). RNA Docking and Local Translation Regulate Site-Specific Axon Remodeling In Vivo. Neuron 95, 852–868 e858. [DOI] [PMC free article] [PubMed] [Google Scholar]
- Wu JS, and Luo L (2006). A protocol for dissecting Drosophila melanogaster brains for live imaging or immunostaining. Nat Protoc 1, 2110–2115. [DOI] [PubMed] [Google Scholar]
- Xie Q, Brbic M, Horns F, Kolluru SS, Jones RC, Li J, Reddy AR, Xie A, Kohani S, Li Z, et al. (2021). Temporal evolution of single-cell transcriptomes of Drosophila olfactory projection neurons. Elife 10, e63450. [DOI] [PMC free article] [PubMed] [Google Scholar]
- Yates PA, Roskies AL, McLaughlin T, and O’Leary DD (2001). Topographic-specific axon branching controlled by ephrin-As is the critical event in retinotectal map development. J Neurosci 21, 8548–8563. [DOI] [PMC free article] [PubMed] [Google Scholar]
- Yost HJ (1998). Left-right development from embryos to brains. Dev Genet 23, 159–163. [DOI] [PubMed] [Google Scholar]
Associated Data
This section collects any data citations, data availability statements, or supplementary materials included in this article.
Supplementary Materials
Figure S1. The antennae–brain explant closely mimics normal olfactory circuit development, related to Figure 1
(A) Max intensity projection confocal images from explants (top row) or brains in vivo (bottom row). AM29-GAL4+ MARCM clones are labeled by expression of mCD8-GFP. Arrows mark ectopic targeting of AM29-GAL4+ ORN axons to ventral or lateral side of DM6 in both explants and in vivo.
(B) Quantifications of ectopic targeting of MARCM clones of AM29-GAL4+ ORN axons during development in vivo and ex vivo.
(C) Images from time-lapse videos taken by a two-photon microscope from pebbled-GAL4;UAS-mCD8-GFP explant at indicated time points.
(D) Max intensity projection confocal images from 3rd antennal segment at 48h APF. Different heat shock time induces different number of AM29-GAL4+ ORNs by UAS-FRT10-stop-FRT10-mCD8-GFP reporter.
Figure S2. Additional data of time-lapse imaging of single ORN axons during target selection, related to Figure 2
(A) Images from time-lapse videos from a two-photon microscope at the indicated time points of sparsely labeled ORNs from four samples (one per row). The identity of each ORN was revealed by fixing the explant at the end of the culture and staining with neuropil marker N-cadherin. Different single ORN axons are pseudocolored.
(B) Our experiments using sparse labeling of ORNs driven from the pan-ORN Pebbled-GAL4 covers 28 ORN types (Figure 2E, F). We also imaged 2 additional ORN types using AM29-GAL4 as a driver (Figure 1). In this panel, we use an antennal lobe map to highlight antennal ORNs not imaged (blue), the six maxillary palp ORN types (green, not imaged because they are not retained in the explant), and antennal ORNs imaged using AM29-GAL4 (magenta).
Figure S3. Axons from different ORN types reach the antennal lobe within different time windows, related to Figure 2
(A) ORN axons that enter the antennal lobe at different time windows were identified by dissecting the pupal brains at 26h, 30h, or 34h APF and selected based on the arrival at the antennal lobes, followed immediately by time-lapse imaging. Each ORN axon was tracked by time-lapse imaging and the targeting glomerular identity was determined by fixing and staining at the end of the 24–48h culture.
(B) Glomerular map showing the distribution of ORN types with early- (light), middle- (medium) and late- (dark) arriving axons.
(C) Percentage of ORN types in the whole ORN population that enter the antennal lobe at indicated time windows. The ORN types are ordered according to the time of the earliest arriving cases.
(D) Quantification of number of single-cell MARCM clones (x-axis, normalized per 10 brains) from early-arriving (light) and late-arriving (dark) ORN types examined in adults. Time of heat shock to induce clones are indicated on the y-axis. Numbers in the DP1m column indicate numbers of quantified brains per heat shock time point. The production of single-cell MARCM clones corresponds to the birth timing of ORNs. No obvious difference is seen between the birth timing of ORNs with early-arriving and late-arriving axons.
Figure S4. Temporal analysis of ipsilateral innervation of ORN axons, related to Figure 3.
(A-A’) Max intensity projection two-photon microscopy-based images show a DL1 ORN axon growing forward (A) and a DM3 ORN axon making a turn (A’) after leaving the midline (dashed vertical lines). The two images of DL1 and DM3 were taken 20 min apart. Arrows indicate the needle-shaped terminal of DL1 axon and more complex terminal of DM3 axon, which are magnified in insets.
(B) Quantification of the total number of transient branches of lateral glomeruli–targeting axons and medial glomeruli–targeting axons between leaving midline and entering contralateral antennal lobe. Error bars, SEM. t test; ***, P<0.001.
(C) Schematic showing two cellular mechanisms of branching: growth cone splitting and interstitial branching.
(D) Illustration of examples when imaging sessions i = 0, 1, n in determining axon branching mechanism, related to Figure 3C.
(E) Quantification of i from ORN types based on axon arrival time at the antennal lobe. Error bars are SEM. Statistical analyses were done using Kruskal-Wallis nonparametric ANOVA. N.S., P>0.05; *, P<0.05; ***, P<0.001.
(F, G) Two-photon microscopy-based time-lapse images of VL2a and DL1 ORNs showing examples of ORN types with large timing difference (F, small i) and small timing difference (G, large i) between ipsilateral and contralateral innervations.
Figure S5. Spatial analysis of ipsilateral innervation of ORN axons, related to Figure 3
(A) Schematic illustrating three possible mechanisms of ipsilateral innervation: (A1) genetically specified branching point closest to the target; (A2) random branching followed by growth of ipsilateral branch towards the target; (A3) multiple transient branches and stabilization of the branch close to the target.
(B) Schematic illustrating the calculation of ipsilateral branch point index y. We measured each axon’s curve length in the ipsilateral antennal lobe at the first imaging section after the axon crossed the midline and sent out the ipsilateral branch.
(C) An example of measuring y for DL2 and VC3. Two arrows on DL2 mark two ipsilateral branching points. By the time ORN axons crossed the midline, most ORN axons formed ipsilateral branch(es) at one location except DP1m and DL2 ORNs, which formed ipsilateral branches at two distinct locations (also see panel D).
(D) y from 90 single ORNs time-lapse-imaged are quantified and shown with their glomerular identities.
Numbers in brackets are SEMs from the same ORN type with ≥3 samples. In some ORN types, the ipsilateral branch extended from a single point on the main axon trunk (panel F), while in other ORN types the ipsilateral branch appeared in a continuous area along the axon (panel G). In the latter situation, we used the mid-point of the ipsilateral branching area to determine y.
(E) Quantification of the retraction speed of overshooting DM6 contralateral axons. Error bar: SEM. N = 8.
(F, G) Silhouettes showing the shapes of ipsilateral branches from 3 single DL1 (F) and 3 single DM1 (G) ORNs across time. Each row is a single ORN. The main axon shafts are shown in black and ipsilateral branches are shown in colors. Neighboring images are 1 hour apart except those in gray shade, which are 20 min apart. Arrows denote examples of branch retraction. Schematics on the left show the positions of the DL1 and DM1 glomeruli in the left antennal lobe.
Figure S6. AO-LLSM imaging of ORN axon targeting, related to Figure 4, and confocal images of microtubule distribution, related to Figure 5
(A) Max intensity projection confocal images from 4 time points taken with AO-LLSM showing ipsilateral innervation of VA1d and VA1v ORNs. The main axon fascicles first pass the VA1d and VA1v glomeruli (dashed circles). Then two interstitial branches innervate the glomeruli (arrows).
(B) Max intensity projection confocal images from 4 time points taken with AO-LLSM showing ipsilateral innervation of a VM6 ORN. The axon first innervates the VM6 glomerulus (dashed circle). Then an interstitial branch grows forward to cross the midline (arrow).
(C) Summary diagram of two interstitial branching patterns: contralateral-projecting branch first (as in panel A, green axon) or ipsilateral branch first (as in panel B, red axon).
(D) Summary map of ORN types that extend the contralateral projecting branch first (green) or ipsilateral innervation branch first (red) based on AO-LLSM imaging. One axon targeting to DA4m or DA4l cannot be determined due to the small size of the two glomeruli.
(E) Summary map of ORN types captured for exploring branches in the ipsilateral or contralateral antennal lobe. Dashed ovals represent cases where the axons target a particular region of the antennal lobe but the target glomeruli were not identified.
(F) Distribution of the number of exploring branches from single ORN axons.
(G) Max intensity projection confocal images of a post-innervation terminus taken at indicated time points of a fast scanning session, showing gradual and asynchronous retraction of post-innervation branches. Asterisks mark the ends of post-innervation branches.
(H) Max intensity projection confocal images of ORN axon terminals in fixed pupal brains from 34–36h
APF labeled by pebbled-GAL4-based MARCM clones co-expressing membrane-Halo (red) and EB1-GFP, visualized with JF-Halo-646 ligand and anti-GFP antibodies. Arrows mark EB1-GFP puncta at the tips of post-innervation branches.
(I, J) Max intensity projection confocal images of pre-targeting ORN axon from pebbled-GAL4-based MARCM clones co-expressing membrane marker (red) and utABD-GFP (green in I) or EB1-GFP (green in J). Arrows in I denote an ORN axon that is crossing the midline (vertical dashed line). F-actin is enriched at the tip of the needle-shaped terminus. A few ORN axons at different stages are shown in J with EB1-GFP (green) co-labeled with axon membrane (red). Arrow in J marks an ORN axon that just crossed the midline. The inset in J shows EB1-GFP staining in the ORN axon pointed by the arrow, with the higher intensity imaging setting than the EB1-GFP-only panel on the right.
(K, L) Max intensity projection confocal images of indicated types of photoreceptors from pebbled-GAL4-based MARCM clones co-expressing membrane marker (red) and utABD-GFP (green in K) or EB1-GFP (green in L). Open blue arrows (K) denote the hub from which terminal branches extend. Open blue arrowheads denote branches without F-actin. Solid blue arrows denote terminal branches filled with F-actin throughout. Solid magenta arrowheads (L) denote discrete microtubule fragments in terminal branches. Open magenta arrows indicate the hubs from which terminal branches extend. Similar distribution patterns have been observed in additional samples (utABD-GFP: N = 6 for R1–6, N = 3 for R7, and N = 2 for R8; EB1-GFP: N = 13 for R1–6, N = 5 for R7, and N = 4 for R8). Thus, F-actin is enriched in the hubs from which terminal branches emanate and microtubules are present in the terminal branches in all types of photoreceptors.
Figure S7. Additional data for the antennal severing experiments, related to Figures 6, 7
(A) Quantification of contralateral mistargeting and correct targeting of uncut ORN axons upon unilateral antennal nerve severing shown in an antennal lobe map with the ipsilateral branching waiting time i (Figure 3C) indicated with different colors. First and second numbers in a bracket indicate the number of single axons that mistarget and target correctly from each type, respectively. All cases quantified were from explants with one antennal nerve severed at 30h APF followed by 24h ex vivo culture.
(B) Schematic showing bilateral antennal nerve cutting.
(C) Glomerular maps showing PN types labeled by single-cell MARCM clones (DL1) or by two split-GAL4s.
(D) Max intensity projection confocal images of split7-GAL4;UAS-mCD8-GFP explants cultured for 24h with two antennae nerve intact or severed at the time of dissection at 20h. The bottom panels show split7-GAL4;UAS-mCD8-GFP brains dissected at 20h APF and 30h APF in vivo.
(E) Max intensity projection confocal images of Mz19-Gal4/vvl-FLP; UAS-CD8-FRT-GFP-FRT-RFP brain dissected at the indicated developmental stages. DA1 and VA1d/DC3 PNs are labeled in green and magenta, respectively. Note that dendrites of VA1d and DC3 PNs cannot be further distinguished and they are quantified together. Antennal lobes are outlined by dashed lines.
(F) Binary images generated from single section confocal images of 20h APF Mz19-Gal4/vvl-FLP; UAS-CD8-FRT-GFP-FRT-RFP brain. The outlines mark quantified DA1 ∪ VA1d/DC3, DA1∩VA1d/DC3, DA1 or VA1d/DC3 areas.
(G) Quantification of overlapping volume (DA1∩VA1d/DC3 in F) to total volume (DA1∪VA1d/DC3 in F) ratio for 20h, 30h and 48h APF (N = 20 for each stage). Statistical analysis was done using one-way ANOVA, followed by post hoc t test. ***, P<0.001 (P values corrected for multiple comparisons).
Movie 1. Time-lapse images showing targeting of AM29-GAL4+ ORN axons during development, related to Figure 1. The first half of the movie shows that AM29-GAL4+ ORN axons circumnavigate the antennal lobes and cross the midline. The second half of the movie shows that AM29-GAL4+ ORN axons innervate DM6 and DL4 glomeruli. Dashed circles outline the antenna lobes and dashed vertical line marks the midline. Max intensity projections of image stacks taken every 20 min using a two-photon microscope. The two halves of the movie represent two different explants.
Movie 2. Time-lapse images showing targeting of a single DM2 ORN axon, related to Figure 2. Dashed circles outline the antennal lobes and dashed vertical line marks the midline. Max intensity projections of image stacks taken every 20 min using a two-photon microscope.
Movie 3. Time-lapse images showing targeting of a single DP1m ORN axon, related to Figure 3. Dashed circles outline the antennal lobes and dashed vertical line marks the midline. Asterisks denote transient interstitial branches. Max intensity projections of image stacks taken every 20 min using a two-photon microscope.
Movie 4. Time-lapse images showing overshooting of single DM6 ORN axons (medial targeting axon in the movie) in the contralateral antennal lobe (right side) (first half movie) and pruning back as the explant developed for 22h in vitro (second half movie), related to Figure 3. Dashed lines outline the shape of the antennal lobe. Max intensity projections of image stacks taken every 3 min using a two-photon microscope.
Movie 5. Fast dynamics of the exploring branches during target searching, related to Figure 4. The first segment shows exploring branches from two ORN axons (same as Figure 4C; the right-most axon is unrelated). The second segment shows exploring branch from a single ORN axon in a different explant (same as Figure 4D). Dashed lines outline the shape of the antennal lobe. Max intensity projection image stacks taken every 30 sec using AO-LLSM.
Movie 6. Time-lapse images showing dendritic targeting of a single DL1 PN, related to Figure 7. The first half of the movie shows the active exploration of DL1 dendrites after initial innervation of the antennal lobe. The second half of the movie shows the decreased dynamics of DL1 dendrites during glomeruli boundary formation. Dendritic terminals and PN cell bodies were marked at the beginning of the movie. Max intensity projections of image stacks taken every 20 min using a two-photon microscope. The two halves of the movie show two different explants.
Data Availability Statement
All time-lapse imaging raw data generated in this study are available from the lead contact upon request.
No code was generated in this study.
Any additional information required to reanalyze the data reported in this paper is available from the lead contact upon request.